The XXL Survey VII: A supercluster of galaxies at z=0.43††thanks: This work is based on observations obtained with XMM-Newton, an ESA science mission with instruments and contributions directly funded by ESA Member States and the USA (NASA) and on observations obtained at the WHT thanks to the International Time Programme (CCI) and the Opticon FP7 program. It also used observations made with ESO Telescopes at the La Silla Paranal Observatory under programme LP 191.A-0268
Abstract
Context. The XXL Survey is the largest homogeneous and contiguous survey carried out with XMM-Newton. Covering an area of 50 deg2 distributed over two fields, it primarily investigates the large-scale structures of the Universe using the distribution of galaxy clusters and active galactic nuclei as tracers of the matter distribution.
Aims. Given its depth and sky coverage, XXL is particularly suited to systematically unveiling the clustering of X-ray clusters and to identifying superstructures in a homogeneous X-ray sample down to the typical mass scale of a local massive cluster.
Methods. A friends-of-friends algorithm in three-dimensional physical space was run to identify large-scale structures. In this paper we report the discovery of the highest redshift supercluster of galaxies found in the XXL Survey. We describe the X-ray properties of the clusters members of the structure and the optical follow-up.
Results. The newly discovered supercluster is composed of six clusters of galaxies at a median redshift z0.43 and distributed across 30 15 (105 Mpc) on the sky. This structure is very compact with all the clusters residing in one XMM pointing; for this reason this is the first supercluster discovered with the XXL Survey. Photometric redshifts from the CFHTLS (Canada-France-Hawaii Telescope Legacy Survey) data release T0007 placed the supercluster at an approximate redshift of zphot0.45; subsequent spectroscopic follow-up with WHT (William Herschel Telescope) and NTT (New Technology Telescope) confirmed a median redshift of z0.43. An estimate of the X-ray mass and luminosity of this supercluster returns values of 1.71015 M⊙ and of 1.681044 erg s-1, respectively, and a total gas mass of Mgas=9.31013M⊙. These values put XLSSC-e at the average mass range of superclusters; its appearance, with two members of equal size, is quite unusual with respect to other superclusters and provides a unique view of the formation process of a massive structure.
Key Words.:
clusters of galaxies – superclusters – multi-wavelength surveys.1 Introduction
Clusters of galaxies are promising tools that can be used to test cosmology and the predictions of General
Relativity since they probe both the geometry of the universe and the growth of structure.
The XXL project (Pierre et al. 2016, hereafter paper I) is a large XMM survey at
medium X-ray depth. It comprises two regions of 25 deg2 each located on the celestial
equator (XMM-LSS field) and on the southern hemisphere (BCS field). The main goal of XXL is
to detect and use approximately 500 galaxy clusters (0 ¡ z ¡ 1) to constrain the
time evolution of the Dark Energy equation of state (Pierre et al. 2011).
Moreover, XXL provides an unprecedented volume between 0.5 z ¡ 1 with which to study the nature
and evolutionary properties of groups, clusters, and superclusters of galaxies.
The formation of a web of galaxies and systems of galaxies is predicted in the current
cosmological paradigm where galaxies and galaxy systems form because of the constant amplification
of initially very small fluctuations in the matter density.
Density perturbations on scales ranging from 100 h-1 Mpc down to 10 h-1 Mpc give
rise to the largest systems of galaxies, the super-clusters, ranging from rich, large
super-clusters containing many massive clusters extending over 10-20 Mpc down to less
massive structures containing groups and poor clusters of the order of
1013-1014 M⊙ each (e.g.
Einasto et al. (2011) and references therein).
The superclusters, already
decoupled from the Hubble flow, are not yet virialised, but most of them will collapse under the effect of gravity.
At larger scales dynamical evolution proceeds at a slower rate and super-clusters have
retained the memory of the initial conditions of their formation. Therefore they are
important sites where we can directly witness the process of structure formation and
evolution and the mass assembly to form clusters.
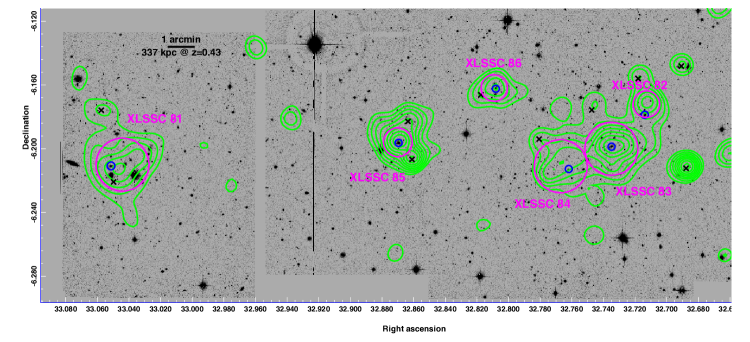
In this paper we analyse a supercluster of galaxies, XLSSC-e, at redshift z0.43, the highest redshift supercluster found in XXL. It was obtained as a result of a percolation analysis with a linking length of 35 Mpc applied to the sample of the 100 brightest clusters (hereafter XXL-100-GC111XXL-100-GC data are available in computer readable form via the XXL master catalogue browser: http://cosmosdb.iasf-milano.inaf.it/XXL) detected in the XXL Survey (Pacaud et al. 2016, hereafter paper II).
It is composed of six cluster-sized galaxy concentrations (the Abell radius, RAbell, is 1.2 Mpc at the mean supercluster redshift). They have all been independently well detected as significantly extended X-ray sources; all of them belong to the class of C1 clusters, i.e. the most secure and uncontaminated detections in the XXL cluster sample (see paper II); and three (XLSSC 083, XLSSC 084, XLSSC 085) are part of the 100 brightest XXL clusters. Below we describe the existing multiwavelength observations, the results obtained so far, and our conclusions. We adopted a cosmology where =0.282, =0.718, H0= 69.7 km/s/Mpc, i.e. (WMAP9+BAO), plus constraints on H0 from Cepheids and type Ia supernovae, same as in paper II.
2 Observations and data reduction
Based on a cluster search using photometric redshifts in the CFHTLS wide
fields, Durret et al. (2011) identified one
potential cluster at zphot=0.48 located at RA=32.7603,
DEC=-6.1936, and
6.55 away from our XLSSC 085 cluster; this corresponds
approximately to the position of the BCG of XLSSC 084.
From the XXL XMM observations, we have inferred, to date, the presence of
five superclusters (paper II).
With a redshift of 0.45, XLSSC-e – which is the subject of the present paper – is the most distant one. It consists of
six X-ray emitting clusters arranged in a compact structure (15’x30’), all components residing in a single XMM
pointing.
Subsequent optical spectroscopy with the WHT (Kouloridis et al., 2016, hereafter paper XII)
confirmed the redshift of the structure.
2.1 X-ray observations
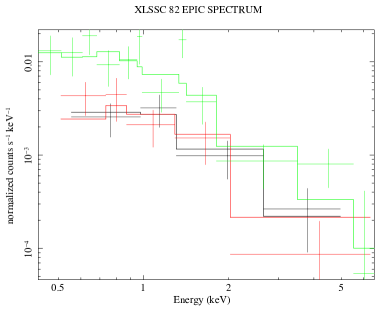
The data processing and the sample selection are fully described in paper II. The spectral analysis performed to obtain temperature and luminosity measurements and the estimate of the mass are described in Giles et al. (2016, hereafter paper III) and Lieu et al. (2016, hereafter paper IV). These steps are briefly summarised here. The XXL observation was filtered by soft proton flares and images, exposure maps, and detector masks were generated and processed using the Xamin pipeline (Pacaud et al. 2006). Source detection and source extent were determined through a SExtractor run followed by a dedicated XMM maximum likelihood fitting procedure. To account for the background in the spectral analysis, local backgrounds taken at the same off-axis position as the cluster were used. Cluster spectra were extracted for each of the XMM cameras and fits performed in the 0.4-7.0 keV band with an absorbed APEC (Smith et al. 2001) model modified by Galactic absorption (Kalberla et al. 2005) and with a fixed metal abundance of 0.3(Anders et al. 1989). The statistic cstar was used and both source and background spectra were binned to 5 counts per bin at least (Willis et al. 2005). The typical X-ray spectrum is shown in Fig. 1.
The temperature () and luminosity (in the 0.5-2 keV band, ) were derived within 300kpc for each cluster as this radius is the largest radius for which a temperature could be derived for XXL-100-GC. The same aperture and procedure adopted for XXL-100-GC was used for the three clusters of XLSSC-e which are not in XXL-100-GC. As in paper III, we adopted the relation derived in paper IV to obtain the mass within an overdensity of 500 (, hereafter). Individual gas masses for each cluster were obtained following the method described in (Eckert et al. 2016), hereafter paper XIII. Namely, surface-brightness profiles were extracted from the X-ray peak after correcting for vignetting and subtracting the background. To obtain the gas mass, the profiles were deprojected assuming spherical symmetry, converted into density, and integrated over the volume. These quantities are reported for each cluster in Table 1.
| Group ID | Class | RA | DEC | zspec | Ngal | |||||
|---|---|---|---|---|---|---|---|---|---|---|
| (J2000) | (J2000) | keV | 1043 erg s-1 | 1043 erg s-1 | 1014M⊙ | 1013 M⊙ | ||||
| XLSSC 081 | C1 | 33.044 | -6.210 | 0.4280.001 | 5 | 1.7 | 1.490.34 | 1.730.39 | 0.70.4 | 1.5 |
| XLSSC 082 | C1 | 32.714 | -6.173 | 0.4240.002 | 4 | 3.9 | 1.710.28 | 2.430.40 | 2.92.5 | 1.1 |
| XLSSC 083 | C1 | 32.735 | -6.200 | 0.4300.004 | 3 | 4.8 | 3.130.25 | 4.790.39 | 4.12.5 | 1.4 |
| XLSSC 084 | C1 | 32.767 | -6.211 | 0.4300.002 | 4 | 4.5 | 1.380.21 | 2.060.32 | 3.73.9 | 1.7 |
| XLSSC 085 | C1 | 32.870 | -6.196 | 0.4280.003 | 4 | 4.8 | 2.830.29 | 4.330.44 | 4.13.5 | 2.7 |
| XLSSC 086 | C1 | 32.809 | -6.162 | 0.4240.001 | 5 | 2.6 | 1.120.31 | 1.430.40 | 1.51.3 | 0.9 |
2.2 Optical observations
2.2.1 Photometry
The brightest cluster galaxy (BCG) for each cluster was identified by choosing the brightest
galaxy in the MegaCam z filter within r 0.5 r500 of the X-ray emission centroid (see Lavoie et al., in prep.,
for
the full catalog of BCGs in the full sample of the 100 brightest XXL clusters).
We corrected the g and r magnitudes for extinction following Schlegel et al. (1998)
and we
used k corrections from Chilingarian et al. (2010)222http://kcor.sai.msu.ru/.
Assuming an absolute
solar magnitude of 4.67 in r, and neglecting correction for passive evolution, we calculated the r luminosity for each
BCG; finally, we calculated their mass using the relation
log(M∗/L⊙)=-0.306+1.097(g-r)
from Bell et al. (2003).
2.2.2 Spectroscopy
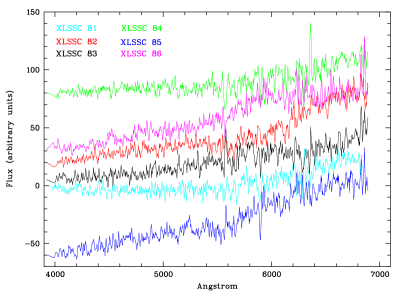
We observed the super-cluster with the 4.2m William Herschel Telescope (WHT) during four nights in 2013 (29-30 October and 9-10 November) using the AutoFib2+WYFFOS (AF2) spectrograph with a fibre diameter of 1.6, covering the spectral range from 3800 to 7000 , an instrumental resolution of 4.4 . We limited ourselves to the central 20 to minimise the effects of vignetting. Exposure times were 2.5h and 3.5h for the bright (19 r SDSS 20.5) and faint targets (20.5 r SDSS 21), respectively. During this run fibres were allocated on the BCG galaxy of each structure, and the surrounding galaxies within 1 Mpc of each BCG; a total of 15 galaxies were confirmed spectroscopically as cluster members. Further details about the data reduction and analysis can be found in paper XII.
| Cluster name | RA (2000) | DEC (2000) | z |
|---|---|---|---|
| XLSSC 081 | 33.03092 | -6.21239 | 0.42170.0006 |
| 33.05433 | -6.21797 | 0.43100.0006 | |
| 33.07499 | -6.16943 | 0.43650.0008 | |
| 33.08085 | -6.21790 | 0.42850.0008 | |
| 33.05150 | -6.21080 | 0.42660.0004 | |
| XLSSC 082 | 32.69952 | -6.17843 | 0.43100.0003 |
| 32.71404 | -6.17883 | 0.42400.0005 | |
| 32.71432 | -6.17522 | 0.42390.0004 | |
| 32.71715 | -6.17787 | 0.42010.0007 | |
| XLSSC 083 | 32.71678 | -6.18519 | 0.43990.0005 |
| 32.73504 | -6.19842 | 0.42980.0005 | |
| 32.73862 | -6.20253 | 0.44220.0006 | |
| XLSSC 084 | 32.75402 | -6.20126 | 0.41800.0011 |
| 32.76217 | -6.21303 | 0.43240.0005 | |
| 32.76234 | -6.19310 | 0.43120.0017 | |
| 32.77803 | -6.21378 | 0.42860.0011 | |
| XLSSC 085 | 32.86146 | -6.18232 | 0.42830.0007 |
| 32.86293 | -6.20681 | 0.43550.0006 | |
| 32.86983 | -6.19639 | 0.42880.0005 | |
| 32.88399 | -6.21361 | 0.42670.0007 | |
| XLSSC 086 | 32.79592 | -6.16700 | 0.42430.0005 |
| 32.79750 | -6.19569 | 0.43100.0005 | |
| 32.80875 | -6.16600 | 0.42350.0008 | |
| 32.80908 | -6.15931 | 0.42350.0005 | |
| 32.81446 | -6.18642 | 0.41090.0005 |
The redshift of the galaxy identified as the BCG of XLSSC 084 and other additional member candidates (see Table 2) was obtained with NTT+EFOSC2, covering the spectral range from 5000 to 9300 with an instrumental resolution of 4.1 .
The relevant parameters for all the BCGs in the supercluster are shown in Table 3, while the final spectra are shown in Figure 2.
The mass was obtained using the M-L relation from Bell et al. (2003); an uncertainty of 10 should be assumed on the mass estimate.
| BCG | RA | DEC | z | (g-r) | Mr | Mass |
|---|---|---|---|---|---|---|
| Clus-no. | (2000) | (2000) | 1011M | |||
| XLSSC 081 | 33.0515 | -6.21080 | 0.42660.0006 | 1.53 | -21.61 | 7.7 |
| XLSSC 082 | 32.7140 | -6.17883 | 0.42400.0005 | 1.42 | -21.76 | 6.7 |
| XLSSC 083 | 32.7350 | -6.19845 | 0.43030.0007 | 1.59 | -21.80 | 10.6 |
| XLSSC 084 | 32.7621 | -6.21303 | 0.43240.0004 | 1.51 | -21.04 | 4.2 |
| XLSSC 085 | 32.8697 | -6.19631 | 0.42890.0008 | 1.56 | -22.27 | 15.1 |
| XLSSC 086 | 32.8081 | -6.16231 | 0.42570.0006 | 1.39 | -21.51 | 4.9 |
We calculated the relative velocity of each cluster, assuming as the centre of the structure the BCG of XLSSC 085, the most massive cluster in the structure; we found that the other clusters move with a relative speed between 210 km/s and 840 km/s with an estimated error of the order of 95 km/s.
3 Results
From the data sets presented above, we can extract the following results:
-
•
We are observing a supercluster with a multiplicity of 6 (we observe six distinct clusters of galaxies, each with its own BCG) with a total extent of 112.9 Mpc in the sky and 21 Mpc along the line of sight. The total X-ray derived mass is 1.71015M⊙, while the gas mass is Mgas=9.31013M⊙. From the total estimated gas mass and total mass of the system, we infer an average gas fraction of in the supercluster; this is typical of what we observe in XXL clusters, see paper XIII.
-
•
The optical appearance of four out of the six clusters seems undisturbed and the X-ray emission is centred on the BCG, as can be seen in Fig.1. On the other hand, XLSSC 082 and, especially, XLSSC 084, show an elongated appearance on the sky, preferentially along the axis XLSSC 082-XLSSC 083-XLSSC 084. The X-ray emission in these three clusters shows a common envelope.
-
•
Two of the BCGs, XLSSC 082 and XLSSC 084, show a large separation from the X-ray emission centroid at 149 kpc and 202 kpc respectively. An offset between the BCG and the average redshift of the cluster is also evident in the optical data for XLSSC 084 where we measure a velocity difference of 700 km/s, while this is not observed for XLSSC 082. This likely indicates that XLSSC 084 is in a merging state (see Adami 2000), as also suggested by its disturbed X-ray morphology.
-
•
An estimate of the crossing time of the supercluster is tc = 2.11 Gyr, while the average escape velocity is of the order of 3.5103km/s.
4 Discussion and conclusions
XLSSC-e is currently the most massive and most distant supercluster of galaxies found in XXL.
In the literature, starting from the original definition of superclusters (see Bachall (1984))
there are several catalogues of superclusters, mostly based on optical data.
Only in the last two years (see Chon et al. (2013)) has a search for superclusters based purely on X-ray detection been
pursued; it reaches out to z 0.4, and we note that
no supercluster with more than three members can be found beyond redshift z0.2, most likely because of the depth of the
RASS survey.
XXL is the second survey which has detected several superclusters of galaxies and gone beyond z=0.4.
As already highlighted in paper II,
the selection method used for XXL superclusters has the advantage of relying only on galaxy structures showing clear evidence of
a deep potential well and further extend the volume used for such study (z 0.3).
Although a few isolated very high redshift superclusters are known, e.g. (Gal et al. 2004),
our work is the first attempt to systematically unveil superstructures up to z 0.5 in a homogeneous X-ray sample.
If we compare our supercluster with the low redshift sample of Chon et al. (2013) we find that its X-ray luminosity
( erg s-1 in the 0.1-2.4 keV band
relevant for the comparison) is close to the median of that sample; with respect to other supercluster
at z 0.4 (see Verdugo et al. 2012; Geach et al. 2011; Schirmer et al. 2011; Lubin et al. 2009; Kartaltepe et al. 2008; Tanaka et al. 2007)
our object has a total mass ( obtained using a conversion of =1.52, Piffaretti et al. 2011)
of M⊙, again in the middle of the range of the few known objects (see e.g. Table 1 in Schirmer et al. 2011).
On the other hand, XLSSC-e tends to differ from other known superclusters at those redshifts: instead of having a massive
central cluster with infalling filaments and smaller structures, it has almost two equal-sized objects, making it
qualitatively different from the network around an already formed massive cluster such as RXJ 1347 (Verdugo et al. 2012).
While it is very difficult to infer any dynamical information from such a small number of redshifts, if we
put together the relatively small crossing time, the
common X-ray emission of three members, and the measured gas fraction and mass, we can speculate that we are observing an un-relaxed
structure with an ongoing merging between at least three of the member clusters.
If nothing else intervenes to alter the system, and assuming that the estimated crossing time is a good estimate of the merging
time, it is likely that
the supercluster will have completely merged in 2.5 Gyr and will resemble a
massive cluster of galaxies similar to the most massive known clusters, such as RXJ 1347. The observed
gas should be progressively heated up by gravitational collapse
and should relax after a few dynamical timescales, thus creating a hot, luminous X-ray halo similar to the ones observed
in local massive clusters.
Subsequent extensive spectroscopic follow-up and a kinematic analysis are needed to confirm this hypothesis and
to study the galaxy population of this and other large structures discovered by XXL. A study of the surrounding environment
of XLSSC-e has been already done by ((Baran et al. 2016), hereafter paper IX) using photometric redshifts.
Acknowledgements.
XXL is an international project based around an XMM Very Large Programme surveying two 25 deg2 extragalactic fields at a depth of 5 10-15 erg cm-2 s-1 in the [0.5-2] keV band for point-like sources. The XXL website is http://irfu.cea.fr/xxl. Multiband information and spectroscopic follow-up of the X-ray sources are obtained through a number of survey programmes, summarised at http://xxlmultiwave.pbworks.com/. The authors wish to acknowledge the support from the staff at WHT and La Silla; we also thank the French PNCG and the French-Italian PICS for financial support which made this work possible. FP acknowledges support from the DLR Verbunforschung grant 50 OR 1117 and from the DFG Transregional Program TR33. NBa and VSmo acknowledge the funding by the European Union’s Seventh Frame-work programs under grant agreements 333654 (CIG, ‘AGN feedback’) and 337595 (ERC Starting Grant, ‘CoSMass’). YJ acknowledges support by FONDECYT grant N. 3130476References
- Adami (2000) Adami C., Ulmer M.P., 2000, A&A 361, 13
- Anders et al. (1989) Anders, E., Grevesse, N., 1989 GeCoA, 53, 197
- Bachall (1984) Bachall, N.A., Soneira R.M., 1984 ApJ, 277, 27
- Bell et al. (2003) Bell, E., McIntosh, D.H., Katz, N., & Weinber, M.D., 2003, ApJS, 149, 289
- Chilingarian et al. (2010) Chilingarian, I. V., Melchior, A.-L., & Zolotukhin, I. Yu. 2010, MNRAS, 405, 1409
- Chon et al. (2013) Chon, G., Boehringer, H., Nowak, N., 2013 2013, MNRAS, 429, 3272
- Durret et al. (2011) Durret, F., Adami, C., Cappi, A., Maurogordato, S., et al., 2011, A&A, 535, A65
- Einasto et al. (2011) Einasto, M., Liivamaegi, L. J., Tago, E., et al., 2011, A&A, 532, A5
- Gal et al. (2004) Gal, R.R., Lubin, L.M., 2004 ApJ 607, L1
- Geach et al. (2011) Geach, J.E., Ellis, R.S, Smail, I., Rawle, D., Moran, S., 2011, MNRAS, 413, 177
- Kalberla et al. (2005) Kalberla P. M. W., Burton W. B., Hartmann D., Arnal E. M., Bajaja E., Morras R., Pöppel W. G. L., 2005, A&A, 440, 775
- Kartaltepe et al. (2008) Kartaltepe, J.S., Ebeling, H., Ma, C.J., Donovan, D., 2008, MNRAS, 389, 1240
- Lubin et al. (2009) Lubin, L.M., Gal, R.R., Lemaux, B.C., Kocevski, D.D., Squires G.K., 2009 2009, AJ, 137, 4867
- Pacaud et al. (2006) Pacaud, F., Pierre, M., et al., 2006 MNRAS, 372, 578
- Pierre et al. (2011) Pierre, M., Pacaud, F., et al.., 2011, MNRAS, 414, 1732
- Piffaretti et al. (2011) Piffaretti, R., et.al., 2011, A&A, 534, A109
- Schirmer et al. (2011) Schirmer, M., Hildebrandt, H., Kuijken, K., Erben, T., 2011 A&A, 532, 57
- Schlegel et al. (1998) Schlegel, D.J., Finkbeiner, D.P., Davis, M., 1998 ApJ, 500, 525
- Smith et al. (2001) Smith R. K., Brickhouse N. S., Liedahl D. A., Raymond J. C., 2001, ApJ, 556, L91
- Tanaka et al. (2007) Tanaka, M, Hoshi, T., Kodama, T., Kashikawa, N., 2008 MNRAS, 379, 1546
- Verdugo et al. (2012) Verdugo, M., Lerchster, M, Boehringer, H., Hildebrandt, H., Ziegler, B.L., Erben, T., Finoguenov, A., Chon, G., 2012, MNRAS, 421, 1949
- Willis et al. (2005) Willis, J. P. et al., 2005 MNRAS, 363, 675
- Pierre et al. (2016) Pierre, M., et.al., The XXL survey: general presentation, the XMM observations and follow-up programme, 2016, A&A, accepted (XXL Survey, I)
-
Pacaud et al. (2016)
Pacaud, F., et al.
The 100 brightest XXL clusters: Catalogue (RA, Dec, Lx, Tx, z), selection function, preliminary cosmological applications. 2016, A&A, submitted (XXL Survey, II) -
Giles et al. (2016)
Giles, P., et al.,
Luminosity-Temperature Relation of the Bright Cluster Sample 2016, A&A, submitted (XXL Survey, III) - Lieu et al. (2016) XXL Paper IV, Lieu, M., et al., Mass-temperature relation of the bright cluster sample 2016, A&A, accepted (XXL Survey, IV)
-
Baran et al. (2016)
Baran, N., et.al.
3 GHz VLA radio observations towards a supercluster at z = 0.43,
2016, A&A, submitted (XXL Survey, IX) -
Koulouridis et al. (2016)
Koulouridis, E., et al.,
Optical spectroscopy of X-ray-selected clusters and evidence of AGN suppression in superclusters 2016, A&A submitted (XXL Survey, XII) -
Eckert et al. (2016)
Eckert, D., et.al.
The baryon content of the bright cluster sample 2016, A&A submitted (XXL Survey, XIII)