A proposal project for a blind image quality assessment by learning distortions from the full reference image quality assessments
Abstract
This short paper presents a perspective plan to build a null reference image quality assessment. Its main goal is to deliver both the objective score and the distortion map for a given distorted image without the knowledge of its reference image.
Index Terms— image quality, quality of service.
1 Introduction
The Holy Grail of image quality assessment (IQA) is to be blind, i.e., to provide an IQA with null reference (NR-IQA). At first, there was full reference image quality assessments (FR-IQA) whose inputs are the original and distorted images. This was soon followed by the reduced reference version (RR-IQA) which proposed to reduce as much as possible the original data needed to assess the distorted image. Nowadays, these first assessment algorithms are mature although improvements can still be obtained, especially in RR-IQA. This first category of assessments with complete or reduced reference is of two parts : the processes delivering an objective score (O-Score) and those delivering both a O-Score and a distortion map. Among the former we can quote [1] and [2] as being in the top ten. From the latter we can quote the well-known SSIM [3, 4]. The fact that an assessment process can or cannot deliver a distortion map is of importance; the paper written by C T. Vu et al. [5] illustrates this for the special case of sharpness perception. In other words, the fact that the global O-Score of a distorted image is strongly correlated to the subjective score of this image does not provide the localizations of the distortions.
Thus, the current project of FR- and NR-IQA concentrates on algorithms delivering both an objective score and a distortion map. The FR-IQA was already presented in [6] and is briefly described in section 4. But any FR-IQA, e.g. SSIM, can be used in place.
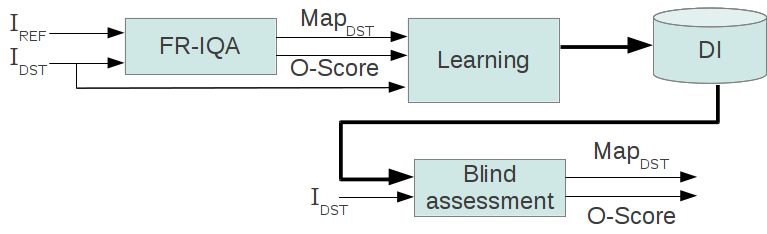
This short paper proposes a model of the main stages of the NR-IQA which learns to identify the distortion localizations from the results of the FR-IQA. Figure 1 shows the global diagram of our current study on blind assessments. The next section explains the desired two-stage process. Section 4 details some aspects the process should have. Section 4 explains the FR-IQA. This paper is concluded in section 5
2 Global scheme
As shown in figure 1 the learning stage is based on the FR-IQA WEQA which delivers both an O-Score and a distortion map [6, 7]. The O-Scores were statistically studied in [7]. The Spearman’s rank-order and Pearson’s correlation coefficients show good performances relative to the statistics provided by SSIM and VIF [8]. Moreover the distortion map of WEQA is at least as precise as the one delivered by SSIM [3].
With the help of the distortion maps delivered by of WEQA, a distortion database such as LIVE [9] or TID2008 [10] can be learned. As the learning phase is pixel-based, two questions arise :
-
•
Which pixels to learn and how to characterize them ?
-
•
How to classify these pixels and what do the clusters mean ?
3 Two-stage process
At the learning phase, WEQA estimates a distortion map for each distorted image providing its reference image. From each distorted image and its distortion map, each pixel is assigned a vector descriptor and a level of distortion which allow the learning process to cluster the pixels. Using WEQA, the characterization can be the wave-vectors and color-vectors. We can hypothesize that the neighbourhood of each pixel should be involved in the clustering. Currently, we are studying the codebook to be generated from these wave- and color-vectors. We specially focus on information that the distortion maps provide.
The content-based image retrieval (CBIR) community proposes several effective algorithms for indexing and retrieving image in large image databases. The well-known SIFT [11] uses an optimized kd-tree to index the scale-invariant keypoints. But, F. Moosmann et al. have shown in [12] that indexing structures like kd-tree are not efficient with huge image databases. Following the study of Geurts et al. on extremely randomized trees[13], they proposed a learning scheme based on support vector machine (SVM). J. Shotton et al. [14] extended the principle to semantic texton forests such that even the characterization of pixels was randomized.
The current project of NR-IQA is inspired by these studies. All the pixels of the distorted images can be learned through randomized forests. The forests would provide the kernels of the SVMs to use during the blind phase.
4 The full refrence image quality assessment
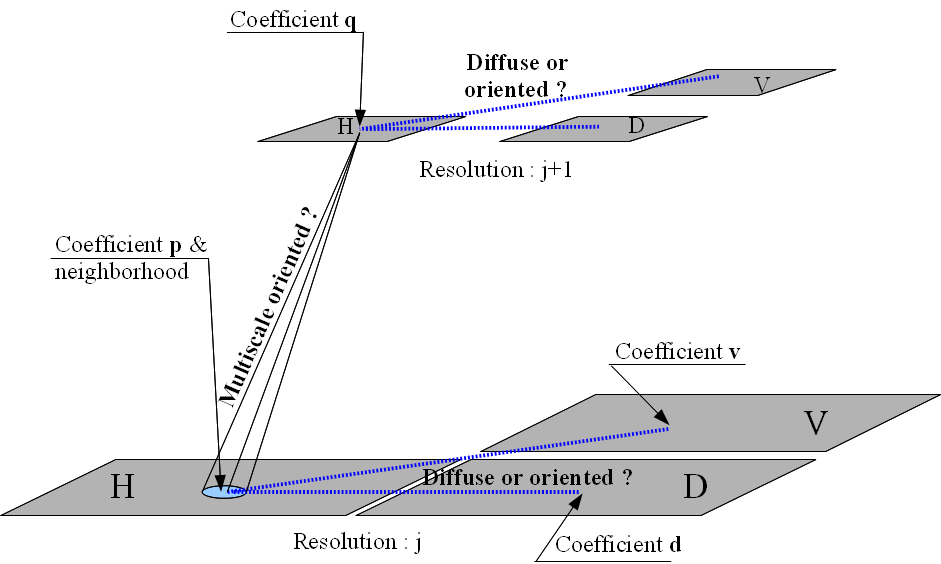
The full reference image quality assessment algorithm is wavelet domain and based on the generalized Euclidean distance. A wavelet analysis is performed on the reference and distorted images separately. This multiscale representation of the images provides an oriented description at each pixel : the quantity of pixels sharing a coefficient grows with the level of resolution of the coefficient. By this fact, each pixel iwhich embeds orientation information (see Fig. 2). To estimate the level of distortion of each pixel, we used the anisotropic image Euclidean distance [15] : ; with , and where and are the wave-vectors of the reference and distorted images respectively. If and are of equal magnitude, , the distance looks for similar coefficients. If it is, the two wave-vectors are perceived closer than if they do not share any coefficient. In other words, this distance brings closer the pixels with similar orientations and/or similar activities in their neighbourhood. For more details on the FR-IQA and its performances see [6, 7].
5 Perspective plan
Nowadays, no results are available. The current work focuses on the pixel selection and the different characterizations of these pixels based on their wave- and color-vectors. We search for a modelling of these descriptors in the context of the extremely randomized trees.
The model as presented here is available for one kind of distortion. If it gives significant results, we shall extend the distribution modelling of the learning process to bring together different kinds of distortions.
We hope our conjectures will be validated at least partly, i.e., when treating each kind of distortion independently. The biggest challenge will be to deal with all the kinds of distortion together. More information can be find at https://sites.google.com/site/imagequalityassessment/
References
- [1] G. Zhai, X. Wu, X. Yang, W. Lin, and W. Zhang, “A psychovisual quality metric in free-energy principle,” IEEE Transaction on Image Processing, vol. 21, no. 1, pp. 41–52, January 2012.
- [2] Z. Wang and A. C. Bovik, “Reduced- and no-reference image quality assessment,” IEEE Signal Processing Magazine, vol. 28, no. 6, pp. 29–40, November 2011, Special Issue on Multimedia Quality Assessment.
- [3] Z. Wang, A. C. Bovik, H. R. Sheikh, and E. P. Simoncelli, “Image quality assessment : From error visbility to structural similarity,” IEEE transaction on Image Processing, vol. 13, no. 4, pp. 600–612, Apr. 2004.
- [4] Z. Wang and Q. Li, “Information content weighting for perceptual image quality assessment,” IEEE Transaction on Image Processing, vol. 20, no. 5, May 2011.
- [5] C.T. Vu, T.D. Phan, and D.M. Chandler, “S3 : A spectral and spatial measure of local perceived sharpness in natural images,” Image Processing, IEEE Transactions on, vol. 21, no. 3, pp. 934–945, march 2012.
- [6] S. Paris, “Wavelet-based euclidean distance for image quality assessment,” in Int. Symp. ELMAR, September 2010.
- [7] S. Paris, “Étude expérimentale d’une nouvelle mesure de qualité d’image fondée sur les propriétés de l’analyse en ondelettes,” in Ateliers de Traitement et Analyse de l’Information - Méthodes et Applications, 2011.
- [8] W. Lin and C. C. Jay Kuo, “Perceptual visual quality metrics: A survey,” J. Vis. Comun. Image Represent., vol. 22, pp. 297–312, May 2011.
- [9] H. R. Sheikh, Z. Wang, L. Cormack, and A. C. Bovik, “Live image quality assessment database release 2,” .
- [10] N. Ponomarenko, V. Lukin, A. Zelenski, E. Egiazarian, M. Carli, and F. Battisti, “Tid2008 - a databse for evaluation of full-reference visual quality assessment metrics,” Advances of Modern Radioelectronics, vol. 10, pp. 30–45, 2009.
- [11] D. Lowe, “Distinctive image features from scale-invariant keypoints,” International Journal of Computer Vision, vol. 60, pp. 91–110, 2004.
- [12] F. Moosmann, B. Triggs, and F. Jurie, “Fast discriminative visual codebooks using randomized clustering forests.,” in NIPS, 2006, pp. 985–992.
- [13] P. Geurts, D. Ernst, and L. Wehenkel, “Extremely randomized trees,” Machine Learning, vol. 63, no. 1, pp. 3–42, 2006.
- [14] J. Shotton, M. Johnson, and R. Cipolla, “Semantic texton forests for image categarization and segmentation,” in CVPR, 2008.
- [15] Wang L., Zhang Y., and Feng J., “On the euclidean distance of images,” IEEE Transaction on Pattern Analysis and Machine Intelligence, vol. 27, no. 8, pp. 1334–1339, August 2005.