The -model of Bose-Einstein Correlations:
Some recent results
111Talk given at XLV International Symposium on Multiparticle Dynamics, Wildbad Kreuth, 4–9 Oct. 2015
Abstract
Bose-Einstein correlations of pairs of identical charged pions produced in hadronic Z decays and in 7 pp minimum bias interactions are investigated within the framework of the -model.
1 Introduction
After a brief review of relevant previous results, new preliminary results are presented on the dependence of the Bose-Einstein correlation function on track and jet multiplicity, pair transverse momentum and pair rapidity, using a parametrization which has been found [1] to describe well Bose-Einstein correlations in hadronic decay, namely that of the -model [2, 3].
1.1 ‘Classic’ Parametrizations
The Bose-Einstein correlation function, , is often parametrized as
| (1) |
and is measured by , where is the density of identical boson pairs with invariant four-momentum difference and is the similar density in an artificially constructed reference sample, which should differ from the data only in that it does not contain the effects of Bose symmetrization of identical bosons.
1.2 -model
However, the “classic” parametrization of Eq. (1) is found to be inadequate, even when it is generalized to allow for a Lévy distribution of the source:
| (2) |
This was not realized for a long time because the correlation function was only plotted up to or less. In Ref. 1 was plotted to 4 , and it became apparent that there is a region of anti-correlation () extending from about to . This anti-correlation, which one might term Bose-Einstein Anti-Correlations (BEAC), as well as the Bose-Einstein correlations (BEC) are well described by the -model.
In the -model is found to depend not only on , but also on quantities and . For two-jet events , where is the transverse mass of a particle). Parameters of the model are the parameters of the Lévy distribution which describes the proper time of particle emission: , the index of stability of the Lévy distribution; a width parameter ; and the proper time at which particle production begins.
We shall use a simplified parametrization [1] where is assumed to be zero and and are combined with to form an effective radius :
| (3a) | ||||
| (3b) | ||||
Note that the difference between the parametrizations of Eqs. (2) and 3 is the presence of the cosine term, which provides the description of the anti-correlation. The parameter describes the BEC peak, and describes the anti-correlation region. While one might have had the insight to add, ad hoc, a term to Eq. (2), it is the -model which provides a physical reason for it and which predicts a relationship, Eq. (3b), between and .
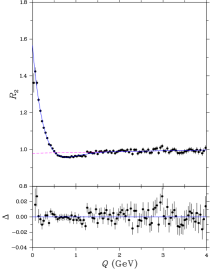
A fit of Eq. (3) to l3 two-jet events is shown in Fig. 1, from which it is seen that the -model describes both the BEC peak and the BEAC dip quite well. Also the three-jet data are well described [1], which is perhaps surprizing since the -model is inspired by a picture of fragmentation of a single string.
It must also be pointed out that the -model has its shortcomings: The -model predicts that depends on the two-particle momentum difference only through , not through components of . However, this is found not to be the case [1]. Nevertheless, regardless of the validity of the -model, Eq. (3) provides a good description of the data. Accordingly, we shall use it in most of the following.
1.3 Data
The e+e- data were collected by the l3 detector at a center-of-mass energy of . Approximately 36 million like-sign pairs of well-measured charged tracks from about 0.8 million hadronic Z decays are used. This data sample is identical to that of Ref. 1. The same event mixing technique is used to construct as in Ref. 1.
The minimum-bias pp data were collected by the atlas detector at a center-of-mass energy of . The sample contains approximately like-sign charged track pairs from approximately events. The acceptance in pseudorapidity is . This data sample is identical to the 7 sample used in the recent atlas paper on BEC [4]. However the new results reported here, which are taken from a Ph.D. thesis [5], use, unless otherwise stated, a reference sample constructed by the opposite-hemisphere (OHP) method where the three-momentum, of one of the particles of the pair is replaced by . The recent atlas paper [4] used unlike-sign pairs to construct , which is unsuitable for studying the region of anti-correlation, since in that region the meson is a dominant feature.
The Durham and jade algorithms are used to classify e+e- events according to the number of jets. The number of jets in a particular event depends on the jet resolution parameter of the algorithm, . We define () as the value of at which the number of jets in the event changes from two to three using the respective algorithms. Small corresponds to narrow two-jet events, large to events with three (or more) well-separated jets. The two algorithms lead to similar results.
2 New Preliminary Results
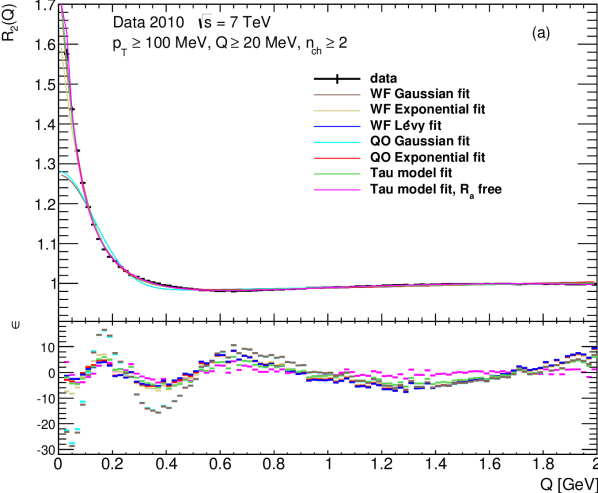
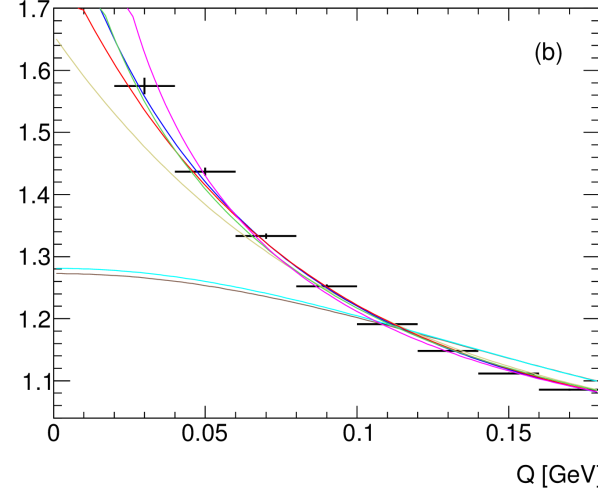
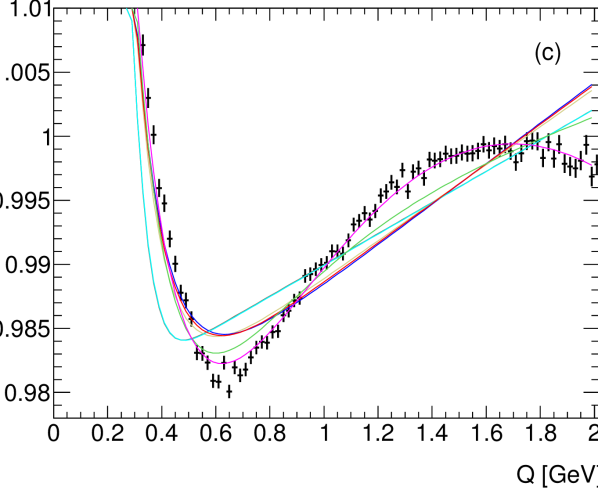
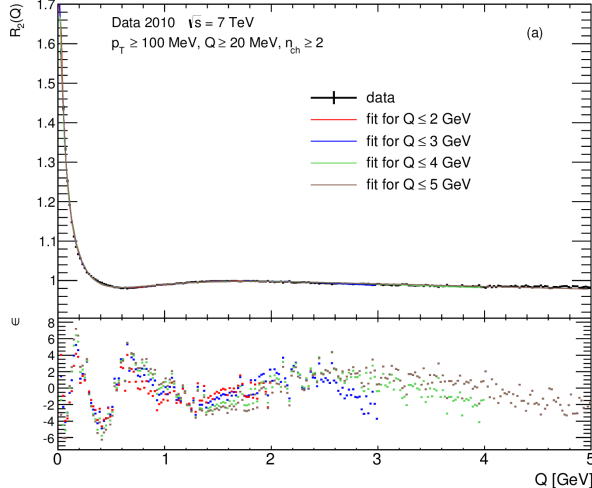
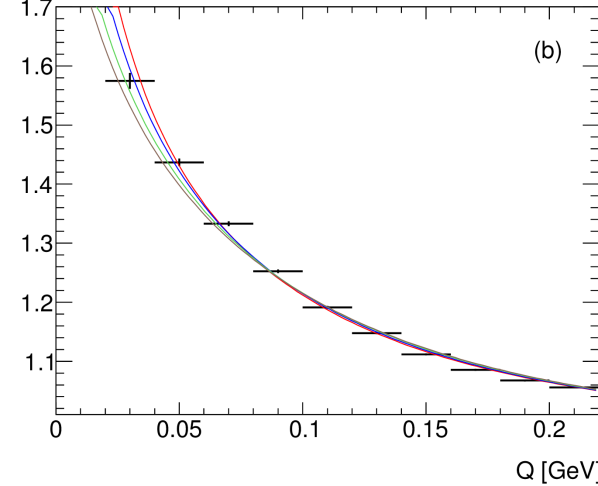
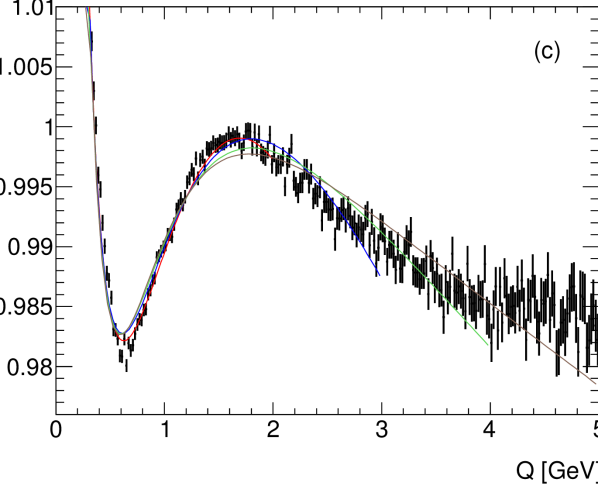
As in e+e- annihilation [1] , the pp minimum bias data are found [5] to be best described by Eq. (3a). While other parametrizations can describe the BEC peak, only this parametrization (with a free parameter) comes close to describing not only the BEC peak but also the BEAC region, as is seen in Fig. 2. Previously, cms had also observed the BEAC and fit it with the -model parametrization [6].
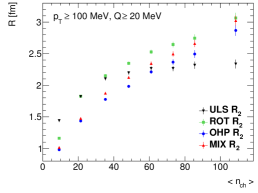
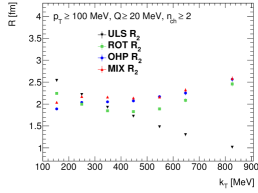
As has frequently been pointed out (see, e.g., Ref. 7) the values of the parameters of BEC depend strongly on the choice of reference sample. This is seen again in Fig. 3, where the dependence of on the charged track multiplicity, , and on the average pair transverse momentum, , is shown for the exponential parametrization of , i.e., Eq. (2) with , which is the parametrization used in the atlas paper [4]. The dependences with unlike-sign (ULS) reference sample are markedly different from those with the other samples. Whereas increases somewhat less than linearly with for the other reference samples, it appears to saturate for the ULS sample. And, whereas decreases approximately linearly with for the ULS sample, for the rotated reference sample it decreases only up to and then increases, and for the other reference samples it is first roughly constant with and then increases.
An unfortunate property of the -model parameterization is that the estimates of , , and from the fits tend to be highly correlated. Therefore, when studying the dependence of on quantities such as or , in order to stabilize the fits is fixed to the value obtained in a fit to all events. In examining the dependence of on charged track multiplicity and on , the parametrization of Eq. (3a) is used (with given by Eq. (3b) for e+e- and a free parameter for pp).
The dependence of on with respect to the thrust axis for e+e- and with respect to the beam axis for pp is shown in Fig. 4 for the -model parametrization with a free parameter is shown in Fig. 4. The behavior of two-jet e+e- seems similar to pp, although the error bars are large.
For both e+e- and pp, is found [7, 5] to increase with multiplicity (not shown). Further, for e+e- is found [7] to increase with ‘jettiness’, as measured by .
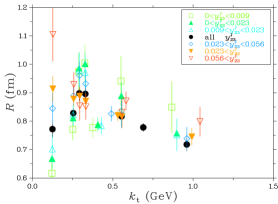
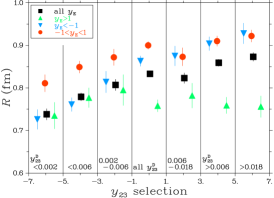
In e+e-, is also found to depend on the rapidity of the pair, as shown in Fig. 5. Here the rapidity, , is defined with respect to the thrust axis with the positive thrust axis chosen to be in the same hemisphere as the most energetic jet. Then selects almost always tracks from the most energetic quark jet, and selects mostly tracks from the other quark jet with the contribution of tracks from the gluon jet increasing as increases, i.e., as the events become more three-jetlike. The intermediate region contains tracks from the gluon jet and low-energy tracks from both quark jets. One observes that is roughly independent of for . This value of is also found for in the case of two-jet events. These are the situations of ‘pure’ quark jets. As increases for also increases, reflecting the increasing contribution of tracks from the gluon. The region has a larger value of for two-jet events, and this value increases with . For three-jet events, where the gluon contributes to both and , the values of are approximately equal.
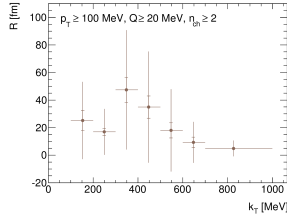
As mentioned above, the -model is known to break down. In the -model depends on , and not on components of . This was tested in Ref. 1. In Eq. (3) is replaced by and fits for two-jet events performed in the LCMS. Different values were found for , , and . Here results are shown in Fig. 6 for and for various selections of . One sees that is independent of , while increases with ‘jettiness’. Thus the increase in occurs mainly in the transverse plane. This is consistent with the increase in being due to the increasing hardness of the gluon, which was seen in the rapidity dependence above.
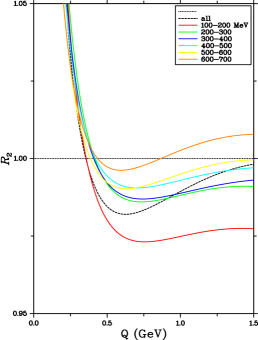
A large source of systematic uncertainty on the parameter values is the range of over which the fit is performed. A higher upper limit, , of the fit range gives more data to determine the baseline, which in turn affects the values of the parameters describing BEC and BEAC. Clearly, should be chosen well beyond the anti-correlation region. Fig. 7 and Table 1 show this effect. The values of the parameters change drastically when the upper limit, , is increased from 2 to 3 . As is further increased the change is less, but still large. It is clear that the parametrization does not fully describe the data. Nevertheless, it is much better than all the other parametrizations that were tried. It is also worth noting that the value of is quite different from the value found for two-jet e+e- events [1].


3 BEAC in more detail
In the -model BEAC arises through the correlation of coordinate space and momentum space. Recently, another explanation has been proposed, namely the non-zero size of the pion [8, 9]. A detailed investigation of the BEAC region seems therefore warranted, in the hope of distinguishing between these explanations.
Since fits of Eq. (3a), with a free parameter, provide a reasonable description of the anti-correlation region, they are used to show how BEAC depend on ‘jettiness’ in e+e- and to compare the dependence of BEAC on multiplicity and in two-jet e+e- and pp minimum bias events.
Fig. 8 shows the dependence of the BEAC on . It is seen that the anti-correlation dip becomes deeper and its minimum moves slighlty lower in as the ‘jettiness’ increases, i.e., as one moves from two- to three-jet events.
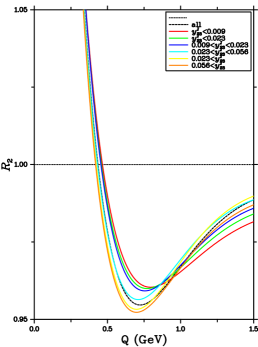
Fig. 9 shows the dependence of the BEAC on track multiplicity. The anti-correlation dip is deeper and at somewhat higher for two-jet e+e- than for pp. With increasing the minimum moves to lower ; this effect is larger in pp than in e+e-. The dip also becomes less deep as increases, an effect also noticed by cms [6].
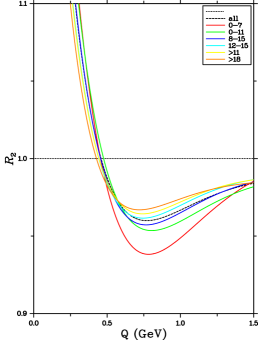
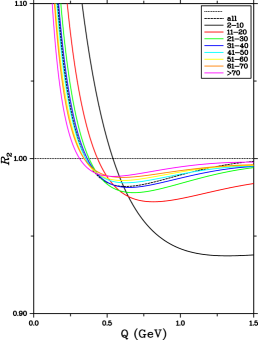
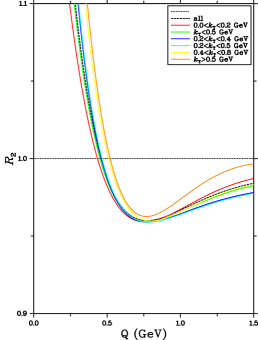
Fig. 10 shows the dependence of the BEAC on . Little dependence is seen for two-jet e+e- data. For pp minimum bias data, the depth of the dip decreases with , but the position of the minimum is approximately constant.
4 Conclusions
The -model, which is closely related to the string picture, provides a reasonable explanation of both the BEC peak and the BEAC dip in both e+e- and minimum bias pp interactions. Of all the parametrizations tried, only that of the -model survives as a candidate to explain the data. Another possible explanation is that the anti-correlation arises because of the non-zero size of the pion. To discover which of these explanations (or what combination of them) is the best explanation requires detailed investigation of both BEC and BEAC.
and are found to depend on track multiplicity and transverse momentum in both pp and e+e- and on jets and rapidity in e+e-. What more does it depend on? If the BEAC are due to the correlation between coordinate space and momentum space, as in the -model, it is reasonable that the dependence on jet structure, as seen in e+e-, occurs. Then one would also expect similar dependences in pp. This possibility makes the study of BEC (and BEAC) in jet events interesting. One might also expect a rapidity dependence in minimum bias events, as the number of strings involved or the presence of color reconnection may vary with rapidity. On the other hand, it is not clear (at least to me) why the effect of the pion size should depend on either rapidity or the presence of a jet.
In studying these correlations, the reference sample used plays a crucial role. The use of an unlike-sign reference sample is not possible in studying BEAC. Further, the upper limit of the fit range must be well above the BEAC region. It is very difficult, if not impossible, to compare quantitatively the results using different reference samples. It would therefore be useful if the lhc experiments could agree on a standard method of constructing the reference sample, and give results using this standard method as well as any other method deemed superior. This is especially important to investigate, e.g., dependence on rapidity, where the acceptances of the experiments are very different, e.g., lhcb and atlas, cms, alice.
References
- [1] L3 Collab., P. Achard et al., Eur. Phys. J. C71 (2011) 1–25, 10.1140/epjc/s10052-011-1648-8.
- [2] T. Csörgő and J. Zimányi, Nucl. Phys. A517 (1990) 588–598.
- [3] T. Csörgő, W. Kittel, W.J. Metzger and T. Novák, Phys. Lett. B663 (2008) 214–216.
- [4] ATLAS Collab., G. Aad et al., Eur. Phys. J. C75 (2015) 466.
- [5] Róbert Astaloš, Bose-Einstein correlations in 7 TeV proton-proton collisions in the ATLAS experiment, Ph.D. thesis, Radboud University, 2015, http://hdl.handle.net/2066/143448.
- [6] CMS Collab., V. Khachatryan et al., JHEP 5 (2011) 29.
- [7] Wesley J. Metzger, EPJ Web of Conferences 90 (2015) 01006.
- [8] A. Białas and K. Zalewski, Phys. Lett. B727 (2013) 182–184.
- [9] Andrzej Białas, Wojciech Florkowski and Kacper Zalewski, Phys. Lett. B748 (2015) 9–12.