[NCBJ,UZG] [NCBJ] [LO,UZG,UCT] [NCBJ,UZG,OAUJ] [OAUJ,UZG] [OAUJ,UZG] [NCBJ,UZG] NCBJ]National Centre for Nuclear Research, Otwock, Poland LO]Leiden Observatory, Universiteit Leiden, The Netherlands UZG]Janusz Gil Institute of Astronomy, University of Zielona Góra, Poland UCT]Department of Astronomy, University of Cape Town, South Africa OAUJ]Astronomical Observatory, Jagiellonian University, Kraków, Poland
Learning algorithms at the service of WISE survey
Abstract
We have undertaken a dedicated program of automatic source classification in the WISE database merged with SuperCOSMOS scans, comprehensively identifying galaxies, quasars and stars on most of the unconfused sky. We use the Support Vector Machines classifier for that purpose, trained on SDSS spectroscopic data. The classification has been applied to a photometric dataset based on all-sky WISE 3.4 and 4.6 m information cross-matched with SuperCOSMOS B and R bands, which provides a reliable sample of million sources, including galaxies at , as well as quasars and stars. The results of our classification method show very high purity and completeness (more than 96%) of the separated sources, and the resultant catalogs can be used for sophisticated analyses, such as generating all-sky photometric redshifts.
1 Introduction
Modern wide-field astronomical surveys have cataloged millions of sources, and the forthcoming ones will raise this number to billions. The number of object properties available for further analysis, such as photometry, morphology or spectral indexes, also constantly expands, which forces astronomers to work in a multi-dimensional parameter space to classify and study different types of sources. However, a crucial quantity for reliable identification of various source types – the spectroscopic redshift – is usually known only for a small fraction of the observed objects. For that reason, source classification is most often performed based on photometric properties only.
The most basic physical classification separates out foreground stars from extragalactic sources, using morphological parameters: point-like sources are identified as stars, while extended ones as galaxies (e.g. Vasconcellos et al. 2011). Morphological classification can provide very good results, nevertheless additional information is needed to separate out stars from point-like but extragalactic sources such as quasars or unresolved galaxies. The most common, and relatively simple, approach to star-galaxy separation is based on colors. Galaxies are usually much redder than stars, and using photometric information it may be possible to define separate star and galaxy loci in color-color diagrams (e.g. Pollo et al. 2010). Similar methodology can be applied to find more specific objects such as AGNs, quasars, variable stars or starburst galaxies (e.g. Woźniak et al., 2004).
Nowadays, deep surveys very often focus on detecting high-redshift objects at faint apparent magnitudes. Standard classification methods, employing morphology or colors, are then no longer reliable due to small angular sizes and low signal-to-noise levels. When dealing with huge source numbers in multi-dimensional parameter space, applying automatized source classification is a natural step for present-day and future astronomy.
Here we present an application of a machine learning algorithm to identify galaxies, stars and quasars in a newly compiled dataset, based on two presently the largest all-sky photometric catalogs: the Wide-field Infrared Survey Explorer (WISE; Wright et al., 2010) in the mid-infrared, and the SuperCOSMOS Sky Survey (SCOS; Hambly et al., 2001) in the optical. For the classification described here we used the Support Vector Machines (SVM) – a supervised learning algorithm which is a maximum-margin classifier able to determine decision planes between sets of objects in an -dimensional parameter space. This algorithm has already been successfully applied to other datasets (Solarz et al., 2012; Saglia et al., 2012; Małek et al., 2013). See also Kurcz et al. in this volume where SVM-based classification using only WISE information is discussed.
Our goal is to develop automatic object classification in the WISESCOS dataset, into three categories: galaxies, quasars, and stars. We aim at obtaining (almost) all-sky catalogs of high completeness and purity, based on photometric properties of the sources. This, together with the parallel effort of Kurcz et al. (in prep.) is the first application of the SVM algorithm to a catalog including sources preselected from the WISE database.
2 Data and sample selection
WISE is a NASA space-based mission, which surveyed the entire sky in four mid-infrared bands, centered at 3.4, 4.6, 12 and 23 m ( – respectively). For our analysis we have used the AllWISE dataset111Available for download from http://irsa.ipac.caltech.edu/frontpage/., which combines data from cryogenic and post-cryogenic survey phases. It includes million sources with S/N 5 in at least one band, and its averaged 95% completeness in unconfused areas is , , and in Vega magnitudes.
Our WISE preselection required: (1) S/N ratios larger than 2 in the and bands (the two other channels being too shallow for our purposes); (2) removal of obvious artifacts (cc_flags[1,2] = DPHO), (3) rejection of the Galactic Plane () to avoid confusion; and (4) mag threshold for all-sky uniformity. Such a sample selection gives 343 million WISE sources.
The SuperCOSMOS Sky Survey contains digitized photographs in three optical bands (), obtained via automated scanning of source plates from the UKST (in the South) and POSS-II (North) observations. SCOS measurements of were calibrated using SDSS photometry in the relevant areas, and 2MASS J band over the rest of the sky (Peacock et al., in prep.). The publicly available catalog222Available for download from http://surveys.roe.ac.uk/ssa/. contains 1.9 billion of sources, with information about photometry, morphology and quality of measurements. For our purposes we selected sources with a detection in both and bands (discarding the shallower plates). Unlike in Bilicki et al. (2014) and Bilicki et al. (2015), we use here both extended and point sources from the SCOS database. To maintain uniformity, SCOS objects were selected to limits of and in a pseudo-AB system (Peacock et al., in prep.). As in WISE, we have also removed SCOS sources from the Galactic Plane (), where blending and high Galactic extinction make the SCOS photometry unreliable.
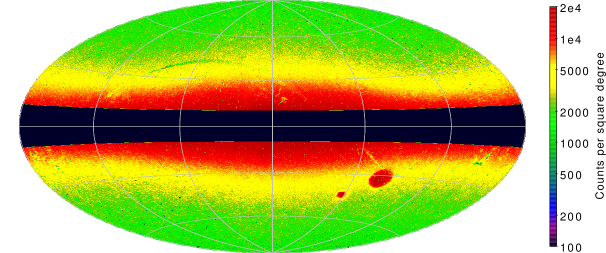
The two photometric catalogs were paired up using a matching radius of . The resulting flux-limited WISESCOS sample at contains almost 170 million sources, and is illustrated in Fig. 1. For a more comprehensive description of the catalogs used to construct the main photometric dataset (WISE and SCOS), see Bilicki et al. (2014, 2015), and Bilicki et al. in this volume.
3 Method: Support Vector Machines
The main concept of Support Vector Machines (SVM) is to calculate decision planes between a set of objects having different class memberships, the planes being defined by quantities that describe the properties of each class provided in a training sample. SVM searches for the optimal separating hyperplane between the different object classes by maximizing the margin between the classes’ closest points, and the objects are classified based on their position relative to the separation boundary in the -dimensional parameter space. In our analysis, to search for the hyperplane we use a Gaussian kernel function, and a soft-boundary SVM method called C-SVM, which employs two parameters: , giving a trade-off between large margins of different object classes, and , that determines the topology of the decision surface. Both parameters need to be tuned based on the training sample. We employed LIBSVM, integrated software for support vector classification, implemented in the R software environment333http://www.csie.ntu.edu.tw/cjlin/~libsvm and http://www.r-project.org for statistical computing.
3.1 Training sample
The successful application of SVM depends on a well-chosen training sample. As the algorithm searches for patterns between different object classes, the method heavily relies on a well-defined, representative sample of sources with already known properties. To train the classifier for the WISESCOS catalog, we decided to use information from the spectroscopic sample of the Sloan Digital Sky Survey (SDSS DR12, Alam et al., 2015), cross-matched with our photometric data. Pairing up WISESCOS with SDSS DR12 sources within 1” we obtained a training sample of over 1.3 million common objects. Due to the SDSS spectroscopic preselection, such a training sample suffers from the lack of galaxies at the faint end of our catalog (); we have thus used the oversampling technique to improve the final selection. For more detailed description of the oversampling procedure we refer the reader to Małek et al. (2013).
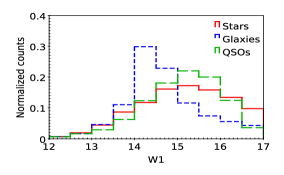
Our full training set was composed of 25,000 galaxies, 25,000 quasars, and 25,000 stars, selected as described below. Fig. 2 (upper left panel) shows the number counts of the final training sample as a function of . From the remaining objects from the WISESCOSSDSS catalog randomly selected (without repetition) 75,000 objects (galaxies, quasars and stars) were used for independent tests of classifier performance.
3.2 SVM training details
To separate more efficiently different groups of objects and improve the classification process, we have divided the training sample into five apparent magnitude bins: , , , and . This allowed us to define the best classifiers as a function of , and fully exploit even small differences between galaxies, stars, and quasars in 5 different magnitude bins. Therefore, our final SVM classifier is a combination of 5 different ones, and depending on the object’s magnitude, a suitable classifier is used.
For the SVM parameter space we chose five quantities: magnitude, - -, and - colors and a differential aperture magnitude (the latter helping separate point-like from resolved sources). Each classifier was tuned to find the best and parameters, based on 5,000 galaxies, 5,000 quasars, and 5,000 stars selected randomly from the WISESCOSSDSS catalog in the appropriate range.
4 Results
To quantify the efficiency of the WISESCOS classifier we counted true objects (TG: true galaxies; TQ: true quasars; TS: true stars) from the training sample, classified properly by SVM, as well as false sources (FG: false galaxies, being in fact quasars or stars, misclassified as galaxies; etc. for FQ and FS), and calculated the total accuracy of our classifier from the formula:
| (1) |
where =10 is the number of cross-validation iterations performed for all five classifiers independently.
We checked how the accuracy of the classifiers depends on the magnitude, as well as on the Galactic latitude (Fig. 2, upper central and right panels). We have found that in general the accuracies retain very high levels, of the order of 95%, but there is significant deterioration in the efficiency for faint galaxies. The accuracy for galaxies with mag is still at a very good level, more than 80%, but the decline of the classifier’s performance is visible. This is related to the fact that beyond mag, the training set contains very few galaxies, and the oversampling procedure was not sufficient to compensate for this imbalance (Fig. 2, left panel). In most cases of incorrect classification, the true galaxies are misclassified as stars, and vice versa.
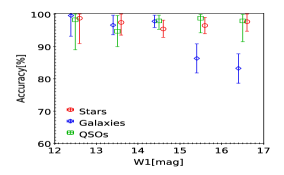
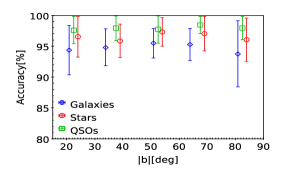
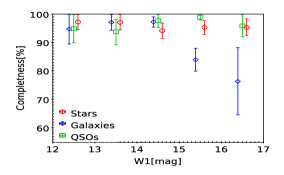

To check the classifier’s reliability for different ranges of the Galactic latitude, we calculated the accuracy in six -wide bins in . For the latitude the accuracy is always higher than 90% for all the 3 classes. This shows that outside of the Galactic Plane our classifier does not depend on the latitude, and can be reliably used there. We have also examined the purity and completeness of the training sample (see Soumagnac et al. 2015 for relevant definitions), which are illustrated in the bottom panels of Fig. 2, and found generally very high levels of the two statistics, . The exception are galaxies fainter than mag, for which both completeness and purity decrease respectively to and . This is again related to the lack of such sources in the training sample, which cannot be fully compensated for by the oversampling procedure.
4.1 Final classification
Having examined in detail the properties of our classifier, we applied it to the full WISESCOS dataset preselected as described above. The final catalogs required some cleaning, such as removal of high-extinction regions ( mag), and of the areas by the Galactic Plane and Bulge where blends dominate (cf. Fig. 1). In addition, to maintain reliability, we took advantage of classification probabilities provided by SVM. We required the probability of each given class to be greater than 0.5, i.e. for galaxies and similarly for stars and quasars.
The above criteria resulted in over 24 million galaxy and 3.4 million quasar candidates identified in the almost full-sky WISESCOS sample, the remaining sources being either star candidates, or unclassified (the latter when for each type, its probability was ).
We conclude that applying the SVM algorithm to WISE data cross-matched with SCOS, using additional source type information from the SDSS spectroscopic survey as a training set, can deliver uniform and reliable all-sky catalogs of galaxies, quasars and stars. One should however keep in mind that at present, the SCOS data do not provide photometry for point and extended sources calibrated in the same way. For that reason, in the forthcoming paper (Krakowski et al., 2016) we will focus on identifying galaxies using only the resolved SCOS sources cross-matched with WISE, as in Bilicki et al. (2015). In Krakowski et al. (2016) we also provide more details of this work, such as various tests of the classifier, as well as the final catalog of WISESCOS galaxy candidates identified in an automatized way.
Acknowledgements.
This work was supported by the Polish National Science Center under contracts # UMO-2012/07/D/ST9/02785 (KM, MB, AP, MK, AK & AS), UMO-2013/09/D/ ST9/04030 (KM & TK) and UMO-2015/16/S/ST9/00438 (AS). AP was partially supported by the Polish-Swiss Astro Project, co-financed by a grant from Switzerland, through the Swiss Contribution to the enlarged European Union. Special thanks to Mark Taylor for the TOPCAT and STILTS software.References
- Alam et al. (2015) Alam, S., et al., The Eleventh and Twelfth Data Releases of the Sloan Digital Sky Survey: Final Data from SDSS-III, ApJS 219, 12 (2015), 1501.00963
- Bilicki et al. (2014) Bilicki, M., et al., Two Micron All Sky Survey Photometric Redshift Catalog: A Comprehensive Three-dimensional Census of the Whole Sky, ApJS 210, 9 (2014), 1311.5246
- Bilicki et al. (2015) Bilicki, M., et al., WISESuperCOSMOS photometric redshift catalog of 20 million galaxies over 3 steradians of the sky, in prep. (2015)
- Hambly et al. (2001) Hambly, N. C., et al., The SuperCOSMOS Sky Survey - I. Introduction and description, MNRAS 326, 1279 (2001), %****␣KMalek_pap.bbl␣Line␣25␣****arXiv:astro-ph/0108286
- Krakowski et al. (2016) Krakowski, T., et al., Machine-learning identification of galaxies in the WISE SuperCOSMOS all-sky catalogue, in prep. (2016)
- Kurcz et al. (in prep.) Kurcz, A., et al., Towards a comprehensive classification of WISE sources (in prep.)
- Małek et al. (2013) Małek, K., et al., The VIMOS Public Extragalactic Redshift Survey (VIPERS). A support vector machine classification of galaxies, stars, and AGNs, A&A 557, A16 (2013), 1303.2621
- Pollo et al. (2010) Pollo, A., Rybka, P., Takeuchi, T. T., Star-galaxy separation by far-infrared color-color diagrams for the AKARI FIS all-sky survey (bright source catalog version -1), A&A 514, A3 (2010), 1003.1949
- Saglia et al. (2012) Saglia, R. P., et al., The Photometric Classification Server for Pan-STARRS1, ApJ 746, 128 (2012), 1109.5080
- Solarz et al. (2012) Solarz, A., et al., Star-galaxy separation in the AKARI NEP deep field, A&A 541, A50 (2012), 1203.1931
- Soumagnac et al. (2015) Soumagnac, M. T., et al., Star/galaxy separation at faint magnitudes: application to a simulated Dark Energy Survey, MNRAS 450, 666 (2015)
- Vasconcellos et al. (2011) Vasconcellos, E. C., et al., Decision Tree Classifiers for Star/Galaxy Separation, AJ 141, 189 (2011), 1011.1951
- Woźniak et al. (2004) Woźniak, P. R., Williams, S. J., Vestrand, W. T., Gupta, V., Identifying Red Variables in the Northern Sky Variability Survey, AJ 128, 2965 (2004)
- Wright et al. (2010) Wright, E. L., et al., The Wide-field Infrared Survey Explorer (WISE): Mission Description and Initial On-orbit Performance, AJ 140, 1868 (2010), 1008.0031