Multi-Object Spectroscopy with MUSE
Abstract
Since 2014, MUSE, the Multi-Unit Spectroscopic Explorer, is in operation at the ESO-VLT. It combines a superb spatial sampling with a large wavelength coverage. By design, MUSE is an integral-field instrument, but its field-of-view and large multiplex make it a powerful tool for multi-object spectroscopy too. Every data-cube consists of 90,000 image-sliced spectra and 3700 monochromatic images. In autumn 2014, the observing programs with MUSE have commenced, with targets ranging from distant galaxies to local stellar populations, star formation regions and globular clusters.
This paper provides a brief summary of the key features of the MUSE instrument and its complex data reduction software. Some selected examples are given, how multi-object spectroscopy for hundreds of continuum and emission-line objects can be obtained in wide, deep and crowded fields with MUSE, without the classical need for any target pre-selection.
1 The MUSE instrument in brief
The Multi Unit Spectroscopic Explorer (MUSE) (Bacon et al. 2014) is a 3D-Spectrograph at the Very Large Telescope (VLT) of the European Southern Observatory (ESO). It combines a 1 square arcminute field-of-view with a seeing-limited spatial sampling, resulting in 90,000 spectra per exposure. After 10 years of development, assembly, and testing, MUSE was commissioned at the Paranal Observatory in 2014. Meanwhile the science verification and the initial observing runs have yielded excellent results, demonstrating the power of this new facility for the European astronomical community.
Currently, MUSE is in operation in the seeing-limited, wide-field-mode (WFM). In the future, ESO will upgrade the UT4 with the VLT Adaptive Optics Facility (AOF). Together with the GALACSI-AO system, this will yield an improved spatial resolution, even higher sensitivity and enable the AO-assisted narrow-field-mode (NFM) for MUSE. Table 1 summarizes the top instrumental parameters and observing modes.
| Parameter | Value |
|---|---|
| Number of IFU modules: | 24 (image slicer + spectrograph + CCD) |
| Wavelength coverage: | 480-930 nm (nominal range) |
| 465-930 nm (extended range) | |
| Throughput WFM: | 14% (at 480 nm), 35% (at 750 nm), 14% (at 930 nm) |
| Field of View: | 59" 60" (in WFM) and 7".5 7".5 (in NFM) |
| Spatial sampling: | 0".2 (in WFM) and 0".025 (in NFM) |
| Multiplex factors: | 1152 slices, 90,000 spaxels, 3700 wavelength bins |
The MUSE data reduction software (Weilbacher et al. 2014) converts and calibrates the raw data from the 24 CCDs into a combined data-cube (with two spatial and one wavelength axis) and corrects for instrumental and atmospheric effects. Apart from standard procedures such as bias subtraction, cosmics removal, spectra extraction, etc, it reconstructs the image at the focal plane from the 1152 slices. A special geometrical calibration was performed to measure the edges of each projected image slicer in the field. The software also features methods for sky subtraction and flux calibration of the data. In addition to each data cube, a variance cube is being generated. The pipeline was operational at the time of MUSE first light and was a crucial contribution for the successful commissioning. The latest release of the pipeline to be used with the EsoRex program can be downloaded from the ESO site (www.eso.org/sci/software/pipelines/muse/muse-pipe-recipes.html).
2 The multiplex advantage
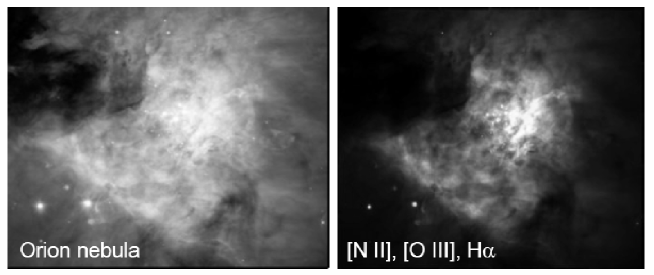
Contrary to multi-slit or multi-fiber spectrographs, MUSE uses the entire FoV to obtain spectra for each spaxel. To demonstrate the multiplex power of MUSE, to verify its performance, and to stress-test the data reduction pipeline, a mosaic of 30 pointings was obtained in the center of the Orion nebula (see Fig. 1). The resulting data-cube allowed the detection and spectral analysis of point-like and extended sources, as well as the creation of flux, line ratio and velocity maps of the entire region (Weilbacher et al. 2015).
2.1 MUSE in deep fields
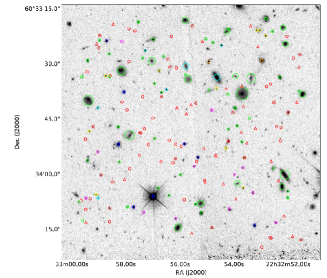
A core science case in the development of MUSE has been the observation of high red-shifted galaxies in the early universe to study galaxy formation. During the final commissioning run, the consortium observed the Hubble Deep Field South (HDFS) for 27 hours integration time (Bacon et al. 2015) resulting in an unprecedented depth. The redshifts of 189 sources were measured, increasing by more than an order of magnitude the number of known spectroscopic redshifts in this field. In addition, 26 Ly- emitting galaxies were discovered, which are not detected in the HST WFPC2 broad band images (see Fig. 2 left).
The entire data set, including the data cube, associated variance cube, and the source catalog with redshifts, spectra and emission line fluxes, was released to the community to allow for follow-up studies (http://muse-vlt.eu/science/).
2.2 MUSE in wide fields
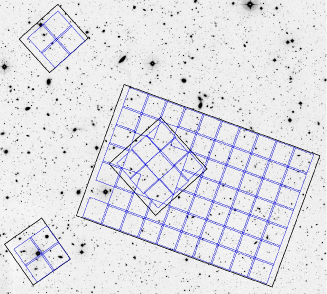
In a complementary program to the deep-fields, MUSE is used for a wider, but shallower survey over 100 arcmin2 to perform a census of bright Ly emitters (Wisotzki et al. in prep.). This MUSE-Wide Survey currently focuses on the CANDELS-DEEP field in the CDFS area, surrounding the Hubble Ultra Deep Field (see Fig. 2 right). This comprises the most studied area in the sky with excellent multi-wavelength coverage, such as deep HST optical (GOODS-South), Chandra, Spitzer, Herschel and ALMA observations. While other MOS surveys, such as VANDELS and the VVDS-Deep and deep 3D-HST grism data, have focused on identifying the galaxy population, MUSE’s capabilities lie in the serendipitous detection of emission line sources, whose continuum is too faint to be targeted for follow-up with classical MOS surveys. The MUSE-wide survey observes these fields with 1 hour exposure time each, yielding objects down to 24th magnitude in H.
2.3 MUSE in crowded fields
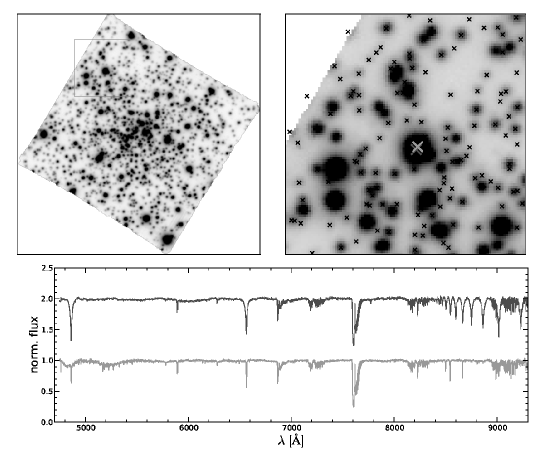
In heavily crowded fields, slit- or fiber-based spectroscopy suffers from the blending of sources and the difficulty to fully record the 2-dimensional area around an object and therefore to disentangle the overlapping light. Combining 3D-spectroscopy with high-resolution imaging data, a technique was developed (Kamann et al. 2013) to optimize the deblending and extraction of spectra in very crowded fields by applying point spread function fitting techniques to data-cubes. A MUSE observing program targets globular clusters (Fig. 3) to obtain the largest spectroscopic samples in these objects to date (Husser et al. 2015). This data enables a range of applications, ranging from stellar parameter studies to the search for intermediate-black holes in the cluster centers.
Acknowledgments
MUSE is built by a European-wide consortium of six institutes and ESO, led by CRAL. AIP and IAG gratefully acknowledge support by the BMBF-Verbundforschung (grant no. 05A14BAC and 05A14MGA).
References
- Bacon et al. (2014) Bacon, R., Vernet, J., Borisova, E., et al. 2014, The Messenger, 157, 13
- Bacon et al. (2015) Bacon, R. et al. 2015, A&A 575, id. A75
- Husser et al. (2015) Husser, T.-O., Kamann, S., Dreizler, S. et al. 2015, A&A, to be submitted
- Kamann et al. (2014) Kamann S. et al. 2014, A&A 566, id. A58, 24
- Kamann et al. (2013) Kamann, S., Wisotzki, L., Roth, M. M. 2013, A&A 549, A71
- Weilbacher et al. (2014) Weilbacher, P. M., Streicher, O., Urrutia, T. et al. 2014, ASPC 485, 451
- Weilbacher et al. (2015) Weilbacher, P. M. Monreal-Ibero, A. Kollatschny, W. et al. 2015, A&A 582, id. A114