Notice: This manuscript has been authored by UT-Battelle, LLC under Contract No. DE-AC05- 00OR22725 with the U.S. Department of Energy. The United States Government retains and the publisher, by accepting the article for publication, acknowledges that the United States Government retains a non-exclusive, paid-up, irrevocable, world-wide license to publish or reproduce the published form of this manuscript, or allow others to do so, for United States Government purposes. The Department of Energy will provide public access to these results of federally sponsored research in accordance with the DOE Public Access Plan (http://energy.gov/downloads/doe-public-access-plan).
Electron-phonon coupling and thermal transport in the thermoelectric compound
Abstract
Phonon properties of (), a potential high-temperature thermoelectric material, have been studied with inelastic neutron and x-ray scattering, and with first-principles simulations. The substitution of Te for Sb leads to pronounced changes in the electronic structure, local bonding, phonon density of states (DOS), dispersions, and phonon lifetimes. Alloying with tellurium shifts the Fermi level upward, near the top of the valence band, resulting in a strong suppression of electron-phonon screening, and a large overall stiffening of interatomic force-constants. The suppression in electron-phonon coupling concomitantly increases group velocities and suppresses phonon scattering rates, surpassing the effects of alloy-disorder scattering, and resulting in a surprising increased lattice thermal conductivity in the alloy. We also identify that the local bonding environment changes non-uniformly around different atoms, leading to variable perturbation strengths for different optical phonon branches. The respective roles of changes in phonon group velocities and phonon lifetimes on the lattice thermal conductivity are quantified. Our results highlight the importance of the electron-phonon coupling on phonon mean-free-paths in this compound, and also estimates the contributions from boundary scattering, umklapp scattering, and point-defect scattering.
pacs:
63.20.D-, 63.20.kd, 66.30.XjI Introduction
Thermoelectric materials convert temperature gradients into electrical potentials, and are of widespread interest for their applications in solid-state power generation or refrigeration Snyder and Toberer (2008); Minnich et al. (2009); Biswas et al. (2012); Keppens et al. (1998); Delaire et al. (2011a); Nielsen et al. (2013). Good thermoelectric conversion efficiency is dependent on achieving large values of Seebeck coefficient, , high electrical conductivity, , and at the same time a low thermal conductivity, . The total thermal conductivity is the sum of an electrical contribution from charge carriers, , and a lattice component due to phonon propagation. In order to maximize the thermoelectric figure-of-merit, , much effort is focused toward suppressing phonon propagation to minimize Snyder and Toberer (2008); Poudel et al. (2008); Minnich et al. (2009); Biswas et al. (2012); Keppens et al. (1998); Koza et al. (2008); Christensen et al. (2008); Ma et al. (2013); Voneshen et al. (2013); Rhyee et al. (2009).
is an over-doped -type metallic compound and in order to improve its thermoelectric performance, one needs to dope extra electrons to reduce its carrier concentration Shi et al. (2011); Parker et al. (2011). Adding electrons shifts the Fermi level toward the top of the valence band and increases the power factor (defined by product of square of Seebeck coefficient and electrical conductivity, ). Prior studies investigating electrical transport in show a definite increase in power factor up to x = 1.8 Shi et al. (2011); Parker et al. (2011); Xu et al. (2009); Candolfi et al. (2009a, b, c, 2010). Such alloying would normally be expected to reduce through impurity scattering Klemens (1958); Tritt (2004). However, the introduction of Te in leads instead to a surprising increase in Shi et al. (2011); Candolfi et al. (2009a, b, 2010). This effect was attributed to a suppression in electron-phonon coupling as the hole concentration is reduced with Te doping Candolfi et al. (2011); Shi et al. (2011).
has also attracted strong interest because of its unusual magnetic and superconducting properties Bukowski et al. (2002); Koyama et al. (2008, 2009); Tran et al. (2008); Yan et al. (2013); Candolfi et al. (2007); Wiendlocha et al. (2008); Okabe et al. (2009); Wiendlocha and Sternik (2014). undergoes a magnetic and structural phase transition at K, from a high-temperature cubic phase () to a low-temperature tetragonal phase (), corresponding to a contraction of Mo-Mo nearest-neighbor bonds along the axis, and the formation of singlet dimers. However, the distortion from the cubic structure is slight, with the ratio reaching 1.002 at 11 K according to single-crystal x-ray diffraction Yan et al. (2015). Doping with Te strongly suppresses the structural phase transition temperature, and no phase transition is observed for Te concentrations exceeding 0.36% Yan et al. (2015).
Prior inelastic neutron scattering (INS) investigations at low temperature () have revealed a possible deviation from the quasi-harmonic (QH) approximation in the case of , as opposed to a normal QH behavior in Candolfi et al. (2011). However, that study was limited to powder measurements of the phonon DOS at few temperatures. While Shi et al. Shi et al. (2011) investigated the thermal transport properties at high temperatures using transport and calorimetry measurements, momentum-resolved spectroscopic information about the phonon dispersions is still lacking. Here, we provide a detailed analysis of the effect of electron-phonon coupling by combining measurements of the phonon dispersions and density of states with x-ray and neutron scattering, and density functional theory (DFT) simulations including alloying effects explicitly.
In the present study, we performed a comprehensive set of phonon measurements, complemented with first-principles simulations, which enable us to quantitatively assess the effect of Te alloying on the lattice dynamics and phonon transport in . We investigated the phonon DOS of powders with INS in () for 12 temperatures over a wide range (K). In addition, we performed inelastic x-ray scattering (IXS) measurements of low-energy phonon dispersions on single crystals in () at K. We also performed density functional calculations of phonons for both the parent compound and Te-doped supercells representing the alloy, and gained insights into changes in bonding. We combined our experiments and simulations to model the contributions of different phonon scattering mechanisms to , which we compare with the reported thermal conductivity data. Our results clearly show that the electron-phonon coupling strongly affects the lattice dynamics and thermal conductivity in , and is suppressed with Te alloying. Our analysis also points to an increase in phonon scattering owing to the coupled magnetic-structural fluctuations around K in the undoped compound, although the magnetism does not appreciably alter the overall force-constants and phonon energies.
II Sample Preparation
Polycrystalline () samples were synthesized by a solid-state reaction method. A homogeneous mixture (15 grams) of Mo (Alfa, 99.999%), Sb (Alfa, 99.9999%), and Te (Alfa, 99.9999%) powder was loaded into a quartz tube and sealed under approximately 1/3 atmosphere of argon gas. The Mo powder was first reduced in flowing Ar balanced with 4% H2 for overnight at 1273 K. The sealed ampoules were heated to 993 K in 12 hours and kept at this temperature for three weeks. Room temperature x-ray powder diffraction measurements confirmed that both compositions had no impurity and were single-phase (cubic ). Furthermore, relative lattice parameter contraction in doped composition in comparison to undoped composition confirmed that the Te content is close to the nominal one. The superconducting transition temperature of K was confirmed for the parent compound by measuring magnetic susceptibility using a Quantum Design Magnetic Property Measurement System. No sign of superconductivity at 1.80 K was observed in the powder sample with nominal composition of .
Millimeter sized () single crystals were grown with a self-flux method technique Yan et al. (2013, 2015). The real composition of as-grown crystals was determined by elemental analysis performed with a Hitachi TM-3000 tabletop electron microscope equipped with a Bruker Quantax 70 energy dispersive x-ray system. is the only line compound in Mo-Sb binary system, and our elemental analysis indicated no deviation from stoichiometry. The real composition of the Te-doped crystals was determined to be . single crystals used in this study have been well characterized, as previously reported Yan et al. (2013). Magnetic measurements confirmed that single crystals do not superconduct above 1.8 K.
III Inelastic Scattering Experiments
III.1 Neutron Scattering
Inelastic neutron scattering measurements on () powders were carried out using the ARCS time-of-flight chopper spectrometer at the Spallation Neutron Source (SNS) at Oak Ridge National Laboratory Stone et al. (2014). The powders (mass g) were encased in thin-walled aluminum cans. Measurements at low temperature ( K) were performed with the sample container inside a closed-cycle helium refrigerator, with the sample chamber filled with a low pressure of helium. High-temperature ( K) measurements used a low-background resistive furnace. All measurements used an oscillating radial collimator to minimize scattering from the sample environment. The empty aluminum can was measured in identical conditions at all temperatures. Two incident neutron energies meV and 55 meV were used at each temperature, to provide higher resolution data for low-energy optic modes, and to probe the full spectrum, respectively. The energy resolution (full width at half maximum) for incident energies meV and 55 meV are 1.3 meV and 2.2 meV at elastic line, respectively, which reduces to 0.4 meV and 1.2 meV at energy transfer of 30 meV.
The data were normalized by the total incident flux, and corrected for detector efficiency. The transformation of data from instrument coordinates to the physical momentum transfer, , and energy transfer, , was performed using the MANTID reduction software MANTID (2015). The scattering from the empty container was processed identically and subtracted from the sample measurements. The analysis of the phonon DOS was performed within the incoherent scattering approximation, and corrected for the effect of multiphonon scattering Fultz et al. (2011). The data in the region of the elastic peak were removed, and a Debye-like quadratic energy dependence was used to extrapolate the DOS at low energy ( meV for meV and meV for meV).
The phonon spectra derived from INS measurements are skewed by the relative neutron scattering strengths of the elements present in the sample (neutron-weighting, NW). The partial phonon DOS of each element is weighted differently, according to the ratio of that element’s scattering cross-section () and mass (m). The neutron weighting factors for Mo, Sb, and Te are , , and , respectively (in units of barns/amu). Consequently, the total experimentally measured phonon DOS, , for is over-weighted for the Mo vibrational contributions:
| (1) | |||||
where , , and are the partial densities of states of Mo, Sb, and Te. However, the resulting neutron-weighted phonon DOS can be directly compared against the simulated DOS to which the same neutron-weights are applied (see below). We note that in this study, we keep the overall and partial phonon DOS normalized to a unit integral.
III.2 X-ray Scattering
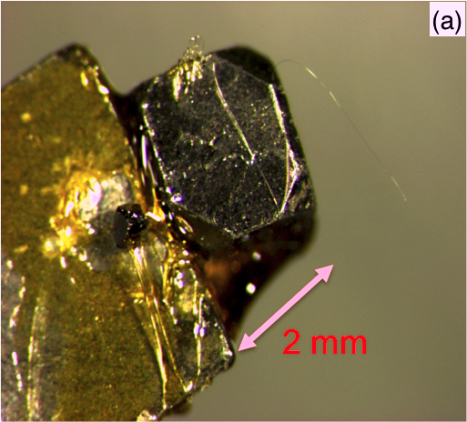
Phonon dispersion curves of () were extracted from the high resolution inelastic x-ray scattering (IXS) measurements on small single-crystals, using beamline 30-ID-C (HERIX Toellner et al. (2011); Said et al. (2011)) at the Advanced Photon Source (APS). The highly monochromatic x-ray beam had an energy keV (Å), with an energy resolution meV (full width at half maximum), and was focused on the sample with a beam cross-section m (horizontalvertical). The convoluted energy resolution of monochromatic x-ray beam and analyzer crystal was meV. The single crystals of and were approximately mm across with well defined facets. The measurements were performed in reflection geometry off facets, with the crystals glued to Beryllium posts using varnish, and mounted in a closed-cycle helium refrigerator. A crystal used for IXS is shown in figure 1-a. Typical counting times were in the range of 40 to 120 s at each point in energy scans at constant .
The orientation matrix was defined using (6,6,0) and (0,6,0) Bragg peaks, and checked with other peaks. The longitudinal and transverse acoustic dispersions along high symmetry directions were measured along , , , , , and . The spectra were fitted with a damped-harmonic-oscillator scattering function Lovesey (1984), subsequently convoluted with the measured instrumental resolution function, :
| (2) |
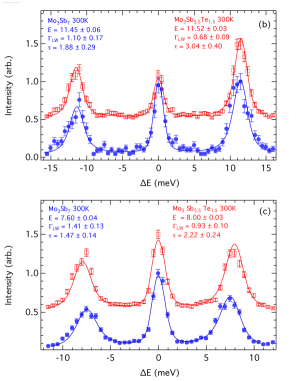
where is the constant background, is the temperature-dependent Bose-Einstein distribution at phonon energy transfer , is the amplitude, is full phonon linewidth at half maximum, and is the bare phonon energy in the absence of damping (the sign is for and sign for ). Typical IXS spectra and the corresponding fits are shown in figure 1.
IV Density Functional Theory Simulations
First-principles simulations were performed in the framework of density functional theory (DFT) as implemented in the Vienna Ab initio Simulation Package (VASP 5.3) VASP (2015); Kresse and Hafner (1993); Kresse and Furthmller (1996a, b). A Monkhorst Pack electronic k-point mesh was used for all of our simulations, with a plane-wave cut-off energy of 500 eV. The projector-augmented-wave potentials explicitly included 14 valence electrons for Mo (), 5 for Sb (), and 6 for Te (). All our calculations used the generalized gradient approximation with PBE parametrization Perdew et al. (1996).
During the relaxation of the structure, the lattice parameters were kept fixed at the experimental value for the cubic phase at room temperature Candolfi et al. (2008, 2009a), and atomic positions were optimized until forces on all atoms were smaller than 1 meV Å-1. The calculations of phonon dispersions were performed in the harmonic approximation, using the finite displacement approach as implemented in Phonopy Togo (2015); A. Togo et al. (2008), with the atomic forces in the distorted supercells obtained with VASP. In the case of , the phonon calculations used a supercell of the primitive cell, containing 160 atoms.
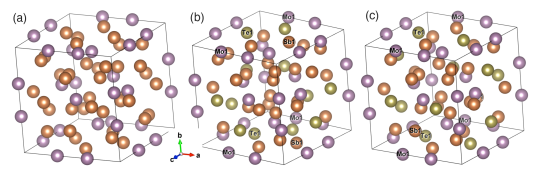
To describe the random alloy with , we built two cubic supercells (40 atoms), in which six Sb atoms were replaced with six Te atom to represent Mo:Sb:Te :: 3:5.5:1.5 composition as . The cubic unit cells of and the two cells representing the alloy are shown in figure 2. In the body-centered-cubic structure (BCC) of , the Mo, Sb(1), and Sb(2) atoms occupy crystallographic sites 12e, 12d, and 16f. Prior studies of have shown, using neutron diffraction and ab initio computations of energetics, that Te substitution occurs preferentially at the 12d site as opposed to 16f Candolfi et al. (2008). Hence, in building the 40-atom supercells describing the alloy, we have replaced 6 Sb(1) atoms at site 12d with 6 Te atoms. There are multiple possible choices for placing six Te atoms on the Sb(1) sites. To limit the computational requirements, we chose two configurations (case 1 and case 2), illustrated in figure 2. To compute phonons for the alloy, supercells of the two alloy cells in each case (the two phonon supercells contained 320 atoms). To construct the force-constant matrix using the finite displacement approach, we computed 5, 26 and 36 independent atomic displacements for the undoped cell, case 1, and case 2, respectively. The atomic displacement amplitude was one hundredth of the lattice constant.

V Results and Discussion
V.1 Phonon Density of States
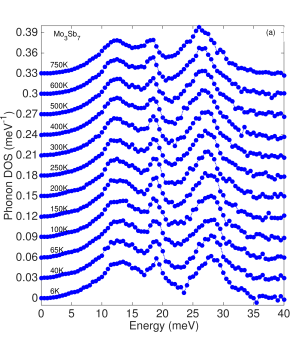
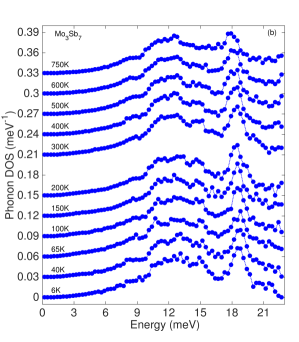
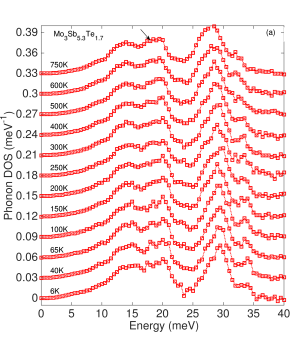
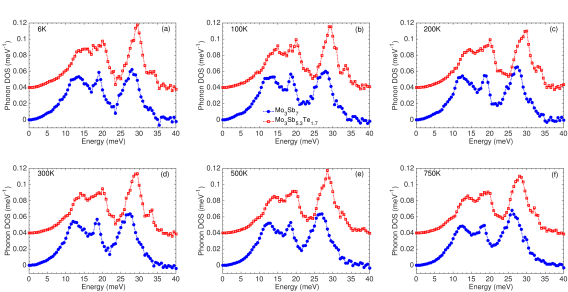
The neutron-weighted phonon DOS from INS are shown in figures 3 and 4 for and , respectively, at the different temperatures measured and for the two incident energies used. A clear softening of phonons (shift to lower frequencies) is observed over the full phonon DOS when increasing temperature, but with quite different magnitudes in the doped and undoped compounds. To analyze this softening, we have compared the mean phonon energy with the expected softening upon thermal expansion within the quasi-harmonic (QH) approximation. We use an average thermodynamic Grüneisen parameter , where is coefficient of linear thermal expansion, is the unit cell volume, the iso-thermal bulk modulus, and the heat capacity at constant volume (per unit cell). The iso-thermal bulk modulus was obtained from the phonon group velocities at 300 K derived from our IXS measurements (table 3), while was calculated from the phonon DOS measured at T=6 K, in the harmonic approximation, and magnetic and electronic contributions to the specific heat were added at low temperatures Tran et al. (2008). We obtain and 0.70 for and , respectively. It can be observed from figure 5-b, that, while both materials deviate from the QH approximation for K, this deviation is more pronounced in the undoped system at low temperatures . While follows the QH behavior fairly well at low , displays an unusual temperature dependence and softens much faster, in agreement with the data reported by Candolfi et al. Candolfi et al. (2011). As we will show later, this pronounced softening in is due to the electron-phonon coupling, which strongly influences phonon energies, lifetimes, and group velocities. We point out that the INS data on powders do not show much change across the 53 K phase transition in . We could not detect any magnetic scattering intensity at low (see figure 6). The NW phonon DOS curves also show little change between 40 K and 65 K (figure 3), indicating a relatively weak effect of magnetic correlations on the overall lattice dynamics (force-constants) in this system. However, the magnetic fluctuations and the distortions from pairing of Mo dimers are likely to lead to increased phonon scattering rates (increased linewidths), which would not be easily detectable in the phonon DOS. Our analysis of thermal transport based on phonon group velocities reveal this effect more clearly (see below).
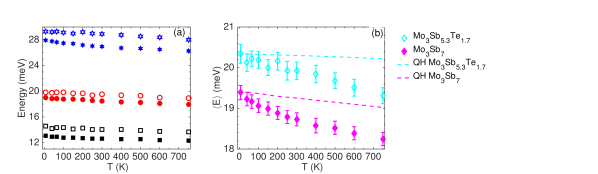
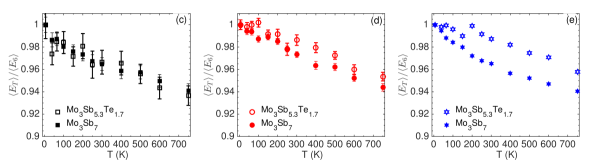
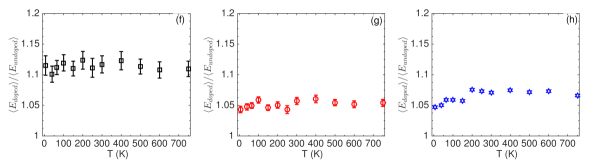
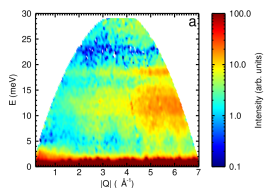
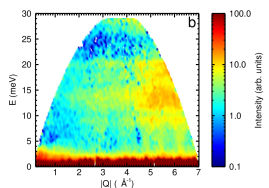
Figure 7 illustrates the effect of Te alloying. A significant stiffening 1.0 meV is observed upon introduction of Te, and results from a combination of decrease in lattice parameter upon Te doping and of reduction in carrier concentration (from in to in Shi et al. (2011)). Importantly, the contraction in lattice parameter with Te doping ( Candolfi et al. (2008)) only accounts for 0.35% of the observed phonon DOS stiffening. Thus, additional mechanisms such as the change in bonding and suppression in electron-phonon coupling could explain the large observed stiffening. The stiffening with Te doping occurs at all temperatures and remains fairly constant with temperature (see figure 5(f, g, h)).
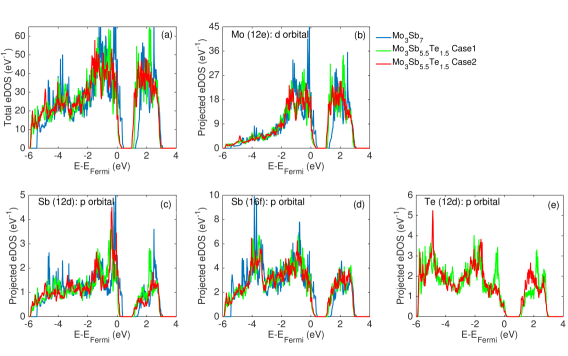
Interestingly, by examining figure 7, one can observe that the magnitude of phonon energy shifts upon Te doping is not uniform across the entire DOS. In particular, the phonon peak at 14 meV is most sensitive to doping (%) while the peaks at 19 meV and 28 meV stiffen by about 5% and 6%, respectively. We identified the origin of this difference by determining which atomic sites are predominantly involved in these different frequency regions of the phonon DOS, based on our DFT simulations. As can be seen in figure 8, in the simulated partial phonon DOS, the modes at 14, 19, and 28 meV correspond predominantly to vibrations of Sb(12d), Sb(16f), and Mo(12e) atoms, respectively. Thus, the 14 meV peak is most sensitive to the Te doping, owing to the preferred Te substitution on the (12d) site. This behavior also reveals a larger bonding change around the Te dopants (12d), rather than an average renormalization of force-constants. We discuss this point in more details below.
V.2 Bonding
To investigate the modifications in chemical bonding responsible for the observed changes in vibrational properties, we first examine the electronic density of states (eDOS) of and obtained with DFT, shown in figure 9. As can be seen in this figure, the two doped supercells (case 1 and case 2) have a very similar eDOS, indicating that the particular location of Te dopants among 12d sites does not impact the results strongly. In both of the doped cells, the Fermi level (origin of energy axis) is pushed up towards the top of the valence band, compared to , with little distortion of the eDOS. This rigid band shift is rationalized as the filling of holes by the extra electrons of Te. Because of the slope in the eDOS, this shift of decreases the number of electronic states at the Fermi level (), in agreement with previous observations by Candolfi et al. Candolfi et al. (2008, 2009a) and Xu et al. Xu et al. (2009). This decrease in eDOS at Fermi level originates from -states of Mo(12e), and -states of Sb(12d), Sb(16f), and Te(12d) atoms, with the projected eDOS showing suppressions at the Fermi level of about 18%, 14%, 18%, and 77%, respectively. In order to evaluate these changes, we have averaged the eDOS of supercells in case 1 and case 2.
In previous studies, some of us showed that sharp features in the eDOS near the Fermi level can result in a strong sensitivity of the electron-phonon coupling on either temperature or doping Delaire et al. (2008a, b, 2009, 2011b). A similar behavior is observed in the present case of , with its strong sensitivity to band filling (Te doping). At low temperature, follows the QH model, while the significantly larger electronic density at the Fermi level in leads to a large deviations from QH behavior.
The change in density at the Fermi level impacts the effectiveness of screening of forces on the ion cores. Our first-principles lattice dynamics simulations of and illustrate this effect very clearly. As we can observe from figure 3, 4, and 8, our simulations capture the lattice dynamics of the two compositions very well, including the overall shape of the spectrum, as well as the frequencies of phonon peaks, and also the relative stiffening with Te doping. In particular, we observe the pronounced shift of the Te-dominated peak at meV in both simulations and measurements. A very good agreement is also achieved between our IXS measurements of phonon dispersions and our DFT simulations, as will be discussed below.
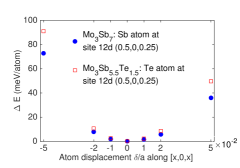
Given the reliability of our DFT simulations, we can rationalize the effects of Te doping observed experimentally by investigating the behavior of interatomic force-constants. Table 1 lists the Born-von Karman (BvK) force constants of two compositions for first-nearest-neighbor (1NN) bonds between different pairs of atoms (see illustration in figure 10). The values reported in table 1 correspond to the norm of the BvK force-constant matrix for each nearest pair of atoms. Since in the alloy supercell case 2, we replaced Sb with Te at 12d sites that are far apart, a direct comparison with 1NN force-constants is not possible. Thus, we limit ourselves to comparing case 1 with the undoped cell. As can be seen in table 1, the increase in force-constants with Te doping is large, in particular for the bonds Mo(12e)-Mo(12e), Sb(12d)-Sb(12d), and Sb(16f)-Sb(16f). A slight decrease () of the stiffness of the Mo(12e)-Sb(12d) 1NN bond is observed with Te doping. However, the Mo(12e)-Te(12d) bond is comparatively much stiffer, effectively stiffening the average Mo(12e)-Te/Sb(12d) bond in the alloy , in comparison to Mo(12e)-Sb(12d) in the pure compound . Accounting for the respective number of bonds in the alloy, we determine that the average Mo(12e)-Te/Sb(12d) bond stiffness increases by 108%, compared to the undoped system. The large stiffening of this bond is reflected in the experimentally observed 10% stiffening of the meV phonon peak (figure 5), which is dominated by Sb/Te(12d) atomic motions, as seen in the partial phonon DOS (figure 8). Similarly, the stiffening of the bond stiffness for Mo(12e)-Mo(12e) and stiffening for Sb(16f)-Sb(16f) lead to the observed and stiffening of phonon peaks at 28 and 19 meV, respectively. The change in local bonding upon Te substitution can also be seen by computing the stiffness of the local potential energy surface with DFT. Figure 11 shows the potential curves for small displacements of the Sb or Te atom from the 12d site, revealing a much stiffer bonding in the case of Te.

| BvK FC () | increase | ||
|---|---|---|---|
| Mo(12e)-Mo(12e) | 6.16 | 3.76 | 63.70 |
| Mo(12e)-Sb(12d) | 6.07 | 6.45 | -5.78 |
| Mo(12e)-Sb(16f) | 13.59 | 11.63 | 16.79 |
| Mo(12e)-Te(12d) | 7.53 | ||
| Sb(12d)-Sb(12d) | 2.23 | 1.37 | 62.60 |
| Sb(12d)-Sb(16f) | 1.91 | 1.63 | 17.48 |
| Sb(12d)-Te(12d) | 2.85 | ||
| Sb(16f)-Sb(16f) | 6.95 | 4.74 | 46.47 |
| Sb(16f)-Te(12d) | 2.01 | ||
| Te(12d)-Te(12d) | 3.45 |
Based on the BvK force-constants, one can rationalize the behavior of experimental and computed phonon spectra. Considering the force-constants of Sb(12d)-Sb(12d) (2.23 ) and Te(12d)-Te(12d) (3.45 ) in doped cells, we observe that the pair of Te(12d) atoms is much stiffer than the Sb(12d) pair. This separates the frequencies of Te(12d)-dominated vibrations from Sb(12d) vibrations, giving rise to two distinct phonon peaks at 14 meV and 18 meV. In contrast, the much smaller change in force-constants of Sb(12d)-Sb(16f) (1.91 ) and Te(12d)-Sb(16f) (2.01 ), and Sb(12d)-Mo(12e) (6.07 ) and Te(12d)-Mo(12e) (7.53 ) do not lead to any peak splitting (see figure 8).
V.3 Thermal Transport
In the remainder of the discussion, we focus on thermal transport properties. To quantify the impact of the change in bonding on the thermal conductivity, we consider the phonon dispersions for acoustic modes and low-energy optical branches. Figure 12 shows the phonon dispersions of computed with DFT (thin lines), together with experimental momentum-resolved phonon energies from IXS measurements (markers), for both and the Te-doped compound, at K and 300 K. The phonon energies were determined from the IXS spectra at specific wave vectors, using the fitting procedure described in introduction and illustrated in Fig. 1. We find a very good agreement between the IXS measurements for at 300 K and the DFT simulations (which used experimental lattice parameters at 300 K). Our DFT simulations for the phonon dispersions are in fair overall agreement with prior reports by Candolfi et al. Candolfi et al. (2011) and Wiendlocha et al. Wiendlocha et al. (2008); Wiendlocha and Sternik (2014), except for the strong underestimation of the energy of the transverse acoustic branch along in these prior studies. This is likely the result of the smaller cells used to compute the phonons in these prior studies. The larger unit cells used in our computations were necessary to achieve the level of agreement with experiments observed here.
Considering the effect of Te alloying on phonon dispersions, we note that the amount of stiffening depends on the polarization of branches. The stiffening of transverse acoustic (TA) modes is pronounced along all directions measured (–H, –P, –N). On the other hand, the LA mode stiffens noticeably with Te-doping along –N, but there is little change of LA with doping, on average, along –H. Tables 2 and 3 compare the phonon group velocities and elastic moduli derived from the phonon dispersions calculated with DFT and measured with IXS, as well as elastic moduli from resonant ultrasound measurements Vanbebber (2013). The elastic moduli from phonon group velocity have been calculated by solving ,
| (3) |
where is the density of MPDS (2015). The density of Te-doped composition is assumed to be same as undoped composition, as and have similar atomic masses (), and lattice parameter are approximately equal (less than 0.1% different at 300K). The bulk modulus, , obtained from IXS dispersions is adiabatic , and can be converted to iso-thermal bulk modulus using . In all cases, we find that the change is practically negligible and within the experimental error bars, however (less than 0.075%). The good agreement between experimental IXS data, resonant ultrasonic measurements, and DFT simulations provides confidence in our methods and results. We note that our experimental ( GPa) and computational results ( = 134 GPa) for the bulk modulus are much larger than the estimates ( 72–73.6 GPa) reported by Candolfi et al. Candolfi et al. (2011)

| Direction | Mode | (m/s) | (m/s) | |||||
| DFT | Exp. 100K | Exp. 300K | Case1 DFT | Case2 DFT | Exp. 100K | Exp. 300K | ||
| TA | 2578 | 2626157 | 2650152 | 3153 | 3180 | 2979176 | 2975156 | |
| LA | 4857 | 4461103 | 4408386 | 4830 | 4380 | 4515110 | 4636254 | |
| TA1 | 2483 | 2538107 | 229291 | 2228 | 2589 | 270459 | 26506 | |
| TA2 | 2609 | 277910 | 2736132 | 3211 | 3193 | 3049213 | 304624 | |
| LA | 4929 | 4596242 | 4737335 | 5280 | 5334 | 486259 | 4972177 | |
| TA | 2501 | 250064 | 245526 | 2471 | 2821 | 2806154 | 2816111 | |
| LA | 4923 | 5497 | 5409 | |||||
| Modulus | ||||||||
|---|---|---|---|---|---|---|---|---|
| DFT | Exp. 100K | Ref. Vanbebber (2013) 100K | Exp. 300K | Ref. Vanbebber (2013) 300K | DFT | Exp. 100K | Exp. 300K | |
| C11 (GPa) | 204 | 17328 | 161 | 17228 | 178 | 195 | 18322 | 19127 |
| C12 (GPa) | 98 | 6811 | 90 | 8313 | 87 | 103 | 607 | 7010 |
| C44 (GPa) | 57 | 6110 | 72 | 6510 | 68 | 92 | 8210 | 8211 |
| (GPa) | 134 | 10316 | 114 | 11218 | 117 | 133 | 10012 | 11015 |
Using the phonon group velocities determined from DFT (validated against IXS), we proceed to estimate the phonon relaxation times and phonon mean free paths for the two compositions. In this analysis, we use the -dependent phonon group velocity of acoustic modes obtained from DFT simulations, for both the parent and doped . First, we estimate an average relaxation time and average mean-free-path on a point mesh, using the expression for the lattice thermal conductivity in the relaxation time approximation, and , and from values reported by Candolfi et al. Candolfi et al. (2009a). Results are reported in table 4. From these results, we can observe that the average phonon relaxation time and average mean-free-path both show a clear increase upon Te doping, especially at T=100K. The decrease in phonon linewidth at 300K, which is inversely proportional to the phonon relaxation time , is also observed in our experimental IXS data, as can be seen in figure 1. Our measurements of phonon linewidths at T=100K for the Te-doped sample are limited by the experimental resolution, and doping effects cannot be quantified at this temperature. An upper-bound estimate for the maximum phonon linewidth in the Te-doped sample at 100 K is meV along [0 K 0] for K = 0.2 r.l.u. Moreover, the 20% to 45% change in experimental or with Te doping along the measured high symmetry directions at 300K is in generally good agreement with our estimate of the change in average relaxation time in table 4, i.e., . From the data in tables 2, 3, and 4, we can assess the respective contributions of the group velocities and lifetimes to the Te-induced increase in . We find that at 100 K, the larger phonon group velocities in the Te-doped material accounts for just 25% of the increase in , while the main effect is due to the increase in phonon relaxation times. However, at 300 K the stiffening of phonon group velocities upon doping accounts for 70% of the increase in (this figure assumes that the doping-induced stiffening is independent of temperature, which is well justified in view of Fig. 5-f,g,h). This can be understood as a larger effect of electron-phonon scattering on the phonon relaxation times at low temperature, leading to the large suppression in at 100 K, as discussed more quantitatively below.
| Case1 | Case2 | |||||
| T in Kelvin | 100 | 300 | 100 | 300 | 100 | 300 |
| Average relaxation time () in ps | 10.3 | 18.3 | 40.2 | 25.3 | 41.7 | 26.2 |
| Average mean-free-path () in | 228 | 401 | 1160 | 727 | 1190 | 746 |

Several scattering mechanisms contribute to the overall phonon scattering rates, , which, following Matthiessen’s rule, can be summed if assumed to be independent processes. In the present analysis, we consider boundary scattering (), point-defect scattering (), umklapp scattering from phonon anharmonicity (), and electron-phonon scattering ():
| (4) |
| (5) |
where is the grain size, is the volume per unit cell, is the Debye temperature, is the phonon frequency, is an average Grüneisen parameter, and , , and are umklapp scattering parameters of order one. Scattering by point-defects, , is estimated as a combination of three terms – perturbations in mass, force-constant, and nearest-neighbor distance. The expression of and are given by:Klemens (1958); Tritt (2004)
| (6) |
Here, , , and are the perturbation in mass, force-constants, and nearest-neighbor distances, is the electron concentration, is the effective mass of electrons, is the Fermi velocity, is the mean free path of electrons, and is the mass density. The change in nearest neighbor distance (or local distortions) with Te doping is less than , and is not considered in this analysis as it is much smaller than the perturbations in mass and force-constants. Debye temperatures K for and K for were estimated by Shi et al. from their heat capacity measurements Shi et al. (2011). We have calculated the Debye temperature from the first moment of the measured phonon spectrum , as , where and is Boltzmann’s constant. For , we estimate Debye temperatures of K and K at 100 K and 300 K, respectively. Similarly, for we estimate K and K at 100 K and 300 K, respectively. We used the reported value of grain size (100 ) in thermal conductivity measurements Candolfi et al. (2009a, 2010), to estimate for boundary scattering. The parameters , , and have been kept constant at 1.0, 1.25, and 3.0, respectively, for both compositions. For , we do not include any mass or force-constant disorder (), while for , the electron-phonon coupling constant is set to zero (justified based on the much smaller carrier concentration). Based on mass and force-constant perturbations with Te doping (see table 1), the terms and are and , respectively. Based on values reported by Candolfi et al. Candolfi et al. (2009a, 2010), the value of for was estimated to be . The - and branch-dependent phonon frequencies and group velocities in all of our lattice thermal conductivity calculations are determined from DFT simulations as described earlier.
The resulting lattice thermal conductivities for the pure and doped systems are shown in figure 13-a,b, respectively. Our results for the doped composition at all temperatures are in fair agreement with values of reported by Candolfi et al. Candolfi et al. (2009a, 2010). As can be observed, in the magnitude and temperature of the peak in is controlled by point-defect scattering processes at low temperatures, and at high temperatures Umklapp processes become large and determine the slope of lattice thermal conductivity. The dominance of Umklapp scattering at high temperature is consistent with the analysis of by Shi et al. Shi et al. (2011). However, the prior study by Shi et al. Shi et al. (2011) underestimated the point-defect scattering by only considering the contribution from mass perturbation and ignoring the effect of force constant perturbation in . However, according to our estimates, the force-constant perturbation () is approximately ten times greater than the mass perturbation (), and cannot be ignored.
The very low lattice thermal conductivity in is a result of strong electron-phonon coupling in this compound, combined with the large unit cell leading to many flat optical branches. From figure 13(a), we can observe that is greatly suppressed by scattering processes from electron-phonon interaction at low temperature, which still contribute significantly at room temperature. As described earlier, the electron-phonon interaction affects both the phonon group velocities and the relaxation times. From our calculations, we find that in at 100K, the suppression in the phonon relaxation time compared to is dominated by the electron-phonon scattering, i.e., . Moreover, at 300K, electron-phonon scattering contributes about 85% of the total phonon scattering rate compatible with large electron-phonon coupling in metals Grimvall (1981), while the increase in Umklapp scattering accounts for most of the rest. We note that we have ignored the interaction of phonons with Mo-Mo magnetic dimers and local distortions at low temperature, where magnetic properties may influence the thermal transport behavior. Consequently, our model does not capture the minimum in at K reported by Candolfi et al. Candolfi et al. (2009a) and Yan et al. Yan et al. (2013). We attempted to include this extra source of phonon scattering with a resonance-scattering term Pohl (1962), but the pronounced dip in experimental curves could not be reproduced. It is likely that the unusual of near K is closely related to its structural instability induced by the competing magnetic interactions Yan et al. (2015), but a more complex phonon scattering model, beyond the scope of the present study, would be required to describe this effect. To summarize the present discussion, we emphasize that at temperatures (), the increase in with Te doping is primarily arising from the reduction in electron-phonon coupling, which significant increases the phonon group velocities and relaxation times.
VI Conclusion
We have investigated phonons in the candidate thermoelectric material , using inelastic neutron and x-ray scattering, as well as DFT simulations. The phonon DOS exhibits a strong overall stiffening upon alloying with Te, which is well reproduced in our DFT simulations of alloy supercells. We also observed that the phonon DOS for both and shows a significant softening with increasing temperature, beyond the effect of thermal expansion in the quasi-harmonic approximation. Our first-principles phonon simulations for reveal that Te doping leads to strong local perturbations of the bonding environment and interatomic force-constants. In particular, the bonds Sb(12d)-Sb/Te(12d), Mo(12e)-Mo(12e), and Sb(16f)-Sb(16f) stiffen by as much as 108%, 65%, and 45%, respectively, upon substitution of Te at the Sb(12d) site. As a result of this strong local perturbation, the phonon spectrum stiffens in a non-uniform manner. Furthermore, our phonon dispersion measurements with IXS, combined with DFT simulations, reveal that the suppression in electron-phonon coupling upon Te-doping largely accounts for the increase in lattice thermal conductivity. This suppressed electron-phonon coupling increases the phonon group velocities and phonon relaxation times, despite the introduction of significant impurity scattering from force-constant disorder.
VII Acknowledgements
We would like to thank Dr. John Tischler for providing software and guidance to fit the IXS spectra. Neutron and x-ray scattering measurements and analysis was supported by the U.S. Department of Energy, Office of Science, Basic Energy Sciences, Materials Sciences and Engineering Division, through the Office of Science Early Career Research Program (PI Delaire). Computer simulations and analysis were supported through CAMM, funded by the U.S. Department of Energy, Basic Energy Sciences, Materials Sciences and Engineering Division. Sample synthesis was supported by the U.S. Department of Energy, Office of Science, Basic Energy Sciences, Materials Sciences and Engineering Division. The use of Oak Ridge National Laboratory’s Spallation Neutron Source was sponsored by the Scientific User Facilities Division, Office of Basic Energy Sciences, U.S. DOE. This research used resources of the Advanced Photon Source, a U.S. Department of Energy (DOE) Office of Science User Facility operated for the DOE Office of Science by Argonne National Laboratory under Contract No. DE-AC02-06CH11357. Theoretical calculations were performed using resources of the National Energy Research Scientific Computing Center, a DOE Office of Science User Facility supported by the Office of Science of the US Department of Energy under contract no.DE-AC02-05CH11231.
References
- Snyder and Toberer (2008) G. Snyder and E. Toberer, Nature Materials 7, 105 (2008).
- Minnich et al. (2009) A. Minnich, M. Dresselhaus, Z. Ren, and G. Chen, Energy Environmental Science 2, 466 (2009).
- Biswas et al. (2012) K. Biswas, J. He, I. Blum, C.-I. Wu, T. Hogan, D. Seidman, V. Dravid, and M. Kanatzidis, Nature 489, 414 (2012).
- Keppens et al. (1998) V. Keppens, D. Mandrus, B. Sales, B. Chakoumakos, P. Dai, R. Coldea, M. Maple, D. Gajewski, E. Freeman, and S. Bennington, Nature 395, 876 (1998).
- Delaire et al. (2011a) O. Delaire, J. Ma, K. Marty, A. May, M. McGuire, M.-H. Du, D. Singh, A. Podlesnyak, G. Ehlers, M. Lumsden, and B. Sales, Nature Materials 8, 614 (2011a).
- Nielsen et al. (2013) M. Nielsen, V. Ozolins, and J. Heremans, Energy Environmental Science 6, 570 (2013).
- Poudel et al. (2008) B. Poudel, Q. Hao, Y. Ma, Y. Lan, A. Minnich, B. Yu, X. Yan, D. Wang, A. Muto, D. Vashaee, X. Chen, J. Liu, M. Dresselhaus, G. Chen, and Z. Ren, Science 320, 634 (2008).
- Koza et al. (2008) M. Koza, M. Johnson, R. Viennois, H. Mutka, L. Girard, and D. Ravot, Nature Materials 7, 805 (2008).
- Christensen et al. (2008) M. Christensen, A. Abrahamsen, N. Christensen, F. Juranyi, N. Andersen, K. Lefmann, J. Andreasson, C. Bahl, and B. Iversen, Nature Materials 7, 811 (2008).
- Ma et al. (2013) J. Ma, O. Delaire, A. May, C. Carlton, M. McGuire, L. VanBebber, D. Abernathy, G. Ehlers, T. Hong, A. Huq, W. Tian, V. Keppens, Y. Y. Shao-Horn, and B. Sales, Nature Nanotechnology 8, 445 (2013).
- Voneshen et al. (2013) D. Voneshen, K. Refson, E. Borissenko, M. Krisch, A. Bosak, A. Piovano, E. Cemal, M. Enderle, M. Gutmann, M. Hoesch, M. Roger, L. Gannon, A. Boothroyd, S. Uthayakumar, D. Porter, and J. Goff, Nature Materials 12, 1028 (2013).
- Rhyee et al. (2009) J.-S. Rhyee, K.-H. Lee, S.-M. Lee, E. Cho, S.-I. Kim, E. Lee, Y. Kwon, J. Shim, and G. Kotliar, Nature 459, 965 (2009).
- Shi et al. (2011) X. Shi, Y. Pei, G. Snyder, and L. Chen, Energy Environmental Science 4, 4086 (2011).
- Parker et al. (2011) D. Parker, M.-H. Du, and D. Singh, Physical Review B 83, 245111 (2011).
- Xu et al. (2009) H. Xu, K. Kleinke, T. Holgate, H. Zhang, Z. Su, T. Tritt, and H. Kleinke, Journal of Applied Physics 105, 053703 (2009).
- Candolfi et al. (2009a) C. Candolfi, B. Lenoir, A. Dauscher, J. Hejtmanek, and J. Tobola, Physical Review B 79, 235108 (2009a).
- Candolfi et al. (2009b) C. Candolfi, B. Lenoir, A. Dauscher, E. Guilmeau, J. Hejtmanek, J. Tobola, B. Wiendlocha, and S. Kaprzyk, Physical Review B 79, 035114 (2009b).
- Candolfi et al. (2009c) C. Candolfi, B. Lenoir, J. Leszczynski, A. Dauscher, and E. Guilmeau, Journal of Applied Physics 105, 083701 (2009c).
- Candolfi et al. (2010) C. Candolfi, B. Lenoir, C. Chubilleau, A. Dauscher, and E. Guilmeau, Journal of Physics: Condensed Matter 22, 025801 (2010).
- Klemens (1958) P. Klemens, Solid State Physics: Advances in Research and Applications – Thermal Conductivity and Lattice Vibrational Modes (Vol. 7, Academic Press Inc., New York, 1958).
- Tritt (2004) T. Tritt, Thermal Conductivity: Theory, Properties, and Applications (Kluwer Academic/Plenum Publishers, New York, 2004).
- Candolfi et al. (2011) C. Candolfi, B. Lenoir, A. Dauscher, M. Koza, M. de Boissieu, M. Sternik, and K. Parlinski, Physical Review B 84, 224306 (2011).
- Bukowski et al. (2002) Z. Bukowski, D. Badurski, J. Stepien-Damm, and R. Troc, Solid State Communications 123, 283 (2002).
- Koyama et al. (2008) T. Koyama, H. Yamashita, Y. Takahashi, T. Kohara, I. Watanabe, Y. Tabata, and H. Nakamura, Physical Review Letters 101, 126404 (2008).
- Koyama et al. (2009) T. Koyama, H. Yamashita, T. Kohara, Y. Tabata, and H. Nakamura, Materials Research Bulletin 44, 1132 (2009).
- Tran et al. (2008) V. Tran, W. Miiller, and Z. Bukowski, Physical Review Letters 100, 137004 (2008).
- Yan et al. (2013) J.-Q. Yan, M. McGuire, A. May, H. Cao, A. Christianson, D. Mandrus, and B. Sales, Physical Review B 87, 104515 (2013).
- Candolfi et al. (2007) C. Candolfi, B. Lenoir, A. Dauscher, C. Bellouard, J. Hejtmanek, E. Santava, and J. Tobola, Physical Review Letters 99, 037006 (2007).
- Wiendlocha et al. (2008) B. Wiendlocha, J. Tobola, M. Sternik, S. Kaprzyk, K. Parlinski, and A. Oles, Physical Review B 78, 060507 (2008).
- Okabe et al. (2009) H. Okabe, S. Yano, T. Muranaka, , and J. Akimitsu, Journal of Physics: Conference Series 150, 052196 (2009).
- Wiendlocha and Sternik (2014) B. Wiendlocha and M. Sternik, Intermetallics 53, 150 (2014).
- Yan et al. (2015) J.-Q. Yan, M. McGuire, A. May, D. Parker, D. Mandrus, and B. Sales, Physical Review B 92, 064507 (2015).
- Stone et al. (2014) M. Stone, J. Niedziela, D. Abernathy, L. DeBeer-Schmitt, G. Ehlers, O. Garlea, G. Granroth, M. Graves-Brook, A. Kolesnikov, A. Podlesnyak, and B. Winn, Review of Scientific Instruments 85, 045113 (2014).
- MANTID (2015) MANTID, “http://www.mantidproject.org,” (2015).
- Fultz et al. (2011) B. Fultz, T. Kelley, M. Mckerns, J. Lee, O. Delaire, and M. Kresch, Experimental Inelastic Neutron Scattering: Introduction to DANSE (2011).
- Toellner et al. (2011) T. Toellner, A. Alatas, and A. Said, Journal of Synchrotron Radiation 18, 605 (2011).
- Said et al. (2011) A. Said, H. Sinn, and R. Divan, Journal of Synchrotron Radiation 18, 492 (2011).
- Lovesey (1984) S. Lovesey, Theory of neutron scattering from condensed matter (Clarendon Press, Oxford, 1984).
- VASP (2015) VASP, “Vienna ab initio simulation package: http://www.vasp.at/,” (2015).
- Kresse and Hafner (1993) G. Kresse and J. Hafner, Physical Review B 47, 558 (1993).
- Kresse and Furthmller (1996a) G. Kresse and J. Furthmller, Physical Review B 54, 11169 (1996a).
- Kresse and Furthmller (1996b) G. Kresse and J. Furthmller, Computational Materials Science 6, 15 (1996b).
- Perdew et al. (1996) J. Perdew, K. Burke, and M. Ernzerhof, Physical Review Letters 77, 3865 (1996).
- Candolfi et al. (2008) C. Candolfi, B. Lenoir, A. Dauscher, J. Tobola, S. Clarke, and R. Smith, Chemistry of Materials 20, 6556 (2008).
- Togo (2015) A. Togo, “Phonopy user’s manual: http://phonopy.sourceforge.net/,” (2015).
- A. Togo et al. (2008) A. A. Togo, F. Oba, and I. Tanaka, Physical Review B 78, 134106 (2008).
- Delaire et al. (2008a) O. Delaire, M. S. Lucas, J. A. Muñoz, M. Kresch, and B. Fultz, Physical Review Letters 101, 105504 (2008a).
- Delaire et al. (2008b) O. Delaire, M. Kresch, J. A. Muñoz, M. S. Lucas, J. Y. Y. Lin, and B. Fultz, Physical Review B 77, 214112 (2008b).
- Delaire et al. (2009) O. Delaire, A. F. May, M. A. McGuire, W. D. Porter, M. S. Lucas, M. B. Stone, D. L. Abernathy, V. Ravi, S. A. Firdosy, and G. J. Snyder, Physical Review B 80, 184302 (2009).
- Delaire et al. (2011b) O. Delaire, K. Marty, M. Stone, P. Kent, M. Lucas, D. Abernathy, D. Mandrus, and B. Sales, Proceedings of the National Academy of Sciences 108, 4725 (2011b).
- Vanbebber (2013) L. Vanbebber, Synthesis, Basic Characterization, and Resonant Ultrasound Studies of Novel Materials: Iron-based Superconductors and -based Thermoelectrics, Ph.D. thesis, University of Tennessee, Knoxville (2013).
-
MPDS (2015)
P. Villars, “Material Phases Data System: http://materials.springer.com/isp/crystallographic
/docs/sd_1125052,” (2015). - Grimvall (1981) G. Grimvall, The electron-phonon interaction in metals (North-Holland Pub. Co., U.S.A., 1981).
- Pohl (1962) R. Pohl, Physical Review Letters 8, 481 (1962).