Anisotropy of X-ray bursts from neutron stars with concave accretion disks
Abstract
Emission from neutron stars and accretion disks in low-mass X-ray binaries is not isotropic. The non-spherical shape of the disk as well as blocking of the neutron star by the disk and vice versa cause the observed flux to depend on the inclination angle of the disk with respect to the line of sight. This is of special importance for the interpretation of Type I X-ray bursts, which are powered by the thermonuclear burning of matter accreted onto the neutron star. Because part of the X-ray burst is reflected off the disk, the observed burst flux depends on the anisotropies for both direct emission from the neutron star and reflection off the disk. This influences measurements of source distance, mass accretion rate, and constraints on the neutron star equation of state. Previous studies made predictions of the anisotropy factor for the total burst flux, assuming a geometrically flat disk. Recently, detailed observations of two exceptionally long bursts (so-called superbursts) allowed for the first time for the direct and the reflected burst flux to each be measured, as opposed to just their sum. The ratio of the reflected and direct flux (the reflection fraction) was much higher than what the anisotropies of a flat disk can account for. We create numerical models to calculate the anisotropy factors for different disk shapes, including concave disks. We present the anisotropy factors of the direct and reflected burst flux separately, as well as the anisotropy of the persistent flux. Reflection fractions substantially larger than unity are produced in case the inner accretion disk steeply increases in height, such that part of the star is blocked from view. Such a geometry could possibly be induced by the X-ray burst, if X-ray heating causes the inner disk to puff up.
Subject headings:
accretion, accretion disks — stars: neutron — X-rays: binaries — X-rays: bursts1. Introduction
Thermonuclear burning on the surface of an accreting neutron star in a low-mass X-ray binary (LMXB) is observed to produce Type I X-ray bursts (Grindlay et al., 1976; Belian et al., 1976; Lewin et al., 1993; Galloway et al., 2008a). Hydrogen and/or helium-rich material is accreted through a disk from the companion star, and collects on the neutron star surface until runaway thermonuclear burning ignites (Woosley & Taam, 1976; Maraschi & Cavaliere, 1977; Lamb & Lamb, 1978). As the thermonuclear burning rate increases dramatically, the surface layers burn on a timescale of seconds, powering an X-ray burst with a typical duration of to . The heated photosphere thermally emits a spectrum close to a blackbody (Swank et al., 1977; Suleimanov et al., 2011b). The burst flux surpasses the persistent X-ray flux originating from the inner accretion disk. Type I X-ray bursts are employed as standard candles for distance determination (e.g., Kuulkers et al., 2003), to study the nuclear physics of proton-rich unstable isotopes (e.g., Schatz & Rehm, 2006), and to constrain the equation of state of dense matter by measuring the neutron star mass and radius (e.g., Özel, 2006; Suleimanov et al., 2011a).
For all use cases, it is important that an accurate measure of the neutron star’s luminosity is derived from the observed flux. This poses two challenges. First, the neutron star flux must be distinguished from the persistent X-ray flux as well as from “reflection”: the diffuse scattering of the neutron star emission off the disk. Because X-ray bursts typically have short durations, the spectra are of insufficient quality to separate direct thermal emission from the neutron star from other components. An often used approach is to observe the persistent spectrum outside the burst, and assume that it remains constant during the burst. This works well in practice, as the burst emission is much stronger than the persistent emission, at least around the burst peak (see also the discussion in Kuulkers et al., 2002). Recently, however, observations have shown that the persistent component does evolve during the burst (Worpel et al., 2013; in ’t Zand et al., 2013; Ji et al., 2014; Keek et al., 2014a). Furthermore, as the reflection spectrum resembles that of the neutron star flux (Ballantyne, 2004), they are typically not distinguished. The observed burst flux is then a combination of the direct and reflected burst emission. Only in the case of two superbursts, could the Fe K line from reflection be detected, and could the reflection component be separated from the direct burst component (Ballantyne & Strohmayer, 2004; Keek et al., 2014a, b, 2015). Superbursts are exceptionally long bursts that last hours (Cornelisse et al., 2000; Strohmayer & Brown, 2002; Kuulkers, 2004; Keek & in ’t Zand, 2008). They are, however, rare, and only in those two cases were relatively high quality spectra obtained. We anticipate that future large-area X-ray observatories will have the capability to distinguish direct from reflected burst emission for a large sample of bursts (Wolf et al. 2016 in prep.), such as the Neutron Star Interior Composition Explorer (NICER, Gendreau et al., 2012) and Athena (Barcons et al., 2015).
Second, the flux is anisotropic: part of the line-of-sight to the neutron star is blocked by the disk, and the degree of anisotropy depends on the inclination of the disk. Analytic (Fujimoto, 1988) and numerical models (Lapidus & Sunyaev, 1985) have been used to investigate the effect of anisotropy on the observed flux under the assumption of a geometrically thin accretion disk. The degree by which the observed flux deviates from the isotropic flux was expressed in anisotropy factors for both the persistent and the total burst flux (direct + reflection). The anisotropy factors are important when comparing observed X-ray bursts to theoretical predictions (e.g., Heger et al., 2007), as they influence measurements of the distance from photospheric radius expansion (PRE), the mass accretion rate, and the -parameter, which is used to characterize the nuclear burning regime and fuel composition (e.g., Chenevez et al., 2015). Often studies choose to ignore the anisotropies, however, because the geometry and the inclination angle of the disk are poorly constrained. Only when dips or eclipses are observed, do we have indications that the inclination is large (Frank et al., 1987).
The detection of reflection features in two superbursts provides a new observational constraint on the anisotropy factors. The observed ratio of the direct and reflected burst flux (the reflection fraction) depends on the anisotropy factors, which in turn depend on the geometry of the system. Assuming a flat disk, Fujimoto (1988) predicts a maximum observed reflection fraction of . During the 1999 superburst from 4U 1820–30 (Ballantyne & Strohmayer, 2004) and the 2001 superburst from 4U 1636–536 (Keek et al., 2014b), however, reflection fractions were observed of up to and , respectively. This may indicate that the accretion disk geometry was not flat during the burst. A disk in equilibrium is expected to be thin (Shakura & Sunyaev, 1973), but it has been suggested that persistent accretion requires a concave shape, as the outer disk needs irradiation by the inner part to maintain its ionization state (e.g., van Paradijs, 1996; King & Ritter, 1998). Even stronger deviations from a flat geometry may result from the intense irradiation by an X-ray burst. For example, X-ray heating could cause expansion, or a disk wind could be induced by the burst (Ballantyne & Everett, 2005). Keek et al. (2015) presented an alternative interpretation of the spectra of the superburst from 4U 1636–536, which does not have large reflection fractions, but poses other problems. It is, therefore, interesting to investigate whether a disk geometry exists that can produce large reflection fractions. For the case of accreting black holes, concave disks have been shown to produce large reflection fractions (Blackman, 1999). Those results are, however, not directly applicable to accreting neutron stars, because the illuminating source is thought to be a corona above the disk, rather than a star located in the disk.
In this paper we create numerical models to calculate the anisotropy factors for a variety of disk shapes, including flat and concave disks. We calculate the anisotropy factors separately for direct and reflected burst emission, as well as the reflection fractions. Furthermore, we discuss the effects of different assumptions on the angular distribution of radiation emitted by the star and reflected off the disk, and the effect of light bending in the strong gravitational potential close to the neutron star.
2. Methods
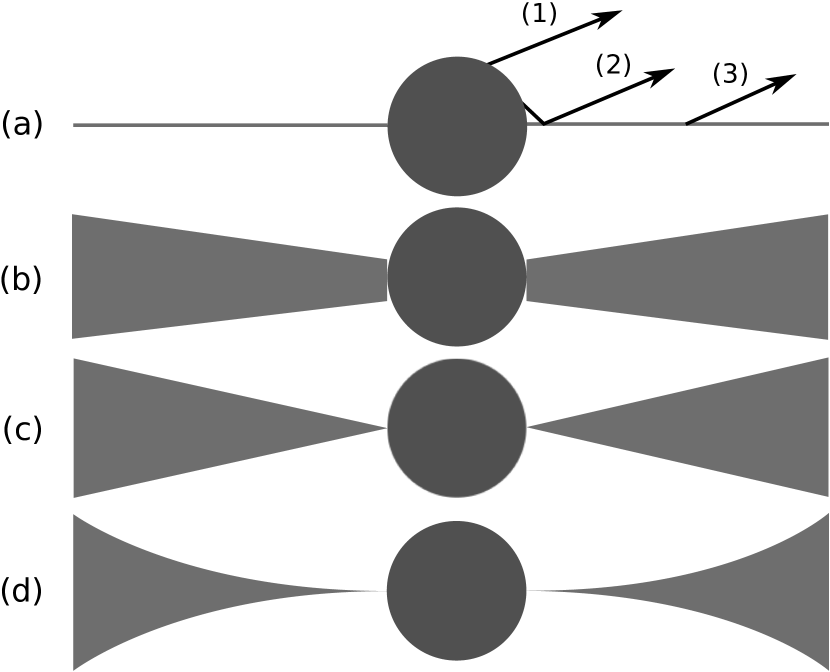
We first rederive the simple analytic model presented by Fujimoto (1988), which describes a thin flat disk. Next, we create numerical models of flat as well as concave disks (Figure 1). When accretion disks undergo sudden strong irradiation by an X-ray burst, their geometry may for a brief period deviate from the shape predicted for disks in equilibrium (Ballantyne & Everett, 2005). We, therefore, choose generic height profiles as disk shapes, rather than shapes based on accretion disk theory (e.g., Shakura & Sunyaev, 1973). The accretion environment of a neutron star may be more complex. For example, a boundary or spreading layer may be present between the inner disk and the star (Shakura & Sunyaev, 1973; Revnivtsev et al., 2001). Depending on the accretion flow, only part of the star may be covered, but during X-ray bursts the entire stellar surface is thought to be covered by the spreading layer (Lapidus & Sunyaev, 1985). Our models are, therefore, equivalent to the latter case.
Our numerical models include realistic distributions of radiant intensity and blocking of the line of sight. We test the accuracy of the numerical models using the analytic model. Before describing the models, we introduce different distribution laws of radiant intensity emitted by or reflected off plane-parallel atmospheres.
2.1. Angular Distribution of Radiant Intensity
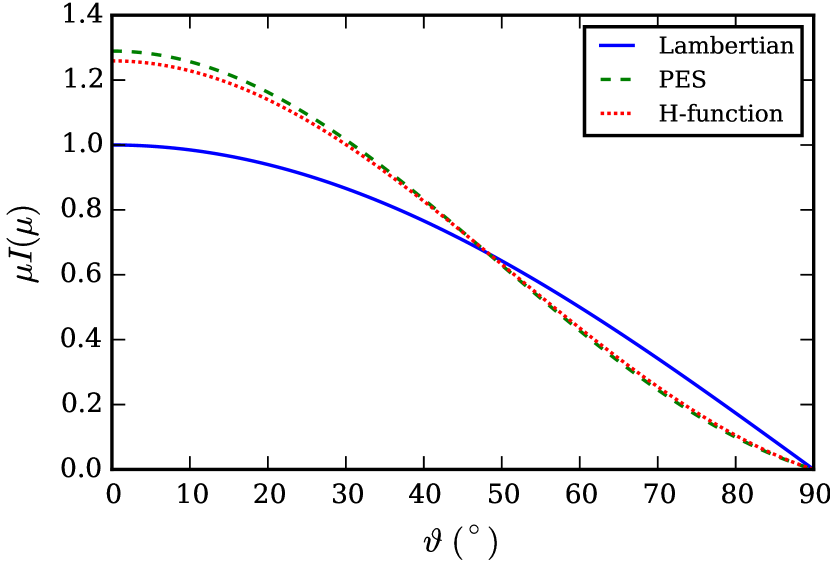
Lambert’s emission law states that the intensity emitted from an ideal diffuse radiator is proportional to the cosine of the angle between the direction of emission and the surface normal, i.e. , where . The intensity is defined such that the energy transported across an area in directions confined to solid angle during a time is . Therefore, the flux observed under an angle is proportional to .
As an alternative to Lambert’s law, we use for the neutron star a pure-electron-scattering (PES) atmosphere. The angular distribution of radiant intensity emitted from the surface is given by (Chandrasekhar 1960, see also Lapidus & Sunyaev 1985)
| (1) |
For the accretion disk we employ an -function, which applies to isotropic scattering in semi-infinite atmospheres (Chandrasekhar 1960, see also Lapidus & Sunyaev 1985). For a surface element on the disk that is illuminated by a constant incident flux , the angular distribution of the reflected light is given by
| (2) |
where the -function is defined through an integral:
| (3) |
where we assume the albedo of the disk to be .
The angular distribution of emergent radiant intensity is very similar for pure-electron-scattering and -function-like atmospheres: they differ by at most 6% (Figure 2). Compared to Lambertian atmospheres, both produce larger intensities for and smaller intensities for larger , such that radiation is more concentrated to the surface normal direction for these two types of atmospheres.
2.2. Analytic Model
The simple model presented by Fujimoto (1988) includes a spherical non-rotating neutron star and a flat optically thick accretion disk. The inner part of the disk extends to the equator of the star and the outer part to infinity (Figure 1a). Both the stellar surface and the disk surface are assumed to be Lambertian. The stellar surface is assumed to radiate homogeneously and isotropically. The observed burst flux, , and persistent flux, , are, however, anisotropic, and depend on the inclination angle of the disk with respect to the observer’s line of sight. includes both directly observed burst flux and burst reflection off the disk. Fujimoto (1988) quantifies the deviation from isotropy with the anisotropy factors for the burst, , and the persistent flux, :
| (4) |
where is the distant to the burster and are, the burst and persistent luminosities, respectively. The anisotropy factors are normalized over solid angle:
| (5) |
The system is axially symmetric, and the flux measured by a distant observer depends on the inclination angle, , between the normal of the plane of the disk and the line of sight of the observer. As the disk is considered to be a flat Lambertian surface, the observed persistent flux is proportional to (Section. 2.1), so its anisotropy factor is
| (6) |
where the factor is from the normalization (Equation 5).
We separately consider the direct burst flux, , and the reflected burst flux, , with . These flux components have different anisotropies, , which we define with respect to the total burst luminosity:
| (7) |
From Equations 4 and 7 we see that , such that the normalization of follows from Eq. 5. The observed direct burst flux is proportional to the effective area because of the equal brightness effect of Lambertian surfaces. For the entire star is visible, whereas for half the star is blocked from view by the disk. This yields the anisotropy factor for the direct burst flux:
| (8) |
includes a factor , which is the fraction of that is intercepted and subsequently scattered by the disk. We refer to as the intrinsic reflection fraction. To compute , consider a surface element on the star with area (Figure 3). The fraction of the photons emitted from this element that irradiate the disk is given by
| (9) |
with as shown in Figure 3 (see also Equation A4 for ). Performing the integration, we get . Integrating over one hemisphere of the star, we obtain the total intrinsic reflection fraction:
| (10) |
The anisotropy factor for the reflected burst flux is similar to (Equation 6) and includes :
| (11) |
Summing Equation 8 and 11, we see that has the correct normalization (Equation 5), and it reproduces the result of Fujimoto (1988).
is the intrinsic reflection fraction. The observed reflection fraction is . Using Equation 7, we find
| (12) |
For the analytic model, the observed reflection fraction is (Equations 8 and 11):
| (13) |
In our numerical model, the disk does not extend to infinity, but ends at a radius , where is the stellar radius. A complicated integration derived from our analytic model gives the relation between and (see Appendix A). for several values of are given in Table 1, which shows that most of the reflected flux originates from the inner part of the disk.
2.3. Numerical Model
Similar to the analytic model, our numerical model has a spherical neutron star and an accretion disk starting from the equator of the star. The geometry of the disk can be flat, linearly inclined, or any concave shape (see Figure 1). The disk extends to a finite outer radius, which we set at . Certain binaries with long orbital periods may have up to 50 times more extended disks (e.g., Frank et al., 2002; Tauris & van den Heuvel, 2006). We find, however, that an extent of accounts for all but a fraction of of the flux received by a flat disk that extends to infinity (Table 1). All the simulations assume that 1) photons are emitted from the whole stellar surface isotropically and homogeneously, and 2) the accretion disk reflects all the photons that are received. Re-reflection is neglected.
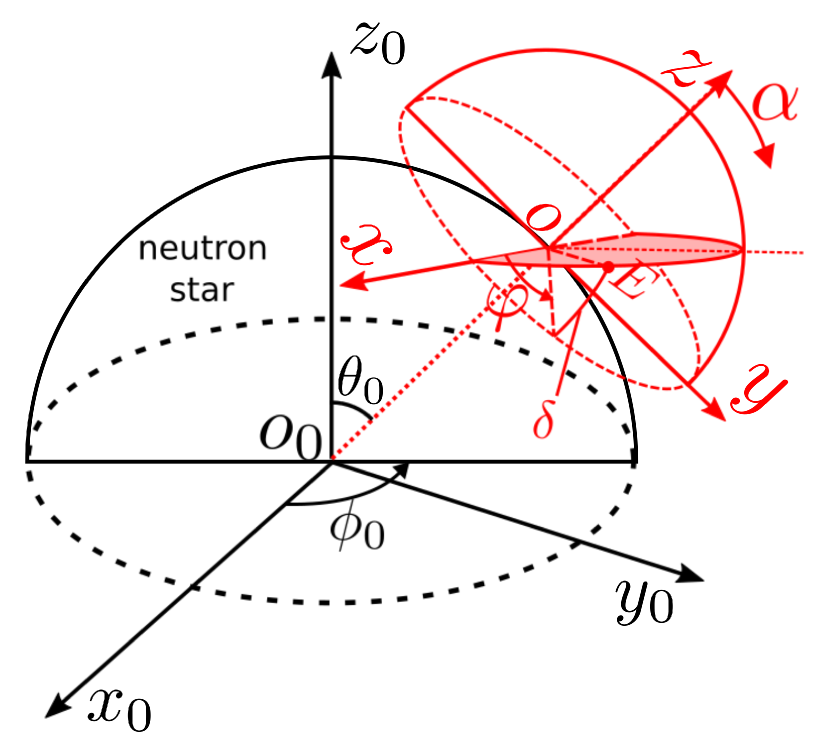
As a first step, we compute the distribution of flux received by the disk as a function of the radial distance. We equally divide the surface of the neutron star into small elements in azimuthal and polar direction. Similarly, we equally divide the surface of the accretion disk into small elements in polar direction and logarithmically in radial direction. Elements on both surfaces are well approximated as planar. We take into account the reduced effective area of an element on the disk surface as viewed from an element on the stellar surface. For each element on the disk surface we compute the flux received from each element on the stellar surface. Integrating over the whole stellar surface, we obtain the total flux received by each element on the disk.
The second step of our model calculation is computing the angular distribution of radiation as seen by a distant observer. The observer is far away from this system, and therefore the lines of sight to different points in our system are parallel. Assuming that the system is observed under a given inclination angle , we compute the angle between the observer’s line of sight and the normal vectors of each element on the disk surface. Using the flux received by each disk element, the inclination angle , and an -function, we compute the intensity reflected by each element in the direction of observer. Summation of all elements on the disk surface gives the angular distribution of intensity reflected by the whole accretion disk.
To calculate the persistent emission, we assume that the disk radiates as a blackbody. We take the temperature of the accretion disk to decrease with radius as (e.g., Bhattacharyya et al., 2000):
| (14) |
We compute the angular distribution of the persistent flux in the same way as the reflected burst flux, but replacing the reflected radiation profile with a blackbody radiation profile, which is
| (15) |
Furthermore, a pure-electron-scattering atmosphere is used instead of an -function.
The angular distribution of the direct burst flux from the star is computed by considering for the visible part of the star either a Lambertian or pure-electron-scattering radiation distribution.
Observed from a certain direction, the view of the disk or the star could be (partially) blocked. Blocking of the accretion disk by itself (disk-disk blocking), blocking of the accretion disk by the star (star-disk blocking), and blocking of the star by the disk (disk-star blocking) are taken into account.
3. Results
3.1. Comparison of Numerical to Analytic Models of Flat Disks
Our numerical model computes for Lambertian surfaces an intrinsic reflection fraction of , which has a relative difference of with the analytic model for a disk with a same radius. Ignoring blocking of the line of sight, we find for the anisotropy factors relative differences with the analytic model of less than . The numerical model is, therefore, consistent with the analytic model within . In the rest of this section, we apply the numerical model to different radiative distribution models and disk shapes.
3.2. Radiation Models for Flat Disks
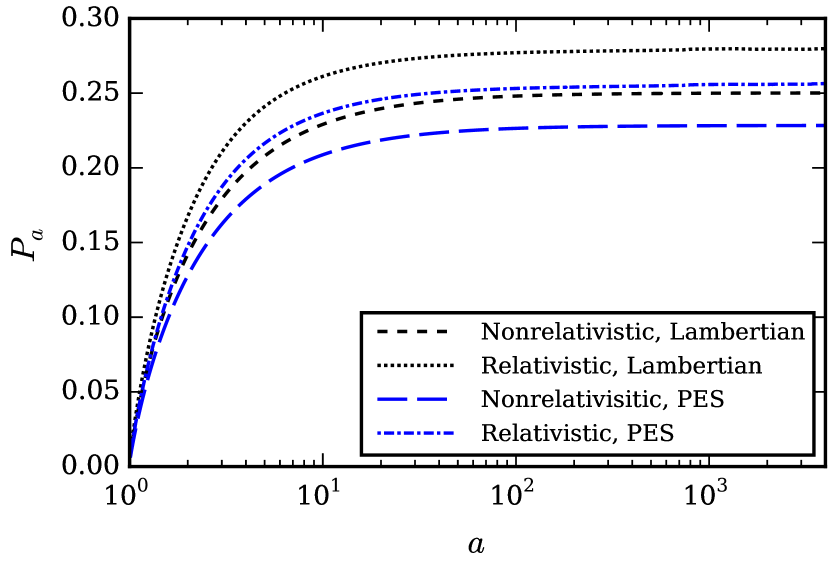
We compare the anisotropy factors of models with a flat disk for different radiative distribution models (Section 2.1). for a pure-electron-scattering neutron star is slightly larger than that of a Lambertian neutron star (Figure 4), because fewer photons reach the flat disk in the former than in the latter. In fact, in the case that the burster is Lambertian and in the case that the burster is pure-electron-scattering.
For the reflected burst emission, for a disk with an -function displays the concentration of intensity towards smaller angles for this radiative distribution (Figure 2). Furthermore, if the neutron star blocks part of the photons reflected off the disk, is a bit smaller when taking star-disk blocking into account, and the absolute difference is 0.036 at most (Figure 4).
3.3. Gravitational Light Bending
Due to its compactness, a neutron star’s surface gravity is extremely strong, and light bending occurs in its vicinity. This increases the fraction of the burst flux that is intercepted by the disk. We investigate the increase in by including light bending in the calculation for a flat disk.
We calculate a series of photon paths starting at the stellar surface and initially making an angle with the surface normal of . We employ polar coordinates , where is the inverse of the radial distance from the star’s center: . Each path is traced by using a fourth order Runge-Kutta scheme to solve the null-geodesic in the Schwarzschild metric (e.g., Hoyng, 2006):
| (16) |
with (half the Schwarschild radius), and we use a neutron star mass of and a radius of . We take steps in of , which gives a solution that is converged within .
The photon paths are employed to trace where flux from the neutron star falls on the disk (Figure 5). We find an increase of in . This increase is small with respect to the large changes in reflection fraction that we are interested in. Therefore, we will neglect relativistic effects in the remainder of our study.
3.4. Linearly Inclined and Concave Disks
In this section, we explore the angular distribution of X-ray radiation for disks with other shapes than flat, and we consider linearly inclined and concave disks (Figure 1). A so-called -disk (Shakura & Sunyaev, 1973) with a typical viscosity parameter of (e.g., King et al., 2007) is similar to our “c” shape with a slope of . We will, however, focus on much larger slopes, to investigate larger deviations from the flat disk case.
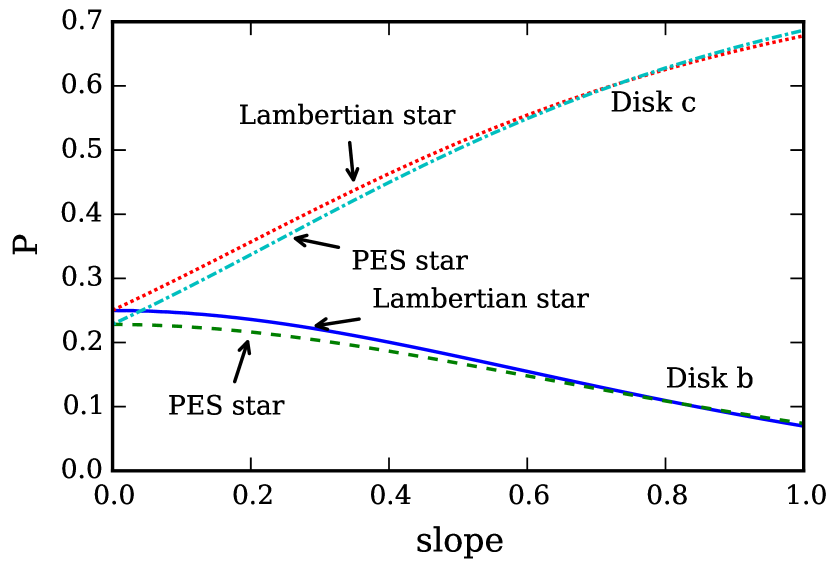
We first study the intrinsic reflection fraction, which has a large influence on the anisotropy factors. Figure 6 shows as a function of the slope of the height of the trapezoidal (shape b in Figure 1) and triangular (shape c) disk. For shape b, descreases with slope, because a disk with a larger slope covers a larger part of the stellar surface. For disks with shape c, however, a larger slope means that more burst flux is intercepted by the disk surface: for a slope of , the intrinsic reflection fraction has a large value of . The difference in between models where the star emits as a Lambertian or a pure-electron-scattering atmosphere are small (Figure 6), similar to what we saw for flat disks (Figure 4).
3.4.1 Flux Distribution Received by the Disk Surface
For flat disks, we found that most of the burst flux received by the disk falls on the inner disk (Table 1). Assuming a PES star, 90% of the radiation falls within (Figure 7). Also for linearly inclined disks (Figure 1c) most of the flux falls in a similarly small region (Figure 7). However, for a concave disk of which the outer part goes up sharply (Figure 1d), half of the flux falls on the region outside of .
At the outer radius of a flat disk around a Lambertian star, we find a total intrinsic reflection fraction of , whereas for disk d it is , which means half of the photons emitted by the neutron star irradiate the disk.
3.4.2 Anisotropy Factors
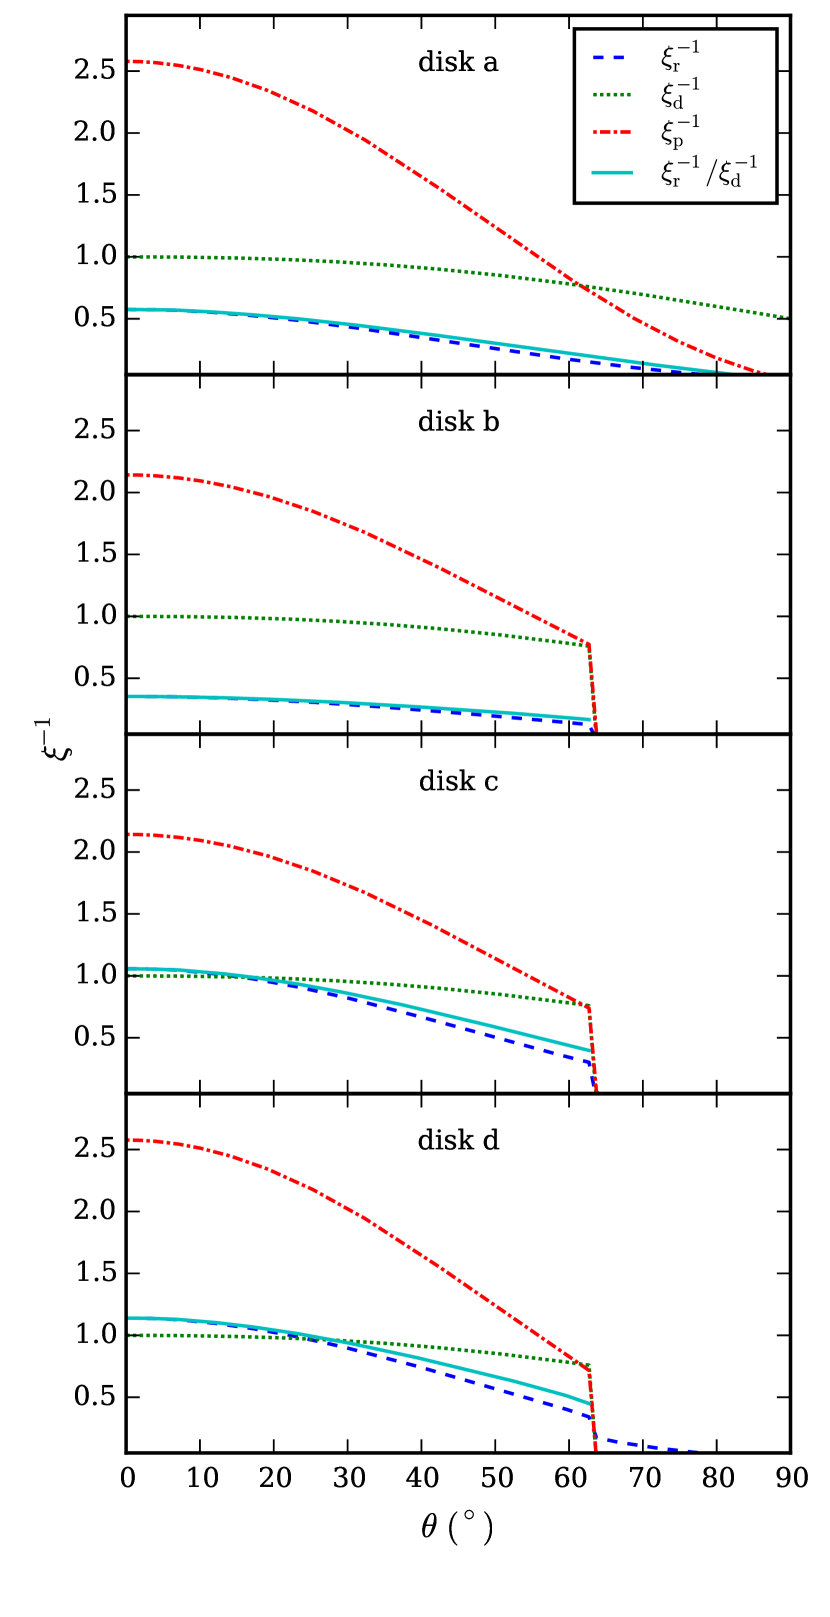
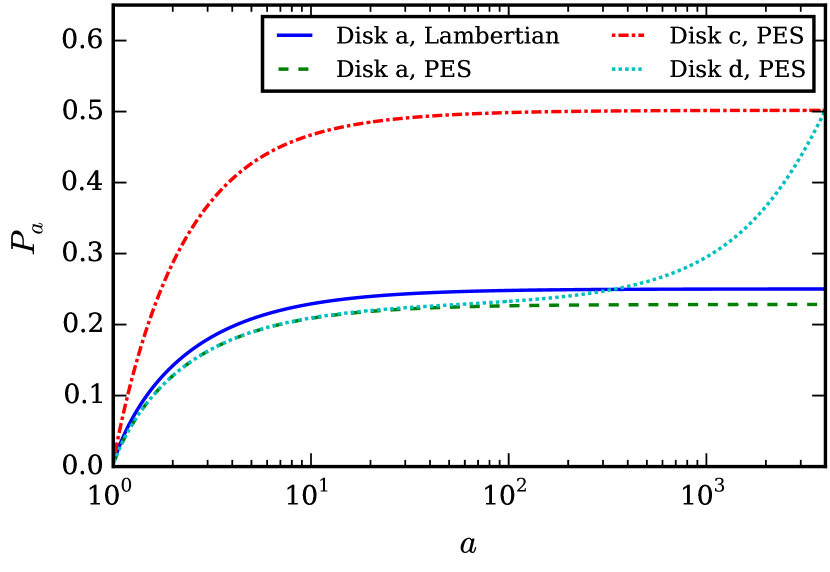
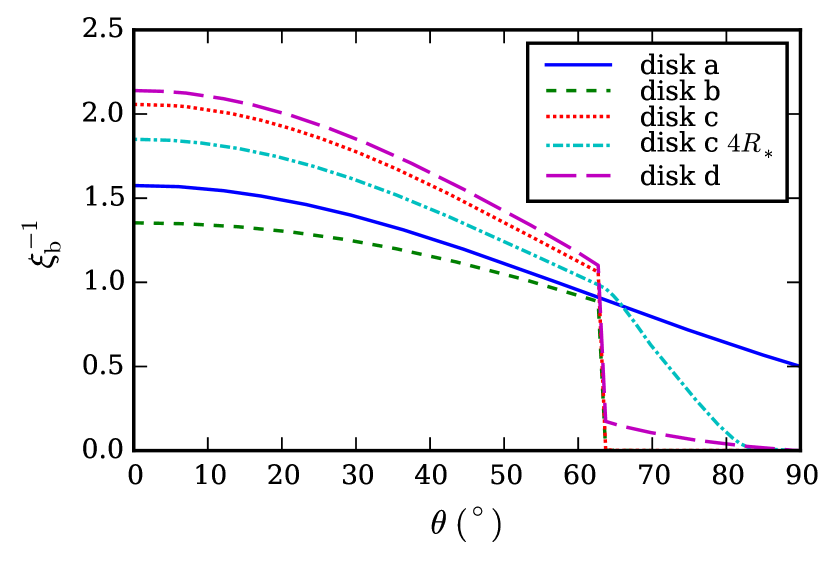
We calculate the anisotropy factors and observed reflection fractions for all disk shapes in Figure 1 (Figure 8), where we use pure electron scattering for the neutron star and an -function for the disk (Section 2.1). The anisotropy factors of the direct burst flux, , is the same for all disk shapes, as long as the view of the star is not blocked by the disk. For the chosen slopes of disks b, c, and d, the center of the star and the outer edge of the disk line up with the observer’s line of sight for an inclination of . Because the outer radius of the disk is much larger than the radius of the star, a small increase in of only completely hides the star from view, and reduces to .
There is some variation in and as a function of disk shape. Most notably, is about twice as large for disks c and d as it is for a flat disk. When the direct view of the star is blocked by the disk, disk d’s upturned outer edge still allows some reflected burst flux to reach the observer ( in Figure 8d).
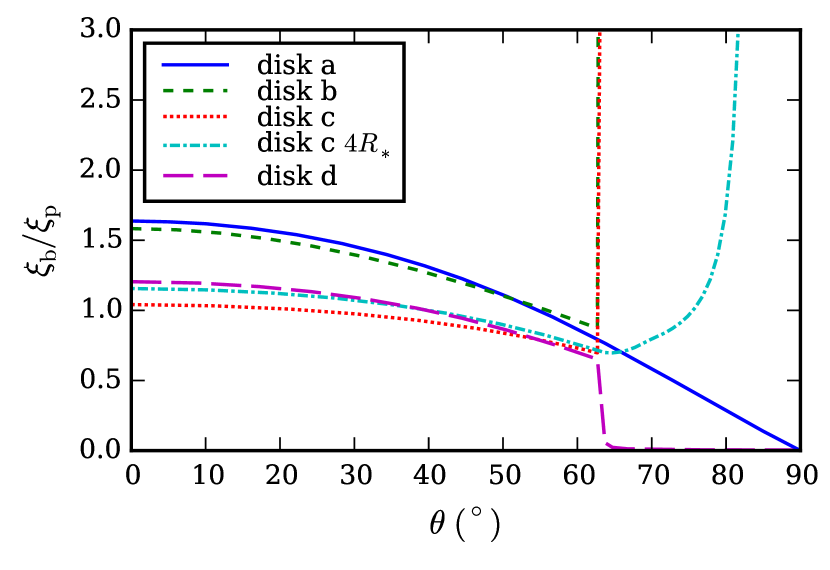
The observed reflection fraction, , follows similar trends as . For small inclination angles it even exceeds unity for shape c and d: most of the observed burst radiation is reflected off the disk. We saw that for disk c with the same slope, the intrinsic reflection fraction is (Figure 6). Therefore, it is due to the anisotropies of the system that the observed reflection fraction exceeds unity.
For the disk shapes considered so far, the observed reflection fraction peaks at . We can easily understand this for our analytic model, as drops faster with than , because falls off as whereas decreases like . The maximum is only a little bit larger than . We investigate the maximum observed reflection fraction for any disk shape.
For all shapes, the entire neutron star is visible at : . This reduces the problem to finding the maximum . The analytic model shows that consists of two factors: a factor from the radiation distribution model and (Equation 11). The former is maximal for a flat disk, where every part of the disk surface is oriented the same. For a flat -function-like disk this factor is (Section 3.2, Figure 8a). For other disk shapes, therefore, .
The physical limit for is , which means all of the burst emission is intercepted by the disk. Although not , we found that a disk with shape c can intercept the majority of the burst flux, depending on the slope (Figure 6). For shape b, however, decreases for increased slopes, because a larger part of the star is blocked by the inner disk. Therefore, we conclude that for any concave disk shape, could never exceed . An exception is the special case of partial blocking, which we discuss next.
3.4.3 Partial Blocking by a Steep Inner Disk
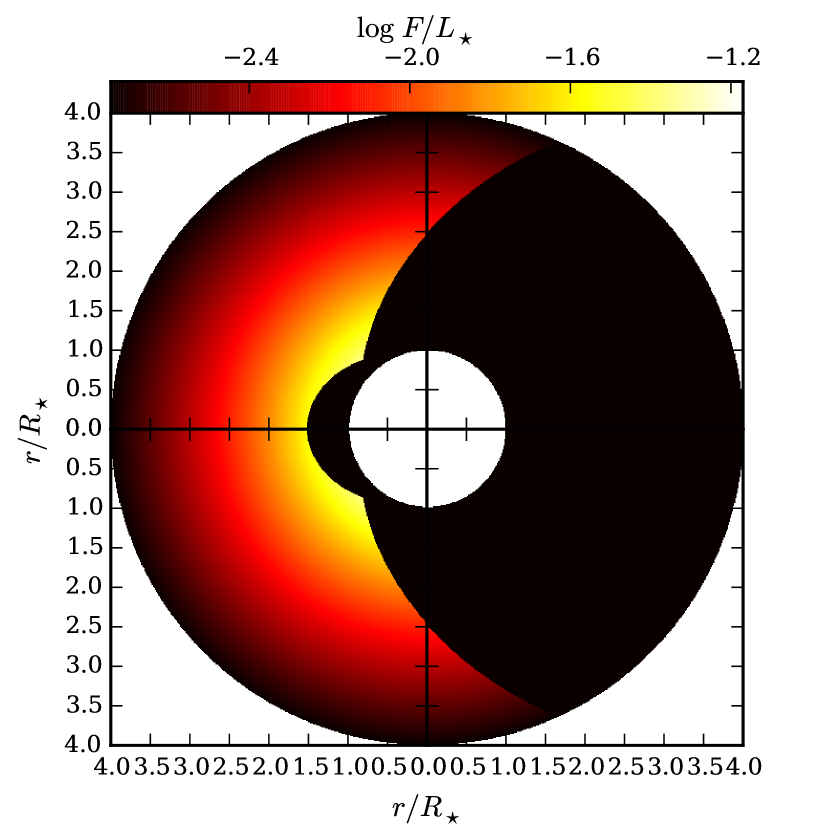
Consider a disk where the inner part steeply increases in height and the outer part is relative flat. Burst photons only hit the inner disk, which shields the outer part of the disk. For our purposes, such a geometry behaves identically to a system with a small steep disk. We employ disks with an outer radius of . Figure 9 illustrates where the burst flux falls on a disk with shape d (Figure 1), and which parts of the disk are blocked from the observer’s view. For particular inclination angles, a substantial part of the star is blocked as well, which produces a large observed reflection fraction.
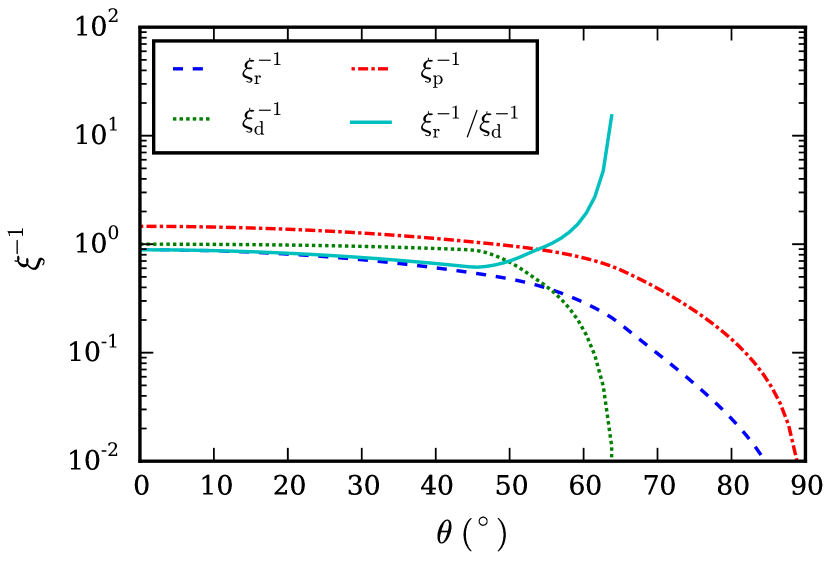
Similarly, large reflection fractions can be obtained for shape c. There is a substantial range of inclination angles for which the star is partially blocked by a small linearly inclined disk (Figure 10). At around , the direct burst flux reduces quickly as the star is being blocked by the disk, whereas the reflected burst flux changes more slowly, resulting in observed reflection fractions as large as .
4. Discussion
Anisotropy factors were calculated for different accretion disk shapes. We discuss how our simulations compare to previous models of flat disks, and we investigate the impact on observable properties, including the reflection fraction and the -parameter. Furthermore, we consider issues where anisotropies may play an important role, such as mass-radius measurements.
4.1. Comparison to Previous Models of Flat Disks
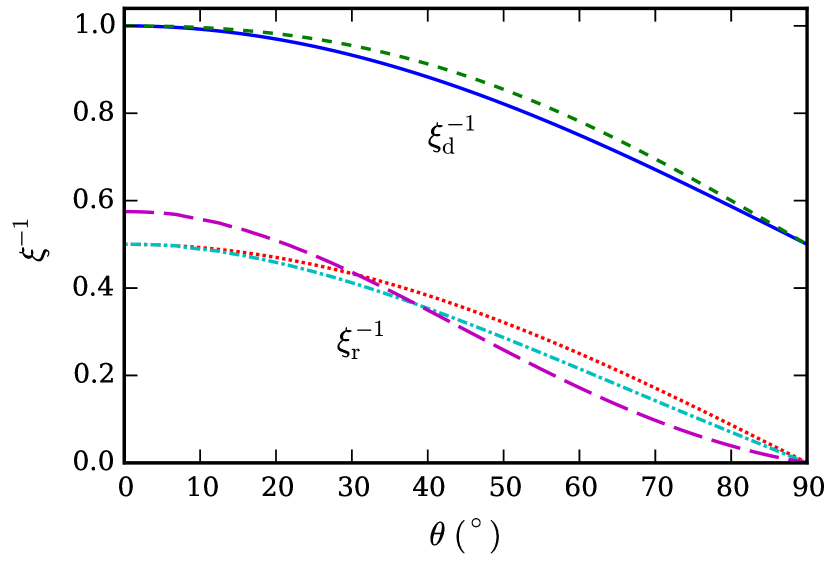
For a flat disk and Lambertian surfaces our numerical model closely reproduces the analytic result of Fujimoto (1988). We also consider the refinements to the model introduced by Lapidus & Sunyaev (1985): more realistic radiation distribution models by using a pure-electron-scattering atmosphere for the neutron star and an -function for emission from the disk, as well as blocking of part of the line of sight by a “shadow” of the star and disk. We compare the results of our model “a” from Figure 11 to their model 3 (Figure 2 in Lapidus & Sunyaev, 1985). Both models find the fraction of the burst luminosity that is intercepted by the disk to be , and at both find (Figure 11; is called in Lapidus & Sunyaev 1985). At lower inclinations, however, small differences are present. Our is up to smaller than the Lambertian case for , and larger at lower inclination, with for . This behavior is driven by the shadow blocking part of the burst flux for large , whereas electron scattering and the -function distribute the flux more to small compared to Lambertian surfaces (Figure 2). In constrast, Lapidus & Sunyaev (1985) find to be slightly larger than the Lambertian case for , and smaller at lower , with for . Lapidus & Sunyaev (1985) do not provide sufficient detail for us to explain the discrepancy, but it is likely related to differences in the implementations of blocking or the -function. Fujimoto (1988) noted that the results of Lapidus & Sunyaev (1985) lead to inconsistencies in mass-radius measurements, whereas our results are consistent (Section 4.3.2). The differences between the models are, however, smaller than the large changes in anisotropy that we are searching for.
4.2. Intrinsic Reflection Fraction for Concave Disks
We consider concave disks, where the height of the disk increases monotonically with radius. Standard -disk theory (Shakura & Sunyaev, 1973) predicts that for a typical viscosity parameter of , the slope of the height as a function of radius, , is small: . We consider much larger slopes ( for disk b and c in Figure 8) in order to investigate large deviations from a flat geometry. Such large deviations could potentially be induced by the irradiation of the disk by the X-ray burst (Ballantyne & Everett, 2005).
With the exception of shape b, where part of the stellar surface is covered by the disk, concave disks have substantially larger instrinsic reflection fractions. Whereas flat disks capture of the star’s luminosity, shape c intercepts as much as (slope of , see Figure 6). Shape d has values as large as shape c, but more of the star’s flux is intercepted at larger radii, due to the steepening of the height profile further away from the star (Figure 1).
4.2.1 Reflection Fractions for AGN
It is interesting to compare our results to those obtained for X-ray reflection from accreting black holes, including AGN (e.g., Fabian & Ross, 2010). In this case the disk is illuminated by a corona above the accretion disk. This can lead to reflection fractions as high as , as light emitted downwards is reflected upwards (Blackman, 1999). Furthermore, strong light bending near the inner radius of the disk causes a large fraction of the coronal emission to be intercepted and reflected by the disk: intrinsic reflection fractions as large as are predicted, depending on the height of the corona above the disk (Dauser et al., 2014). For accretion onto neutron stars, the gravitational potential at the inner disk is less strong, increasing by only (see also Lapidus & Sunyaev, 1985), and downward emission from the bottom of the star cannot be reflected upwards.
Fabian et al. (2002) suggest a disk geometry where the X-ray source is embedded in a ring structure. For all but very small inclination angles, the source is hidden from view, but reflection can still be observed. This is analogous to our situation of a neutron star embedded in a disk with a fast rising height (Figure 10).
Concave disks may change the shape of spectral features. For example, the prominent Fe K line around undergoes substantial Doppler broadening at the inner disk, whereas it remains narrow when originating from the outer disk. For a concave disk the contribution to the line from the outer disk is larger, resulting in a relatively small broad component (Hartnoll & Blackman, 2000). We have not considered the changes of reflection features in X-ray burst spectra. The present data with reflection of two superbursts prefer a broad line, but are of insufficient quality to separate broad and narrow components.
4.3. Observable Quantities
Because of substantial uncertainties in the distance to burst sources, the accretion composition, and the inclination angle, it is challenging to derive anisotropy factors from observations (e.g., Heger et al., 2007). Taking ratios of flux components has an advantage, because it removes the distance dependence. Fujimoto (1988) and Lapidus & Sunyaev (1985) compared their results with observed values of the -parameter. Because we consider the direct and reflected burst flux separately, we additionally discuss the observed reflection fraction.
4.3.1 Observed Reflection Fraction
Depending on the inclination angle, the observed reflection fraction can be substantially larger than . For shapes c and d, it can even be slightly larger than unity: the majority of the detected burst flux is reflected off the disk (Figure 8). Even larger reflection fractions of up to are only expected in case the disk height increases substantially at relatively small radii, such that part of the star is blocked from the line of sight (Figure 10).
X-ray reflection has only been detected during two events, both observed with the proportional counter array on the Rossi X-ray Timing Explorer: the 1999 superburst from 4U 1820–30 (Ballantyne & Strohmayer, 2004) and the 2001 superburst from 4U 1636–536 (Keek et al., 2014b). Around the time that the flux peaked, reflection fractions of and are observed, respectively. Whereas the former value can easily be accomodated with a flat disk, the latter value is slightly larger than the maximum value predicted for a flat geometry. In the tail of both superbursts, the reflection fraction is observed to increase substantially to and , respectively. Values this high can only be produced by concave disks with partial blocking of the star from the line of sight. This evolution of the reflection fraction suggests that the geometry of the disk changed from flat to concave under influence of intense irradiation by the superbursts. X-ray heating may cause the inner disk to puff up (Ballantyne & Everett, 2005), which would be consistent with a geometry that can hide part of the star from view. The burst flux and the reflection signal are, however, weaker in the tail. Keek et al. (2015) showed that for 4U 1636–536 an alternative interpretation of the spectra exists, where the reflection fraction is unchanged from the value at the peak. That interpretation, however, has issues as well. New observations with future instrumentation such as NICER are required to measure the evolution of the reflection fraction during bursts with greater confidence.
4.3.2 The -Parameter
The -parameter is the ratio of the persistent fluence between two subsequent bursts to the fluence in one burst. It is generally considered to be a measure of how much of the accreted hydrogen and helium burns in the burst vs. stably in between bursts. The material that is burned in a stable manner has only a small contribution to the persistent fluence, as the gravitational potential energy that is liberated by the accretion process is much larger than the energy gained from nuclear burning. Its effect is, however, noticable in the burst fluence, since only part of the accreted fuel is burned in the burst. Anisotropic emission, therefore, changes the observed -parameter from the intrinsic value by a factor (Fujimoto, 1988). To compare between sources with different inclination angles or with theoretical predictions, the observed values must be divided by this factor.
For flat Lambertian disks, the observed is larger than the intrinsic value by up to for small inclination angles (), and smaller for larger angles, as becomes vanishingly small for close to (Fujimoto, 1988). Our numerical model of a flat disk with blocking and improved radiation models exhibits stronger changes in : the observed value is larger by up to (Figure 12). The disk with shape b has similar deviations. For disks with shapes c and d, however, the observed is closer to the intrinsic value: for our choice of disk shapes, at the observed value is larger by at most . At large inclination angles the star and inner disk are blocked from the line-of-sight. This produces either very small or very large values of in the simulations, neither of which are observable in practice when both burst and persistent flux are almost fully blocked. The only exception is the case where the height of the inner disk increases fast (Figure 10), such that in a relatively large range of the view of the star is partially blocked. This situation increases the observed parameter by up to a factor (disk c with in Figure 12).
Heger et al. (2007) estimated the ratio of the persistent and burst anisotropy factors for GS 1826–24 by comparing numerical models to burst observations, and find . This value can be reproduced with any of the disk shapes that we consider. For disk shape a, this value is reached at , and for our disk shapes c and d, it is just reached at approximately where blocking of the star by the disk starts.
Considering a large sample of bursts from many sources, Galloway et al. (2008a) found only long bursts when , whereas short bursts occur with larger values of . For both groups of bursts, there is considerable spread in . Furthermore, in ’t Zand et al. (2003) compiled a list of values from various studies, and found that is substantially higher for superbursting sources than for bursting sources that lack superbursts, which could be explained by the substantial stable burning that may be required to produce the carbon fuel for superbursts. Part of the spread in may, therefore, be related to different accretion compositions or burning behavior, whereas another part will be due to differences in the anisotropy factors of the sources in the sample.
The parameter has been employed to measure the ratio of the neutron star radius and mass (Fujimoto, 1988). The main source of uncertainty is , which depends on the poorly constrained inclination angle. For two sources, the mass-radius constraints were calculated using from Fujimoto (1988) and Lapidus & Sunyaev (1985). The results are roughly consistent, except with Lapidus & Sunyaev (1985) for the high inclination source EXO 0748-676, which yielded an exceptionally large radius of . Using our values of for flat disk a (Figure 12) and all other parameters from Fujimoto (1988), we find neutron star parameters similar to Fujimoto (1988), which are consistent between large and small inclination angle ().
4.4. Applications of Anisotropies and Reflection
With the present observations, it is challenging to constrain the anisotropy factors. Nevertheless, anisotropy and reflection have important consequences for the interpretation of burst observations. We discuss several topics where they may play a role.
4.4.1 Distance and Mass-Radius Measurements
The peak flux of bursts with photospheric radius expansion (PRE) is employed as a measure of the Eddington limit, which is used for distance determination (e.g., Kuulkers et al., 2003) and to constrain the neutron star compactness (e.g., Özel, 2006; Galloway et al., 2008b). These measurements are all biased by , which is generally not taken into account. For example, different values of the Eddington limit have been observed for 4U 1636–536 (Galloway et al., 2006). It has been suggested to be due to different photospheric composition, but changing anisotropy factors may produce a similar effect if the disk geometry evolves with the persistent flux. Furthermore, the observed spread in the Eddington luminosity between different sources (Kuulkers et al., 2003) will in part be due to different anisotropies.
A different method to constrain the neutron star compactness uses detailed models of neutron star atmosphere spectra, parametrizing deviations from a blackbody as a color-correction factor (Suleimanov et al., 2011b). This method was found to work well when the persistent flux is low and in the hard state, but not at high flux in the soft state (Kajava et al., 2014). In the soft state the observed burst spectra generally do not follow the predicted evolution of the color correction, and the behavior of the normalization of the burst spectra is different from the hard state. Kajava et al. (2014) speculate that the accretion geometry is different in the two states. In the soft state, a spreading layer between the disk and the neutron star surface could reprocess a substantial part of the burst flux, modifying its spectrum. Alternatively, the different accretion geometry may produce an increased reflection fraction, such that reflection accounts for a larger part of the burst spectrum. As the reflection spectrum is reprocessed by the disk (Ballantyne, 2004), this may explain why it does not conform to the spectral evolution predicted for neutron star atmospheres.
4.4.2 Variability in Persistent and Burst Flux
If the accretion geometry evolves as a function of the persistent flux (e.g., Done & Gierliński, 2005), anisotropies may be different for bursts in different persistent states for a single source. Moreover, recently indications have been found that anisotropies may even evolve during a single X-ray burst.
Worpel et al. (2013) found that the observed persistent flux briefly increases during bursts, which they measure as a multiplicative factor, (see also in ’t Zand et al., 2013; Worpel et al., 2015). The anisotropy parameter has a similar effect on the observed flux as . Its variation for different shapes is, however, smaller than the observed factors (Figure 8). Therefore, it seems unlikely that is caused by an evolving . This is confirmed by the 2001 superburst from 4U 1636–536, where the observed increase in persistent emission was not directly correlated with the evolution of the reflection fraction (Keek et al., 2014a, b). Poynting-Robertson drag has been suggested to cause a temporary increase of the persistent flux (Worpel et al., 2013; Ballantyne & Everett, 2005). This would evacuate the inner disk, and potentially change the anisotropy factors during a burst.
In a small number of bursts with exceptionally large radius expansion (“superexpansion”), strong variability is observed in the tail of the light curve (in ’t Zand et al., 2011; Degenaar et al., 2013). The flux both exceeds and dips below the burst’s cooling trend, which has been explained as alternate blocking by and reflection off surrounding material. This could be an example of anisotropies from an accretion environment that is not symmetric with respect to the rotation axis of the disk.
5. Conclusions & Outlook
We have used numerical models to calculate the anisotropy of X-ray emission from LMXBs with neutron stars that produce Type I X-ray bursts. We separately present the anisotropy factors of the directly observed burst flux and the flux reflected off the accretion disk, as well as of the persistent flux. Our models account for different disk geometries, including concave disks. The latter produce observed reflection fractions much larger than unity, when part of the star is blocked from view by the disk. Such large reflection fractions have recently been inferred for the tail of two superbursts. A strongly concave disk, however, could completely block our view of bursts from high-inclination sources, but this is not the case for EXO 0748-676 (Parmar et al., 1986). The situation is likely complex, where the shape of the accretion disk may change between spectral states of the source, and even evolve during an X-ray burst. This complicates making quantitative predictions of the anisotropy factors for specific LMXBs or bursts. We discussed the qualitative effects of the anisotropies on observed quantities, including the reflection fraction and the -parameter.
Our models can be improved with a physics-based underpinning of the assumed accretion geometries, including a spreading layer and a gap between the neutron star and the inner disk. As multiple processes may be of importance during X-ray bursts (Ballantyne & Everett, 2005), detailed numerical models are required to accurately capture the behavior of accretion disks that are irradiated by bursts.
Important observational constraints on the anisotropy factors will be provided by new X-ray instrumentation, as NICER (scheduled for launch in 2016) and Athena (planned for launch in the late 2020s) will be able to measure reflection features during bright X-ray bursts (Wolf et al. 2016 in prep.). In the mean time, better measurements of the -parameter can be obtained by employing the Multi-Instrument Burst Archive (MINBAR; Keek et al., 2010). Furthermore, the anisotropy parameters depend strongly on the inclination angle, which is currently poorly constrained. Simultaneous X-ray and optical observations may improve this situation (e.g., Muñoz-Darias et al., 2008).
References
- Ballantyne (2004) Ballantyne, D. R. 2004, MNRAS, 351, 57
- Ballantyne & Everett (2005) Ballantyne, D. R., & Everett, J. E. 2005, ApJ, 626, 364
- Ballantyne & Strohmayer (2004) Ballantyne, D. R., & Strohmayer, T. E. 2004, ApJ, 602, L105
- Barcons et al. (2015) Barcons, X., Nandra, K., Barret, D., et al. 2015, Journal of Physics Conference Series, 610, 012008
- Belian et al. (1976) Belian, R. D., Conner, J. P., & Evans, W. D. 1976, ApJ, 206, L135
- Bhattacharyya et al. (2000) Bhattacharyya, S., Thampan, A. V., Misra, R., & Datta, B. 2000, ApJ, 542, 473
- Blackman (1999) Blackman, E. G. 1999, MNRAS, 306, L25
- Chandrasekhar (1960) Chandrasekhar, S. 1960, Radiative transfer
- Chenevez et al. (2015) Chenevez, J., Galloway, D. K., in ’t Zand, J. J. M., et al. 2015, ArXiv e-prints, arXiv:1509.01248
- Cornelisse et al. (2000) Cornelisse, R., Heise, J., Kuulkers, E., Verbunt, F., & in’t Zand, J. J. M. 2000, A&A, 357, L21
- Dauser et al. (2014) Dauser, T., García, J., Parker, M. L., Fabian, A. C., & Wilms, J. 2014, MNRAS, 444, L100
- Degenaar et al. (2013) Degenaar, N., Miller, J. M., Wijnands, R., Altamirano, D., & Fabian, A. C. 2013, ApJ, 767, L37
- Done & Gierliński (2005) Done, C., & Gierliński, M. 2005, Ap&SS, 300, 167
- Fabian et al. (2002) Fabian, A. C., Ballantyne, D. R., Merloni, A., et al. 2002, MNRAS, 331, L35
- Fabian & Ross (2010) Fabian, A. C., & Ross, R. R. 2010, Space Sci. Rev., 157, 167
- Frank et al. (2002) Frank, J., King, A., & Raine, D. J. 2002, Accretion Power in Astrophysics: Third Edition
- Frank et al. (1987) Frank, J., King, A. R., & Lasota, J.-P. 1987, A&A, 178, 137
- Fujimoto (1988) Fujimoto, M. Y. 1988, ApJ, 324, 995
- Galloway et al. (2008a) Galloway, D. K., Muno, M. P., Hartman, J. M., Psaltis, D., & Chakrabarty, D. 2008a, ApJS, 179, 360
- Galloway et al. (2008b) Galloway, D. K., Özel, F., & Psaltis, D. 2008b, MNRAS, 387, 268
- Galloway et al. (2006) Galloway, D. K., Psaltis, D., Muno, M. P., & Chakrabarty, D. 2006, ApJ, 639, 1033
- Gendreau et al. (2012) Gendreau, K. C., Arzoumanian, Z., & Okajima, T. 2012, in Society of Photo-Optical Instrumentation Engineers (SPIE) Conference Series, Vol. 8443
- Grindlay et al. (1976) Grindlay, J., Gursky, H., Schnopper, H., et al. 1976, ApJ, 205, L127
- Hartnoll & Blackman (2000) Hartnoll, S. A., & Blackman, E. G. 2000, MNRAS, 317, 880
- Heger et al. (2007) Heger, A., Cumming, A., Galloway, D. K., & Woosley, S. E. 2007, ApJ, 671, L141
- Hoyng (2006) Hoyng, P. 2006, Relativistic astrophysics and cosmology : a primer
- in ’t Zand et al. (2011) in ’t Zand, J. J. M., Galloway, D. K., & Ballantyne, D. R. 2011, A&A, 525, A111
- in ’t Zand et al. (2003) in ’t Zand, J. J. M., Kuulkers, E., Verbunt, F., Heise, J., & Cornelisse, R. 2003, A&A, 411, L487
- in ’t Zand et al. (2013) in ’t Zand, J. J. M., Galloway, D. K., Marshall, H. L., et al. 2013, A&A, 553, A83
- Ji et al. (2014) Ji, L., Zhang, S., Chen, Y., et al. 2014, ApJ, 782, 40
- Kajava et al. (2014) Kajava, J. J. E., Nättilä, J., Latvala, O.-M., et al. 2014, MNRAS, 445, 4218
- Keek et al. (2014a) Keek, L., Ballantyne, D. R., Kuulkers, E., & Strohmayer, T. E. 2014a, ApJ, 789, 121
- Keek et al. (2014b) —. 2014b, ApJ, 797, L23
- Keek et al. (2015) Keek, L., Cumming, A., Wolf, Z., et al. 2015, MNRAS, 454, 3559
- Keek et al. (2010) Keek, L., Galloway, D. K., in ’t Zand, J. J. M., & Heger, A. 2010, ApJ, 718, 292
- Keek & in ’t Zand (2008) Keek, L., & in ’t Zand, J. J. M. 2008, in Proceedings of the 7th INTEGRAL Workshop. 8 - 11 September 2008 Copenhagen, Denmark. Online at http://pos.sissa.it/cgi-bin/reader/conf.cgi?confid=67, p.32
- King et al. (2007) King, A. R., Pringle, J. E., & Livio, M. 2007, MNRAS, 376, 1740
- King & Ritter (1998) King, A. R., & Ritter, H. 1998, MNRAS, 293, L42
- Kuulkers (2004) Kuulkers, E. 2004, Nuclear Physics B Proceedings Supplements, 132, 466
- Kuulkers et al. (2003) Kuulkers, E., den Hartog, P. R., in ’t Zand, J. J. M., et al. 2003, A&A, 399, 663
- Kuulkers et al. (2002) Kuulkers, E., Homan, J., van der Klis, M., Lewin, W. H. G., & Méndez, M. 2002, A&A, 382, 947
- Lamb & Lamb (1978) Lamb, D. Q., & Lamb, F. K. 1978, ApJ, 220, 291
- Lapidus & Sunyaev (1985) Lapidus, I. I., & Sunyaev, R. A. 1985, MNRAS, 217, 291
- Lewin et al. (1993) Lewin, W. H. G., van Paradijs, J., & Taam, R. E. 1993, Space Science Reviews, 62, 223
- Maraschi & Cavaliere (1977) Maraschi, L., & Cavaliere, A. 1977, in Highlights in Astronomy, ed. E. A. Müller, Vol. 4 (Reidel, Dordrecht), 127
- Muñoz-Darias et al. (2008) Muñoz-Darias, T., Martínez-Pais, I. G., Casares, J., et al. 2008, in American Institute of Physics Conference Series, Vol. 984, High Time Resolution Astrophysics: The Universe at Sub-Second Timescales, ed. D. Phelan, O. Ryan, & A. Shearer, 15–22
- Özel (2006) Özel, F. 2006, Nature, 441, 1115
- Parmar et al. (1986) Parmar, A. N., White, N. E., Giommi, P., & Gottwald, M. 1986, ApJ, 308, 199
- Revnivtsev et al. (2001) Revnivtsev, M., Churazov, E., Gilfanov, M., & Sunyaev, R. 2001, A&A, 372, 138
- Schatz & Rehm (2006) Schatz, H., & Rehm, K. E. 2006, Nuclear Physics A, 777, 601
- Shakura & Sunyaev (1973) Shakura, N. I., & Sunyaev, R. A. 1973, A&A, 24, 337
- Strohmayer & Brown (2002) Strohmayer, T. E., & Brown, E. F. 2002, ApJ, 566, 1045
- Suleimanov et al. (2011a) Suleimanov, V., Poutanen, J., Revnivtsev, M., & Werner, K. 2011a, ApJ, 742, 122
- Suleimanov et al. (2011b) Suleimanov, V., Poutanen, J., & Werner, K. 2011b, A&A, 527, A139+
- Swank et al. (1977) Swank, J. H., Becker, R. H., Boldt, E. A., et al. 1977, ApJ, 212, L73
- Tauris & van den Heuvel (2006) Tauris, T. M., & van den Heuvel, E. P. J. 2006, Formation and evolution of compact stellar X-ray sources, ed. W. H. G. Lewin & M. van der Klis, 623–665
- van Paradijs (1996) van Paradijs, J. 1996, ApJ, 464, L139
- Woosley & Taam (1976) Woosley, S. E., & Taam, R. E. 1976, Nature, 263, 101
- Worpel et al. (2013) Worpel, H., Galloway, D. K., & Price, D. J. 2013, ApJ, 772, 94
- Worpel et al. (2015) —. 2015, ApJ, 801, 60
Appendix A Reflection Fraction of a Disk with Finite Outer Radius
In Section 2.2, we have computed analytically the intrinsic reflection fraction, , of a disk with infinite outer radius. Here we compute of a disk with an outer radius of , where is the stellar radius.
We use the same coordinate systems and parameter definitions as in Section 2.2 (Figure 3). as a function of is given by
| (A1) |
where is the azimuthal angle in the coordinate system of the point on the disk edge that points to (Figure 3). Since , Equation (A1) implies
| (A2) |
where
| (A3) |
Substituting Equation (A3) into Equation (A1), we find
| (A4) |
Combining Equation (A2) and Equation (A3), we obtain the range of
| (A5) |
Similarly, we can establish from Equation (A2) that
| (A6) |
For one element on the stellar surface with polar angle , the reflection fraction is given by
| (A7) | |||||
So the total intrinsic reflection fraction is
| (A8) | |||||
We compute for several values of (Table 1).
| 4 | 40 | 400 | 4000 | ||
|---|---|---|---|---|---|
| 0.1978386 | 0.2446961 | 0.2494695 | 0.2499469 | 0.25 |
† The outer radius of the disk is