The network structure of city-firm relations \authoralternativeA. Garas, C. Rozenblat & F. Schweitzer
The network structure of city-firm relations
Abstract
How are economic activities linked to geographic locations? To answer this question, we use a data-driven approach that builds on the information about location, ownership and economic activities of the world’s 3,000 largest firms and their almost one million subsidiaries. From this information we generate a bipartite network of cities linked to economic activities. Analysing the structure of this network, we find striking similarities with nested networks observed in ecology, where links represent mutualistic interactions between species. This motivates us to apply ecological indicators to identify the unbalanced deployment of economic activities. Such deployment can lead to an over-representation of specific economic sectors in a given city, and poses a significant thread for the city’s future especially in times when the over-represented activities face economic uncertainties. If we compare our analysis with external rankings about the quality of life in a city, we find that the nested structure of the city-firm network also reflects such information about the quality of life, which can usually be assessed only via dedicated survey-based indicators.
1 Introduction
The set of goods and services produced in a city depend on a complex interplay of factors that include institutions, taxes, skilled personnel, industrial heritage or the presence of particular resources. Dependent on the availability of such factors, some cities have specialized in certain economic activities while others became economically more diversified. Specialization comes with a benefit as it allows for economic multiplier effects through “agglomeration economies” [17, 13, 15]. This, however, can turn into a drawback if a particular economic activity goes into recession. Then, cities specialized in this activity will be distressed more than the economically diversified ones. To exacerbate the problem, in a globalized world the economic performance of a city increasingly depends on the economic performance of other cities. Such economic dependencies emerge even between cities that are very far away in terms of geographical distance, which due to global economic linkages are in reality proximal in economic terms [21].
This leaves us with the problem to quantify such dependencies and to link them to the diversification of economic activities in cities. In this paper, we identify a city’s economic activities by monitoring the firms with global presence operating in this particular city. This way we can create a network that links cities and firms, and if we focus on the economic activities of each firm, we can extend this network by linking cities to economic activities. Networks that describe relation between different sets of nodes, in our case cities and economic activities, are called bipartite networks (or bipartite graphs) [7]. The bipartite network we construct to link every city with the economic activities of firms with global presence will allow us to study how specialized or diversified each city is with respect to a global context.
Analyzing the structure of this bipartite network reveals striking similarities with other types of bipartite networks found in ecology. There, nodes represent species and links their interactions. In so-called antagonistic networks, the interaction between species is asymmetric, such as host–parasite, predator–prey and plant–herbivore interactions. In so-called mutualistic networks, on the other hand, the interaction between species is symmetric, i.e. both species interact in a mutually beneficial way like, for example, plants interact with their pollinators. Networks with antagonistic and mutualistic interactions have long been studied in ecology, to show that the stability of ecological communities is linked to structural features of the network topology [3, 25, 19]. More precisely, it was shown that mutualistic networks are organized in a nested pattern, while antagonistic networks are organized in compartments [25]. A nested organization means that the network consists of sets of generalist nodes and sets of specialist nodes. The specialists interact only with a small subset of nodes, while the generalists interact with (almost) all other nodes in the network. In nested ecosystems the large set of interactions between generalists (i.e. species that interact with many other species) creates a dense core to which the specialists (i.e. species that interact with few other species) are attached. It was shown that the (empirically observed [2]) nested structure of mutualistic networks reduces the inter-species competition, which as a consequence allows ecosystems to support more species and increase biodiversity [3].
Thus, it would be of great interest to see whether such nested structures can be also found in bipartite networks related to economics. A recent study [11, 23] has investigated the bipartite network between firms and countries, to relate it to economic stability. It was found that robust countries have, indeed, a wide range of diversification in their economic activities. Based on this economic complexity performance measures for countries were proposed. Specifically, it was shown that the dynamics of the nested structure of industrial ecosystems can predict path dependencies in the way industries appear and disappear in given countries. This helped to explain the evolution of the set of products that are produced and exported by these countries [20, 6]. A different analysis, focused in the New York garment industry, has shown that a firm’s survival probability depends on the firm’s position in the nested network of interactions between designer and contractor firms [20].
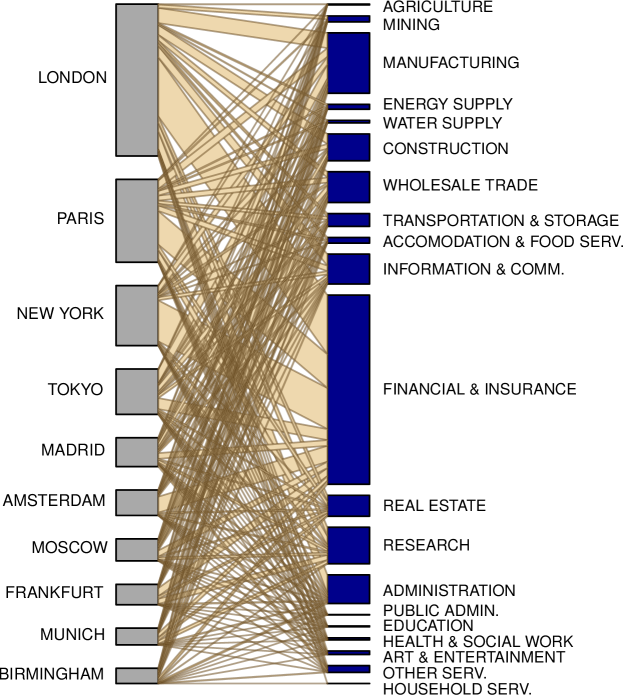
In this work, however, we are interested in the bipartite network between cities and economic activities of globalized firms. These interactions are mutualistic because cities benefit from firms through taxes, employment etc, while firms benefit from cities through access to infrastructure, resources, customer base, skilled personnel etc. To build our bipartite network of city-economic activity relations (an extract of which is shown in Fig. 1), we use data about firms with global presence. For these firms we know the precise locations of the headquarters and all their subsidiaries and, using the standard Nomenclature of Economic Activities (NACE), we classify their core business to an economic sector (for details see Data and Methods). Next, we study the structure of this network, and we show that it follows a nested assembly, similar to ecological mutualistic networks. Therefore, building upon previous works in the field of ecology and their follow-ups with respect to economic networks, we apply ecological indicators to identify the unbalanced deployment of economic activities, and we provide evidence that the structure of this bipartite network of city-firm relations contains information about the quality of life in cities.
2 Data and Methods
For our analysis we use data about the 3,000 largest firms with global presence and their 1 million direct and indirect links to 800,000 subsidiaries extracted from the BvD orbis database of 2010 [5]. The firm locations were aggregated using the concept of Functional Urban Areas (FUA) which was developed by the European Spatial Planning Organization Network (ESPON) [8]. FUA’s allow to agglomerate municipalities according to their functional orientation – sometimes going beyond administrative boundaries – and reflect the actual operational conditions of people, enterprises, and communities. Therefore FUA agglomerations result in an efficient mapping of the economic activity and service production. In addition, we classified the firms to economic sectors according to their core business, using the Nomenclature of Economic Activities (NACE) provided by eurostat [9]. These sectors were further aggregated following the United Nation’s International Standard Industrial Classification of All Economic Activities (ISIC REV.4) methodology, which results to an aggregation of activities into 21 different sections. Pairing the geographic location given by the FUA, with the NACE-ISIC classification of every individual firm, we create a bipartite network of interactions between 1,169 cities and 21 economic activities. An example of this network for the 10 cities with the largest number of firms is shown in Fig. 1.
Our bipartite network is represented by an incidence matrix pairing each of the 21 economic activities to each of the 1,169 cities where this activity is present (see Fig. 2). Therefore, each matrix element has value one if the economic activity is present in the city and zero otherwise.
To calculate the nestedness value of this matrix, we used the NODF algorithm developed by Almeida-Neto et al. [1]. This algorithm returns a nestedness value in the range [0, 100], with when there is no nestedness and for the case of perfect nestedness. To assess the significance of nestedness we have to compare our measured value with a benchmark null model. In this paper, our model of choice is the null model introduced by Bascompte et al. [2], which creates randomized networks by preserving the degree distribution of the original network. This model generates ensembles of swapped matrices with the probability of each matrix cell to be occupied is the average of the probabilities of occupancy of its row and column. Practically, this means that the probability of drawing an interaction is proportional to the level of generalization (degree) of both the city and the economic activity, i.e. , where is the degree of the city and the degree of the activity in the bipartite network, while and are the number of available activities and cities respectively.
To measure the contribution of each individual city to the nestedness value of the whole network, we follow the methodology of Saavedra et al. [20]. More precisely, we calculate ; were is the observed nestedness of the whole network, and are the average and standard deviation of the nestedness across an ensemble of 100 random replicates for which all the links of city to economic activities have been randomized. The number of random replicates is chosen in order to provide optimal performance, while at the same time the individual contribution to nestedness of each city has converged significantly to their asymptotic value. More precisely, we performed a convergence analysis for which we calculated the Spearman’s correlation coefficient between two consecutive rankings of cities according to their nestedness contribution with increasing number of replicates. From this analysis we a) observed that the rankings indeed converge to a saturation level and b) we concluded that 100 random replicates are enough as is already almost 0.99.
3 Results
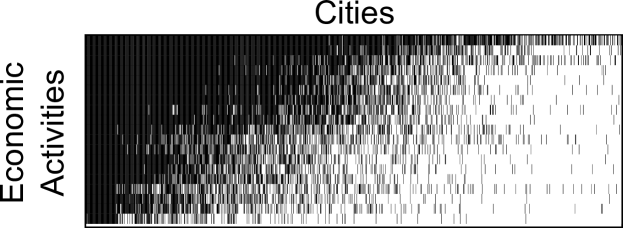
Using the methodology described above, we find that the bipartite network of cities-economic activities is nested (see Fig. 2), with a nestedness value (). This already highlights structural similarities in the interaction patterns that occur in a natural ecological system and in the human made economic system. And since a nested network structure is known to promote community stability in mutualistic ecological networks [25], we anticipate that the mutualistic network of cities and economic activities would be stable as well.
But, as it was shown recently both for ecological and socio-economic networks, nestedness comes with a price [20]. The nodes that contribute more to the nestedness of the network are the nodes that contribute more to the network persistence. However, these same nodes were identified as the most vulnerable to go extinct. Of course in our case a city may not go extinct, but it may decline to a less prosperous state.
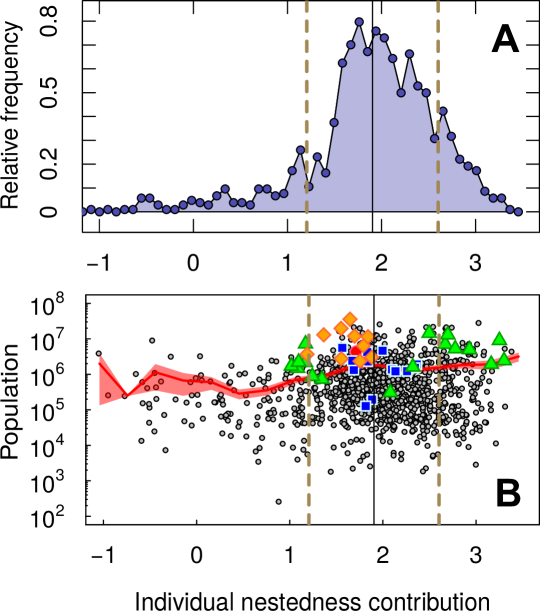
As shown in Fig. 3A, the distribution of the individual contribution to nestedness is concentrated around the mean value . Therefore, it is an important question whether this nestedness value has any relation to a city’s economic performance. If it does so, then where are the best performing cities located in this distribution? close to the center or close to its tail?
Unfortunately, we do not have access to data about economic performance for individual cities. However, we do expect economic performance to be strongly correlated with the well being of a city’s inhabitants. In this sense, using the rankings provided by the Economist Intelligence Unit’s (EIU) 2013 “Global Liveability Ranking and Report” [24] and the Mercer “2012 Quality of Living worldwide city rankings” [16], we calculated the nestedness contribution of the top-10/bottom-10 performing cities. We found that all of the top cities of the above rankings are within the range of , while 70% of the bottom cities are outside this range. More precisely, 41% of them are above , and 39% below . From Mercer’s bottom-10 list the cities above are Abidjan, Khartoum, Kinshasa, Conakry, while from EIU’s list Karachi, Algiers, Douala are in this range. In the area below from Mercer’s bottom-10 list we find Tbilissi, Sanaa, Baghdad, and from EIU’s list Damascus and Tripoli. This discussion shows that a ranking based on the nestedness score gives insightful results, where the better performing cities, according to Mercer and Economist [16, 24] are closer to the mean of the nestedness distribution, while the worst performing ones are further away (Fig. 3B).
Given the general tendency of cities to grow, it is natural to ask if there is any measurable impact of population to the nestedness score. It is known already that a city’s population drives many diverse properties of cities [4]. Are smaller cities more stable or more vulnerable according to the way stability/vulnerability is reflected through nestedness? To answer this question we collected data about city population, by consolidating information based on the UN database on cities111http://data.un.org, the OECD database on cities222https://stats.oecd.org/Index.aspx?DataSetCode=CITIES, and the ESPON project [8]. As shown in Fig. 3B, there is no pronounced relation between the (logarithm of) population and the individual nestedness. The Pearson correlation coefficient () is small and not significant, and the same holds true for the Spearman correlation (). Of course, if a city performs well and increases its inhabitants’ well being, it may become the target of internal or external migration flows and eventually increase its population. However, its network position –as measured with respect to nestedness– does not seem to be influenced by the population.
We can of course anticipate that if a city is specialized in an economic activity, it will prosper as long as the activity fares well. If this activity is hit by turmoil, or just under-performs with respect to other activities, this may lead to a decline of the city. To avoid such risks, diversification of activities is required; but how much diversification is enough? And even if a city has indeed diversified its activities, how does this diversification compare to other cities? It is expected that large cities are able to attract many firms, that would populate multiple economic sectors of activity [18]. This means that large cities are by definition “generalists” in the bipartite graph, and this introduces a bias in our interpretation of the nestedness score.
To be more specific, let us consider the case of Detroit with nestedness score , which places it near the mean of the nestedness distribution. Based on this number alone we would argue that Detroit performs well and we would not anticipate its bankruptcy on July 18, 2013. Therefore, it is not enough to only ensure that multiple economic sectors are populated, but, it is important to monitor how many firms populate each sector. If the distribution of firms in economic sectors is skewed, one or few sectors will be dominating. So, a major decline in the dominating sector will have a major impact on the city’s economy, and this will indirectly affect all the other sectors, as well.
In addition, this effect will be even more pronounced in the presence of hidden links between firms from different sectors. I.e. it is not hard to imagine that many service related smaller firms (e.g. subcontractors or advance production services) shall provide support and will be dependent to the function of the large firms of the dominant economic sector. Therefore, the decline of this sector will create a cascading effect that is very hard to be properly evaluated in the absence of detailed dependency data.
In the example at hand, from the 4,455 total large firms that were active in Detroit, 2,299 belonged to the manufacturing sector. The second most populated sector was Financial & Insurance with 642 firms. We expect that many of these firms have strong ties to the manufacturing companies, and shall be affected if something will go wrong in the manufacturing sector. However, since we cannot document these ties, for simplicity we will assume that all sectors are independent.
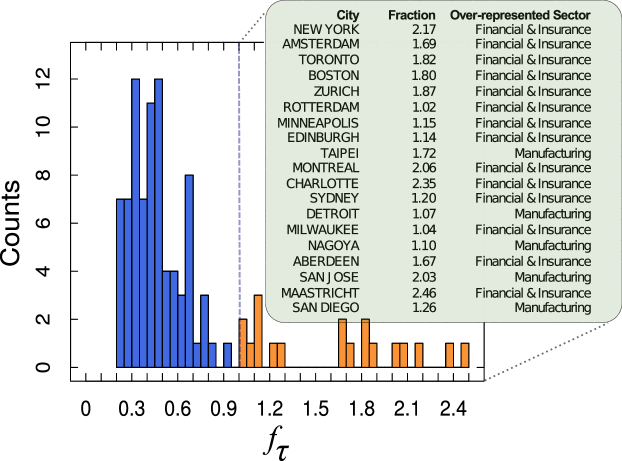
Hence, to detect when one sector is over-represented in the overall economic activity we calculate the fraction , i.e. the number of firms in the largest sector over the number of firms in all other sectors. If it would mean that the city is well diversified across activities, while if a particular sector is dominating the economy, and the city might be at risk. For our dataset, and under the assumption of sectoral independence, for the case of Detroit, which indicates the city’s vulnerability.
Provided the availability of more refined data, we could improve the calculation by dividing the number of firms of all sectors that are significantly affected by a decline in the largest sector by the number of firms that will not be affected by this decline. However, such calculation cannot be performed with our currently available datasets.
We would like to contrast our measure with other existing indexes for diversity. A well known index in Ecology to quantify the biodiversity of a habitat is the Simpson’s index [22]. It is also known as Herfindahl-Hirschman index in economics, where it is used to measure market concentration [12, 10]. We calculated the Simpson’s index for all cities in our database, and we found that the resulting concentration ranking is strongly correlated (Spearman’s ()) with the ranking based on . But most available indexes including the Simpson’s index do not allow to easily identify a threshold value that discriminates well diversified cities from not well diversified cities. This, however, can be achieved by the value in our case.
There is a limitation when applying our index to extremely specialized cities, as it diverges in cases where (mostly due to data limitations) only one economic sector is present. These cases are identified by the Simpson’s index as extremely specialized cities, as well, and are assigned a zero value. It is, therefore, better practice to exclude such pathological cases from our analysis. For this reason we restricted our calculation of to the 100 cities with the largest number of firms in our database 333We calculated the Simpson’s index for the set of 100 cities with the largest number of firms in our database, and again we found that the resulting concentration ranking is strongly correlated (Spearman’s ()) with the ranking based on ..
As shown in Fig. 4, most of the cities have a smaller than one, which is evidence of a balanced development. However, there are some cities with values not only larger than one, but even larger than the value of Detroit. As it happens most of these cities, which include New York, Amsterdam, Zurich etc. are large financial centers, which highlights the fragility of an economic model that is largely dependent on financial services. The recent financial crises rang some bells, and now policy makers in developed countries try to mitigate this dependency by re-shoring the manufacturing sector. A profound example is EU strategy, which aims to get almost 20% of semiconductor manufacturing back to Europe by 2020 through an unprecedented public/private investment partnership444http://www.semi.org/eu/node/8506.
4 Conclusion
In summary, by exploiting functional similarities across complex systems, we can use indicators developed in ecology to assess the performance of a city in the globalized economy. With these indicators we go beyond the mere evaluation of the economic specialization of cities [14], as we associate specialization of one city to the vulnerability of the whole “ecosystem” describing city - economic activities relations, similar to the way extinction of one species affects the stability of natural ecosystems. It is shown that such indicators have the potential to identify the need for new multilevel policies, able to regulate the cities at the national or continental level (like within EU), in order to enhance their position in the bipartite network of city - economic activities relations.
However, there is also a need for closer supervision to prevent over-representation of some economic activities at the expense of others, as this increases the risk in the future. In this respect, policy interventions that reduce the dominance of one sector over the others should be applied more frequently. Currently, the financial sector is strongly over-represented in most of the large cities of the developed countries, hence, policies like the EU strategy are important as hedging against future risks.
Acknowledgment
The authors acknowledge financial support from the EU-FET project MULTIPLEX 317532. We thank Antoine Bellwald and Faraz Ahmed Zaidi for cleaning and aggregating the data. For our analysis we used the R software for statistical analysis v3.0.2, and the bipartite library v2.02.
References
- Almeida-Neto et al. [2008] Almeida-Neto, M.; Guimarães, P.; Guimarães, P. R.; Loyola, R. D.; Ulrich, W. (2008). A consistent metric for nestedness analysis in ecological systems: reconciling concept and measurement. Oikos 117(8), 1227–1239.
- Bascompte et al. [2003] Bascompte, J.; Jordano, P.; Melián, C. J.; Olesen, J. M. (2003). The nested assembly of plant-animal mutualistic networks. Proceedings of the National Academy of Sciences of the United States of America 100(16), 9383–7.
- Bastolla et al. [2009] Bastolla, U.; Fortuna, M. A.; Garcia, A. P.; Ferrera, A.; Luque, B.; Bascompte, J. (2009). The architecture of mutualistic networks minimizes competition and increases biodiversity. Nature 458, 1018–1020.
- Bettencourt et al. [2007] Bettencourt, L. M.; Lobo, J.; Helbing, D.; Kühnert, C.; West, G. B. (2007). Growth, innovation, scaling, and the pace of life in cities. Proceedings of the national academy of sciences 104(17), 7301–7306.
- Bureau van Dijk Electronic Publishing (2010) [BvDEP] Bureau van Dijk Electronic Publishing (BvDEP) (2010). orbis database. http://www.bvdep.com/.
- Bustos et al. [2012] Bustos, S.; Gomez, C.; Hausmann, R.; Hidalgo, C. A. (2012). The Dynamics of Nestedness Predicts the Evolution of Industrial Ecosystems. PLoS One 7(11), e49393.
- Diestel [2000] Diestel, R. (2000). Graph theory graduate texts in mathematics; 173. Springer-Verlag Berlin and Heidelberg GmbH & amp.
- ESPON [2010] ESPON (2010). FOCI - Future Orientation for Cities (Report). http://www.espon.eu/main/.
- Eurostat [2008] Eurostat (2008). NACE rev2. http://epp.eurostat.ec.europa.eu/portal/page/portal/nace_rev2/introduction.
- Herfindahl [1950] Herfindahl, O. C. (1950). Concentration in the US steel industry. unpublished doctoral dissertation, Columbia University .
- Hidalgo and Hausmann [2009] Hidalgo, C. A.; Hausmann, R. (2009). The building blocks of economic complexity. Proceedings of the National Academy of Sciences 106(26), 10570–10575.
- Hirschman [1980] Hirschman, A. O. (1980). National power and the structure of foreign trade, vol. 105. Univ of California Press.
- Hoover [1948] Hoover, E. M. (1948). The location of economic activity. Mcgraw-Hill Book Company, Inc; London.
- Isard [1956] Isard, W. (1956). Localization and space economy: A general theory relating to industrial location, market areas, land use, trade and urban structure.
- Krugman [1993] Krugman, P. (1993). First nature, second nature, and metropolitan location. Journal of regional science 33(2), 129–144.
- Mercer [2012] Mercer (2012). Quality of Living worldwide city rankings. http://www.mercer.com/press-releases/quality-of-living-report-2012.
- Ohlin [1933] Ohlin, B. G. (1933). Interregional and international trade. Harvard University Press.
- Pumain et al. [2006] Pumain, D.; Paulus, F.; Vacchiani-Marcuzzo, C.; Lobo, J. (2006). An evolutionary theory for interpreting urban scaling laws. Cybergeo: European Journal of Geography .
- Rohr et al. [2014] Rohr, R. P.; Saavedra, S.; Bascompte, J. (2014). On the structural stability of mutualistic systems. Science 345(6195), 1253497.
- Saavedra et al. [2011] Saavedra, S.; Stouffer, D. B.; Uzzi, B.; Bascompte, J. (2011). Strong contributors to network persistence are the most vulnerable to extinction. Nature 478(7368), 233–5.
- Scholl et al. [2015] Scholl, T.; Garas, A.; Schweitzer, F. (2015). The spatial component of R&D networks. arXiv preprint arXiv:1509.08291 .
- Simpson [1949] Simpson, E. H. (1949). Measurement of diversity. Nature .
- Tacchella et al. [2012] Tacchella, A.; Cristelli, M.; Caldarelli, G.; Gabrielli, A.; Pietronero, L. (2012). A new metrics for countries’ fitness and products’ complexity. Scientific reports 2.
- The Economist Intelligence Unit’s (2013) [EIU] The Economist Intelligence Unit’s (EIU) (2013). Global Liveability Ranking and Report. https://www.eiu.com/public/topical_report.aspx?campaignid=Liveability2013.
- Thébault and Fontaine [2010] Thébault, E.; Fontaine, C. (2010). Stability of ecological communities and the architecture of mutualistic and trophic networks. Science (New York, N.Y.) 329(5993), 853–6.