The XMM Cluster Survey: evolution of the velocity dispersion – temperature relation over half a Hubble time
Abstract
We measure the evolution of the velocity dispersion–temperature (–) relation up to using a sample of 38 galaxy clusters drawn from the XMM Cluster Survey. This work improves upon previous studies by the use of a homogeneous cluster sample and in terms of the number of high redshift clusters included. We present here new redshift and velocity dispersion measurements for 12 clusters observed with the GMOS instruments on the Gemini telescopes. Using an orthogonal regression method, we find that the slope of the relation is steeper than that expected if clusters were self-similar, and that the evolution of the normalisation is slightly negative, but not significantly different from zero (). We verify our results by applying our methods to cosmological hydrodynamical simulations. The lack of evolution seen in our data is consistent with simulations that include both feedback and radiative cooling.
keywords:
galaxies: clusters: general, galaxies: clusters: intracluster medium, galaxies: distances and redshifts, X-rays: galaxies: clusters, cosmology: miscellaneous1 Introduction
Clusters of galaxies are the largest coherent gravitationally bound objects in our Universe. By studying galaxy clusters, information can be gained about the formation of galaxies, and the effect of ongoing processes such as merging and AGN feedback. They can also be used as a probe of cosmology by studying the evolution of their number density with mass and redshift (e.g., Vikhlinin et al., 2009; Hasselfield et al., 2013; Reichardt et al., 2013; Planck Collaboration et al., 2015). However, the mass of galaxy clusters is not a quantity that can be directly measured, and therefore it needs to be determined using observable mass tracers such as X-ray properties (e.g., luminosity and temperature), the Sunyaev-Zel’dovich (SZ) effect signal, and optical properties, such as richness, line-of-sight velocity dispersion of member galaxies, and shear due to gravitational lensing (e.g., Ortiz-Gil et al., 2004; Vikhlinin et al., 2006; Rozo et al., 2009; Sifón et al., 2013; Nastasi et al., 2014; von der Linden et al., 2014; Hoekstra et al., 2015).
Scaling relations are power laws between galaxy cluster properties that have the potential to allow us to measure the mass of clusters using easily observable properties such as the X-ray Luminosity, X-ray Temperature and the velocity dispersion. These power laws can be predicted if we assume clusters are formed in the manner described by Kaiser (1986). In this model, known as the self-similar model, all galaxy clusters and groups are essentially identical objects which have been scaled up or down (Maughan et al., 2012). Strong self-similarity refers to when galaxy clusters have been scaled by mass and weak self-similarity refers to a scaling due to the changing density of the Universe with redshift (Bower, 1997). This model makes some key assumptions, as described by Kravtsov & Borgani (2012) and Maughan et al. (2012). The first assumption is that we are in an Einstein-de-Sitter Universe, , so the clusters form via a single gravitational collapse at the observed redshift. Secondly, gravitational energy as a result of the collapse is the only source of energy to the intracluster medium (ICM). By introducing these assumptions we greatly simplify the problem so that properties of the density field depend on only two control parameters, the slope of the power spectrum of the initial perturbations and its normalisation. The strong self-similarity determines the slope and is not expected to evolve with redshift while the weak self-similarity is responsible for the evolution of the normalisation since in this simplified model it is due only to a change in density with redshift (Bryan & Norman, 1998).
The most commonly studied scaling relation is the luminosity – temperature relation (), however there is still no consensus on how it evolves with redshift and if self-similarity holds. Some studies have found that the evolution of the normalisation of this relation is consistent with self-similarity (e.g., Vikhlinin et al., 2002; Lumb et al., 2004; Maughan et al., 2006), while other studies have found zero or negative evolution (e.g., Ettori et al., 2004; Branchesi et al., 2007; Hilton et al., 2012; Clerc et al., 2012, 2014). Maughan et al. (2012) also found that the evolution of the relation was not self-similar, but concluded that this could plausibly be explained by selection effects.
In this paper we focus on the lesser studied relationship between the velocity dispersion of member galaxies () and the X-ray temperature () of the ICM. Since the velocity dispersion is a measure of the kinetic energy of the galaxies in the cluster, and temperature is related to the kinetic energy of the gas, both the gas and galaxies are tracers of the gravitational potential. One would expect a self-similar relationship of the form , if clusters were formed purely due to the action of gravity (Quintana & Melnick, 1982; Kaiser, 1986; Voit, 2005). However, almost all previous studies of the relation have found a steeper power-law slope than this (see Table 1). The relation is also not expected to evolve with redshift. To date this has been tested only by Wu et al. (1998) and Nastasi et al. (2014). Even then, all but four clusters in the Wu et al. (1998) sample are at . Nastasi et al. (2014) made a measurement of the relation at using a sample of 12 clusters, obtaining results consistent with previous studies at low redshift.
One may expect evolution in cluster scaling relations due to the increase of star formation and AGN activity at high redshift (e.g., Silverman et al., 2005; Magnelli et al., 2009), or due to the increase in frequency of galaxy cluster mergers with increasing redshift (e.g., Cohn & White, 2005; Kay et al., 2007; Mann & Ebeling, 2012). Galaxy cluster mergers are among the most energetic events in the Universe, and simulations have shown that these could result in the boosting of cluster X-ray temperatures(e.g., Ritchie & Thomas, 2002; Randall et al., 2002; Poole et al., 2007). Figure 9 in Ritchie & Thomas (2002) shows how the temperature is boosted when two equal mass systems have a head on collision with varying initial distances between their centres. All of these processes add energy into the ICM, and so we might expect to see an overall increase in the average temperatures of galaxy clusters above that expected from the self-similar case at a given redshift.
| Paper | Number of clusters | Redshift range | Fitting method | ||
|---|---|---|---|---|---|
| Edge & Stewart (1991) | 23 | 2.60 0.08 | 0.46 0.12 | Least squares | |
| Lubin & Bahcall (1993) | 41 | 2.52 0.07 | 0.60 0.11 | ||
| Bird et al. (1995) | 22 | 2.50 0.09 | 0.61 0.13 | Bisector | |
| Girardi et al. (1996) | 37 | 2.53 0.04 | 0.61 0.05 | Bisector | |
| Ponman et al. (1996) | 27 | 2.54 0.04 | 0.55 0.05 | Bisector | |
| White et al. (1997) | 35 | 2.53 0.08 | 0.60 0.10 | Orthogonal | |
| Wu et al. (1998) | 94 | 2.47 0.06 | 0.67 0.09 | Orthogonal | |
| Wu et al. (1998) | 110 | 2.57 0.03 | 0.49 0.05 | Orthogonal | |
| Wu et al. (1998) | 39 | 2.57 0.08 | 0.56 0.09 | Orthogonal | |
| Wu et al. (1999) | 92 | 2.49 0.03 | 0.64 0.02 | Orthogonal | |
| Xue & Wu (2000) | 109 | 2.53 0.03 | 0.58 0.05 | Orthogonal | |
| Nastasi et al. (2014) | 12 | 2.47 0.19 | 0.64 0.34 | Bisector |
In this paper, we study a sample of 38 galaxy clusters drawn from the XMM Cluster Survey (XCS; Mehrtens et al., 2012). We divide the sample into two groups: a low redshift sample (), and a high redshift sample (), such that each group has an equal number of clusters in each, and then proceed to test for evolution in the relation. We describe the sample and processing of the optical and X-ray data in Section 2. Section 3 discusses the method used to determine cluster membership and for measuring the velocity dispersion and describes the methods used for fitting the – relation, and we present our results in Section 4. We discuss our findings in Section 5 and present our conclusions in Section 6.
We assume a cosmology with , , and km s-1 Mpc-1 throughout.
2 Sample and Data Reduction
The cluster sample for this work is drawn from XCS, a serendipitous X-ray cluster survey being conducted using archival XMM-Newton data. Data Release 1 (DR1) of the XCS is described in Mehrtens et al. (2012). The overall aims of the XCS project are to measure cosmological parameters through the evolution of the cluster mass function with redshift (Sahlén et al., 2009), study the evolution of galaxies in clusters (Collins et al., 2009; Hilton et al., 2009, 2010; Stott et al., 2010) and investigate the X-ray scaling relations as a way to study the evolution of the cluster gas with redshift (Hilton et al., 2012).
The XCS Automated Pipeline Algorithm (XAPA) described in Lloyd-Davies et al. (2011) was used to search the XMM archive for cluster candidates. Mehrtens et al. (2012) describes confirmation of a subset of these candidates as clusters using the combination of data from the literature and optical follow-up observations. This left a final sample of 503 X-ray confirmed galaxy clusters, 255 which were previously unknown and 356 of which were new X-ray detections. Of these, 464 have redshift estimates, and 402 have temperature measurements.
For XCS-DR1 the cluster-averaged X-ray temperatures () were measured using an automated pipeline described in detail in Lloyd-Davies et al. (2011). In summary this pipeline operates as follows: spectra were generated in the 0.3-7.9 keV band using photons in the XAPA source ellipse, (where the XAPA ellipse corresponds 0.08 – 0.56 of R500, with a median value of to 0.36 R500, where R500 is calculated using Equation 2 and Table 2 from Arnaud et al. (2005)); an in-field background subtraction method was used; and model fitting was done inside XSPEC (Schafer, 1991) using an absorbed MEKAL (Mewe & Schrijver, 1986) model and Cash statistics (Cash, 1979). In the fit, the hydrogen column density was fixed to the Dickey (1990) value and the metal abundance to 0.3 times the Solar value. For this paper we have updated the values compared to Mehrtens et al. (2012). The pipeline is very similar to that described in Lloyd-Davies et al. (2011), but using updated versions of the XMM calibration and XSPEC. The median X-ray count for all the clusters in our final sample was 1919 with a minimum count of 220. We note that for only 1 of the clusters in our sample are the X-ray counts used for the spectral analysis less than 300. This is the minimum threshold defined by Lloyd-Davies et al. (2011) for reliable, i.e. with a fractional error of 0.4, Tx measurements at T5keV (See Figure 16 from Lloyd-Davies et al. (2011)). The remaining cluster was fit using 220 counts, but has a temperature of 3.5keV (so still has an expected fractional error of 0.4)
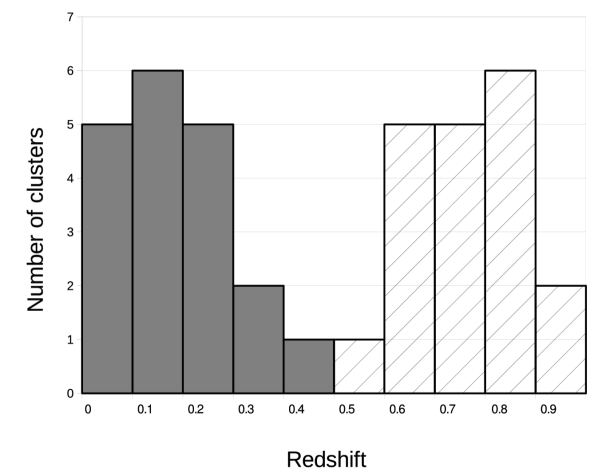
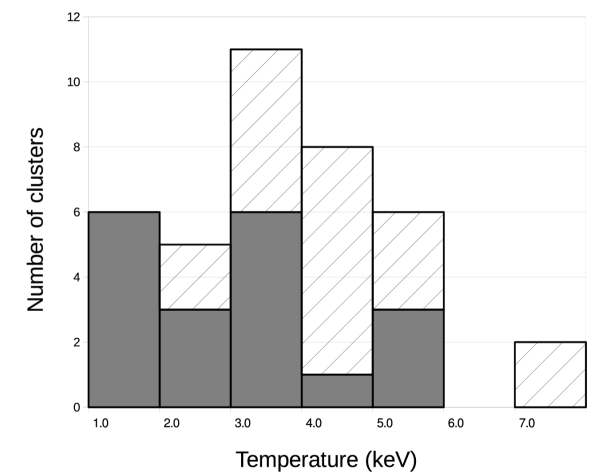
For this paper both the samples were constructed from XCS DR1, except for one of the high redshift sample clusters (XMMXCS J113602.9-032943.2) which is a previously unreported XCS cluster detection. Fig. 1 shows the redshift and temperature distributions of the two samples. The high redshift sample contains more high temperature clusters than the low redshift sample, which may be due to selection effects which result in higher luminosity and hence higher temperature clusters being chosen at higher redshift.
2.1 Low redshift sample
The low redshift sample contains 19 clusters whose properties can be found in Table 3. In order to obtain this sample we excluded all clusters from the DR1 sample that did not have temperatures or which had a redshift , leaving us with a sample of 320 clusters. We performed a search in NED111This research has made use of the NASA/IPAC Extragalactic Database (NED) which is operated by the Jet Propulsion Laboratory, California Institute of Technology, under contract with the National Aeronautics and Space Administration. for galaxies surrounding each cluster. We included only clusters which had spectroscopic redshifts resulting in our sample size being decreased from 320 to 296. Since NED collects data from many different sources the reliability of the redshifts can not be guaranteed. Hence, where possible we use only one source of redshifts per cluster to ensure homogeneity. These redshifts are specified to the 4th decimal place but unfortunately for most an uncertainty is not included in the original sample and therefore we assumed an accuracy of 1%.
We excluded galaxies located at a projected radial distance (the radius within which the mean density is 200 times the critical density of the Universe at the cluster redshift) as such galaxies are unlikely to be cluster members. To ensure we did not exclude possible members, for this initial step was calculated using a fiducial velocity dispersion of 2000 km s-1 following Finn et al. (2005),
| (1) |
Here is the line of sight velocity dispersion (see Section 3.1.3) and is the redshift of the cluster. Equation 1 assumes that the galaxy velocity distribution follows an isothermal sphere dark matter profile. The fiducial values span the range 2–4 Mpc. Section 3.1.2 below describes how this initial cluster membership selection was refined to give the final cluster members. We then excluded all clusters which had less than 10 galaxies as this would provide us with two few members for accurate velocity dispersion calculation leaving us with a sample size of 19 clusters.
2.2 High redshift sample
The high redshift sample is made up of 19 clusters whose properties can be found in Table 4. Member redshifts were determined from observations using the Gemini telescopes for 12 of these clusters (see Section 2.2.1). The other seven clusters used data obtained from Nastasi et al. (2014). They drew both on new observations and on existing data. For example, the observations of three of the Nastasi et al. (2014) clusters we have used in this paper (XMMXCS J105659.5-033728.0, XMMXCS J113602.9-032943.2 and XMMXCS J182132.9+682755.0 in Table 4) were presented in Tran et al. (1999) respectively. The observations of the other 4 clusters we have used in this paper were presented for the first time in Nastasi et al. (2014). These four were discovered independently (to XCS) by the XMM Newton Distant Cluster Project (XDCP; Fassbender et al., 2011). Nastasi et al. (2014) also presented galaxy redshift data for another six XDCP clusters, however we have not used those in this paper because there are insufficient galaxies to derive an accurate velocity dispersion222The methodology described in Section 3 was applied to these six clusters before they were excluded from our study.. For the seven clusters that relied on Nastasi et al. (2014) data, new temperatures were obtained using XCS pipelines and the velocity dispersion was recalculated using the Nastasi et al. (2014) cluster redshift together with the method described in Section 3.
2.2.1 Observations
Observations of 12 clusters were obtained using the Gemini Multi Object Spectographs (GMOS) on both the Gemini telescopes from 2010 to 2012. The nod-and-shuffle mode (Glazebrook & Bland-Hawthorn, 2001) was used to allow better sky subtraction and shorter slit lengths when compared to conventional techniques. For all observations the R400 grating and OG515 order blocking filter were used, giving wavelength coverage of 5400 – 9700 Å. The GMOS field of view samples out to R200 at the the redshifts of our sample Sifón et al. (2013). A total of 30 masks were observed with a varying number of target slitlets. Each slitlet had length 3′′ and width 1′′. Target galaxies were selected to be fainter than the brightest cluster galaxy (which was also targeted in the slit masks), on the basis of -band pre-imaging obtained from Gemini. We also used colour or photo- information, where available, to maximise our efficiency in targeting cluster members. For five clusters which had , -band photometry from the National Optical Astronomy Observatory–XMM Cluster Survey (NXS; described in Mehrtens et al., 2012), we preferentially selected galaxies with colours expected for passively evolving galaxies at the cluster redshift (see Mehrtens et al., 2012, for details). For four clusters, we used photometric redshifts for galaxies from SDSS DR7 (Abazajian et al., 2009). For XMMXCS J113602.9-032943.2, we used galaxy photo-s that were measured from our own photometry obtained at the William Herschel Telescope (WHT) on 2011 May 5. Observations at three different central wavelengths (7500, 7550 and 7600 Å) were used to obtain coverage over the gaps between the GMOS CCDs. For all observations an 85 percentile image quality and 50 percentile sky transparency were requested. The details of the individual observations are given in Table 9.
2.2.2 Spectroscopic data reduction
The data were reduced in a similar manner to Hilton et al. (2010), using Pyraf and the Gemini IRAF222IRAF is distributed by the National Optical Astronomy Observatories,which are operated by the Association of Universities for Research in Astronomy, Inc., under cooperative agreement with the National Science Foundation. package. We used the tools from this package to subtract bias frames; make flat fields; apply flat field corrections and create mosaic images. We then applied nod-and-shuffle sky subtraction using the gnsskysub task. Wavelength calibration was determined from arc frames taken between the science frames, using standard IRAF tasks. All data were then combined using a median, rejecting bad pixels using a mask constructed from the nod-and-shuffle dark frames. Finally, we combined the pairs of spectra corresponding to each nod position, and extracted one-dimensional spectra using a simple boxcar algorithm.
2.2.3 Galaxy redshift measurements
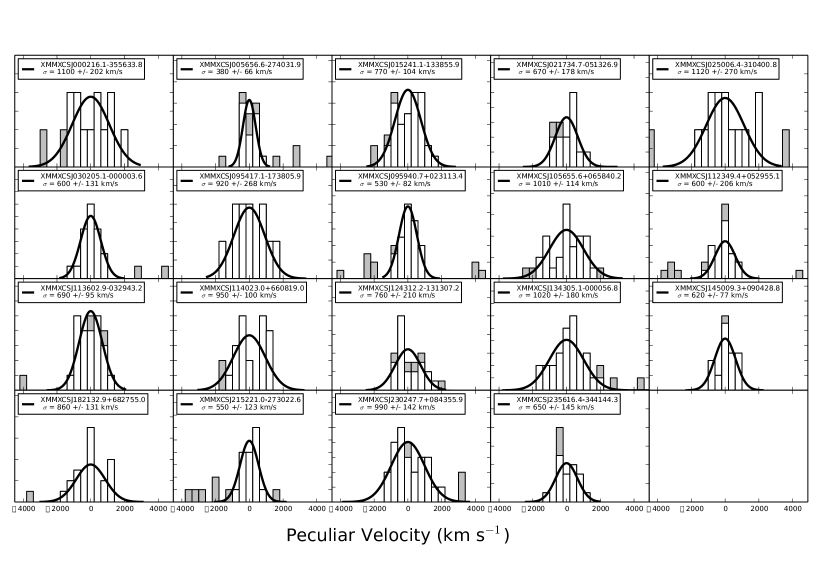
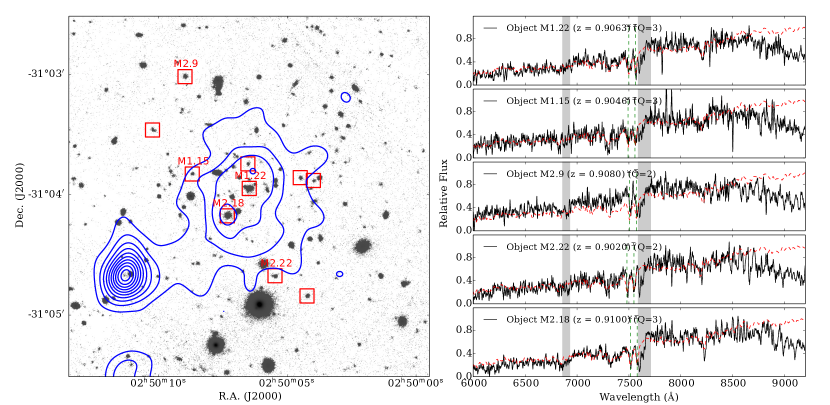
We measured galaxy redshifts from the spectra by cross-correlation with SDSS spectral templates333http://www.sdss.org/dr7/algorithms/spectemplates/index. html using the RVSAO/XCSAO package for IRAF (Kurtz & Mink, 1998). XCSAO implements the method described by Tonry & Davis (1979). The spectra were compared to six different templates over varying redshifts with the final redshift measurement being determined after visual inspection. Redshifts were assigned a quality flag according to the following scheme: corresponds to two or more strongly detected features; refers to one strongly detected or two weakly detected features; one weakly detected feature and when no features could be identified. The features used were spectral lines, with the most commonly identified being [Oii] 3727 Å, H, K, H, and the [Oiii] 4959, 5007 Å lines. Only galaxies with a quality rating of were used in this study because these have reasonably secure redshifts. Fig.2 shows spectra of some member galaxies of the cluster XMMXCS J025006.4-310400.8 as an example. Tables of redshifts for galaxies in each cluster field as well as histograms depicting the included/excluded members and the best-fit Gaussian 16 can be found in Appendix B.
Table 2 is shown, as an example, below for cluster XMMXCS J025006.4-310400.8.
| ID | Mask | RA(J2000) | Dec(J2000) | z | Quality | Member |
|---|---|---|---|---|---|---|
| 1 | GS-2010B-Q-46-06 | 02h50m22.92s | -31∘03′53.0′′ | 0.8337 | 3 | |
| 8 | GS-2010B-Q-46-06 | 02h50m15.25s | -31∘03′33.5′′ | 0.7263 | 3 | |
| 9 | GS-2010B-Q-46-06 | 02h50m13.27s | -31∘03′35.7′′ | 0.6168 | 3 | |
| 10 | GS-2010B-Q-46-06 | 02h50m12.05s | -31∘03′08.0′′ | 0.7146 | 3 | |
| 14 | GS-2010B-Q-46-06 | 02h50m06.63s | -31∘03′13.7′′ | 0.8496 | 3 | |
| 15 | GS-2010B-Q-46-06 | 02h50m08.70s | -31∘03′49.7′′ | 0.9052 | 3 | |
| 16 | GS-2010B-Q-46-06 | 02h50m03.78s | -31∘03′51.5′′ | 0.3533 | 3 | |
| 17 | GS-2010B-Q-46-06 | 02h50m06.89s | -31∘03′51.5′′ | 0.9217 | 3 | |
| 18 | GS-2010B-Q-46-06 | 02h50m05.48s | -31∘03′53.0′′ | 0.6972 | 3 | |
| 19 | GS-2010B-Q-46-06 | 02h50m04.50s | -31∘03′51.5′′ | 0.9149 | 3 | |
| 21 | GS-2010B-Q-46-06 | 02h50m02.79s | -31∘04′04.9′′ | 0.9831 | 3 | |
| 22 | GS-2010B-Q-46-06 | 02h50m06.48s | -31∘03′56.9′′ | 0.9069 | 3 | |
| 23 | GS-2010B-Q-46-06 | 02h50m09.04s | -31∘04′06.3′′ | 0.7567 | 3 | |
| 25 | GS-2010B-Q-46-06 | 02h50m03.83s | -31∘04′34.0′′ | 0.8988 | 3 | |
| 26 | GS-2010B-Q-46-06 | 02h50m04.24s | -31∘04′50.6′′ | 0.9095 | 3 | |
| 28 | GS-2010B-Q-46-06 | 02h50m04.59s | -31∘05′41.7′′ | 0.6197 | 3 | |
| 34 | GS-2010B-Q-46-06 | 02h50m04.26s | -31∘07′05.2′′ | 0.1261 | 3 | |
| 1 | GS-2012B-Q-011-09 | 02h50m22.92s | -31∘03′53.0′′ | 0.5924 | 2 | |
| 2 | GS-2012B-Q-011-09 | 02h50m18.11s | -31∘03′10.5′′ | 0.9326 | 2 | |
| 4 | GS-2012B-Q-011-09 | 02h50m16.05s | -31∘03′23.1′′ | 1.0077 | 2 | |
| 5 | GS-2012B-Q-011-09 | 02h50m14.89s | -31∘03′32.1′′ | 0.7245 | 3 | |
| 6 | GS-2012B-Q-011-09 | 02h50m14.94s | -31∘02′56.8′′ | 0.9927 | 2 | |
| 9 | GS-2012B-Q-011-09 | 02h50m08.98s | -31∘03′01.1′′ | 0.9086 | 3 | |
| 10 | GS-2012B-Q-011-09 | 02h50m10.24s | -31∘03′27.8′′ | 0.9056 | 3 | |
| 11 | GS-2012B-Q-011-09 | 02h50m07.01s | -31∘01′00.9′′ | 0.5204 | 3 | |
| 13 | GS-2012B-Q-011-09 | 02h50m06.54s | -31∘03′44.7′′ | 0.9126 | 3 | |
| 17 | GS-2012B-Q-011-09 | 02h50m03.99s | -31∘03′53.0′′ | 0.9176 | 3 | |
| 18 | GS-2012B-Q-011-09 | 02h50m07.33s | -31∘04′10.6′′ | 0.9106 | 3 | |
| 19 | GS-2012B-Q-011-09 | 02h50m02.67s | -31∘03′26.0′′ | 0.9797 | 3 | |
| 20 | GS-2012B-Q-011-09 | 02h50m07.38s | -31∘05′28.7′′ | 0.6494 | 2 | |
| 21 | GS-2012B-Q-011-09 | 02h49m58.10s | -31∘03′39.6′′ | 0.8696 | 3 | |
| 22 | GS-2012B-Q-011-09 | 02h50m05.48s | -31∘04′40.5′′ | 0.9026 | 2 | |
| 27 | GS-2012B-Q-011-09 | 02h49m58.68s | -31∘05′25.8′′ | 0.6274 | 3 | |
| 28 | GS-2012B-Q-011-09 | 02h49m59.99s | -31∘05′07.8′′ | 0.8816 | 2 | |
| 29 | GS-2012B-Q-011-09 | 02h49m58.60s | -31∘04′59.2′′ | 0.9216 | 3 | |
| 30 | GS-2012B-Q-011-09 | 02h50m00.51s | -31∘04′44.5′′ | 0.5654 | 3 | |
| 31 | GS-2012B-Q-011-09 | 02h50m04.26s | -31∘07′05.2′′ | 0.9827 | 3 |
. Name RA Dec Members (J2000) (J2000) (keV) (km s-1) (Mpc) XMMXCS J000013.9-251052.1 00h00m13.9s -25∘10′52.1′′ 0.0845 0.0004 0.081 1.80 19 410 1.11 XMMXCS J003430.1-431905.6 00h34m30.1s -43∘19′05.6′′ 0.3958 0.0010 0.401 3.50 22 920 1.96 XMMXCS J005603.0-373248.0 00h56m03.0s -37∘32′48.0′′ 0.1659 0.0009 0.162 5.20 22 900 2.06 XMMXCS J015315.0+010214.2 01h53m15.0s +01∘02′14.2′′ 0.0593 0.0002 0.063 1.08 12 240 0.55 XMMXCS J072054.3+710900.5 07h20m54.3s +71∘09′00.5′′ 0.2309 0.0005 0.234 2.90 29 550 1.20 XMMXCS J081918.6+705457.5 08h19m18.6s +70∘54′57.5′′ 0.2298 0.0005 0.235 3.00 19 410 0.83 XMMXCS J094358.2+164120.7 09h43m58.2s +16∘41′20.7′′ 0.2539 0.0005 0.251 1.50 27 590 1.54 XMMXCS J095957.6+251629.0 09h59m57.6s +25∘16′29.0′′ 0.0523 0.0005 0.086 1.40 15 510 1.79 XMMXCS J100047.4+013926.9 10h00m47.4s +01∘39′26.9′′ 0.2202 0.0006 0.227 3.30 16 560 1.41 XMMXCS J100141.7+022539.8 10h01m41.7s +02∘25′39.8′′ 0.1233 0.0005 0.128 1.43 26 590 1.05 XMMXCS J104044.4+395710.4 10h40m44.4s +39∘57′10.4′′ 0.1389 0.0007 0.169 3.54 17 860 2.12 XMMXCS J111515.6+531949.5 11h15m15.6s +53∘19′49.5′′ 0.4663 0.0010 0.4710 5.40 16 910 1.75 XMMXCS J115112.0+550655.5 11h51m12.0s +55∘06′55.5′′ 0.0791 0.0003 0.0811 1.66 16 330 1.50 XMMXCS J123144.4+413732.0 12h31m44.4s +41∘37′32.0′′ 0.1735 0.0009 0.1812 2.70 10 480 1.26 XMMXCS J151618.6+000531.3 15h16m18.6s +00∘05′31.3′′ 0.1200 0.0005 0.1313 5.40 35 870 2.01 XMMXCS J161132.7+541628.3 16h11m32.7s +54∘16′28.3′′ 0.3372 0.0013 0.338 4.60 12 790 1.69 XMMXCS J163015.6+243423.2 16h30m15.6s +24∘34′23.2′′ 0.0625 0.0003 0.0714 3.50 62 710 2.20 XMMXCS J223939.3-054327.4 22h39m39.3s -05∘43′27.4′′ 0.2451 0.0003 0.2414 2.80 68 560 1.32 XMMXCS J233757.0+271121.0 23h37m57.0s +27∘11′21.0′′ 0.1237 0.0007 0.1215 3.40 12 460 1.49
| Name | RA | Dec | Members | |||||||
|---|---|---|---|---|---|---|---|---|---|---|
| (J2000) | (J2000) | (keV) | (km s-1) | (Mpc) | ||||||
| 44footnotemark: 4 XMMXCS J000216.1-355633.8 | 00h02m16.1s | -35∘56′33.8′′ | 0.7709 0.0021 | 0.771 | 4.83 | 13 | 1100 | 1.77 | ||
| XMMXCS J005656.6-274031.9 | 00h56m56.6s | -27∘40′31.9′′ | 0.5601 0.0007 | 0.562 | 3.30 | 15 | 380 | 0.66 | ||
| XMMXCS J015241.1-133855.9 | 01h52m41.1s | -13∘38′55.9′′ | 0.8268 0.0010 | 0.823 | 3.23 | 29 | 840 | 1.33 | ||
| XMMXCS J021734.7-051326.9 | 02h17m34.7s | -05∘13′26.9′′ | 0.6467 0.0012 | 0.654 | 2.23 | 12 | 620 | 1.11 | ||
| XMMXCS J025006.4-310400.8 | 02h50m06.4s | -31∘04′00.8′′ | 0.9100 0.0024 | 0.902 | 4.50 | 13 | 1120 | 1.66 | ||
| XMMXCS J030205.1-000003.6 | 03h02m05.1s | -00∘00′03.6′′ | 0.6450 0.0007 | 0.655 | 5.82 | 16 | 610 | 1.04 | ||
| 44footnotemark: 4 XMMXCS J095417.1+173805.9 | 09h54m17.1s | 17∘38′05.9′′ | 0.8272 0.0017 | 0.821 | 3.65 | 10 | 940 | 1.42 | ||
| XMMXCS J095940.7+023113.4 | 09h59m40.7s | +02∘31′13.4′′ | 0.7291 0.0005 | 0.726 | 5.02 | 25 | 470 | 0.88 | ||
| 11footnotemark: 1 XMMXCS J105659.5-033728.0 | 10h56m59.5s | -03∘37′28.0′′ | 0.8336 0.0013 | 0.827 | 7.57 | 29 | 1010 | 1.57 | ||
| XMMXCS J112349.4+052955.1 | 11h23m49.4s | +05∘29′55.1′′ | 0.6550 0.0007 | 0.653 | 4.62 | 17 | 600 | 1.05 | ||
| XMMXCS J113602.9-032943.2 | 11h36m02.9s | -03∘29′43.2′′ | 0.8297 0.0011 | 3.32 | 21 | 700 | 1.06 | |||
| 22footnotemark: 2 XMMXCS J114023.0+660819.0 | 11h40m23.9s | +66∘08′19.0′′ | 0.7855 0.0015 | 0.787 | 7.47 | 22 | 950 | 1.51 | ||
| 44footnotemark: 4 XMMXCS J124312.2-131307.2 | 12h43m12.2s | -13∘13′07.2′′ | 0.7910 0.0014 | 0.801 | 4.92 | 11 | 790 | 1.19 | ||
| XMMXCS J134305.1-000056.8 | 13h43m05.1s | -00∘00′56.8′′ | 0.6894 0.0011 | 0.678 | 4.49 | 23 | 920 | 1.72 | ||
| XMMXCS J145009.3+090428.8 | 14h50m09.3s | +09∘04′28.8′′ | 0.6412 0.0007 | 0.603 | 3.84 | 22 | 630 | 1.07 | ||
| 33footnotemark: 3 XMMXCS J182132.9+682755.0 | 18h21m32.9s | +68∘27′55.0′′ | 0.8166 0.0011 | 0.829 | 4.49 | 19 | 860 | 1.34 | ||
| XMMXCS J215221.0-273022.6 | 21h52m21.0s | -27∘30′22.6′′ | 0.8276 0.0011 | 0.823 | 2.18 | 15 | 530 | 0.86 | ||
| XMMXCS J230247.7+084355.9 | 23h02m47.7s | +08∘43′55.9′′ | 0.7187 0.0014 | 0.7210 | 5.29 | 22 | 1010 | 1.60 | ||
| 44footnotemark: 4 XMMXCS J235616.4-344144.3 | 23h56m16.4s | -34∘41′44.3′′ | 0.9391 0.0012 | 0.941 | 4.57 | 10 | 670 | 0.91 |
3 Analysis
3.1 Membership determination and velocity dispersion measurements
In this section we describe the methodology used to determine cluster membership and calculate the velocity dispersion of each cluster.
3.1.1 Cluster redshifts
For all of the clusters an estimate of the redshift is known either from the literature or from previous observations and this is used as a starting point. The peculiar velocity of each of the galaxies is calculated relative to this redshift estimate using
| (2) |
where is the peculiar velocity of the th galaxy, is the redshift of the th galaxy, is the redshift of the cluster and is the speed of light. Extreme foreground and background sources were removed by applying a 3000 km s-1 cut with respect to the cluster redshift and then the redshift was recalculated using the biweight location method described by Beers et al. (1990). This process was iterated until the redshift converged.
3.1.2 Cluster membership
A fixed gapper method, similar to that of Fadda et al. (1996) and Crawford et al. (2014), was applied to determine which galaxies are cluster members. The reasoning behind this method is that by studying a histogram of the redshifts of possible members there should be a clear distinction between the cluster and the fore/background galaxies. Therefore we can exclude interlopers by finding the velocity difference between adjacent galaxies and setting a fixed gap that should not be exceeded. De Propris et al. (2002) found this optimum gap to be 1000 km s-1, which avoids the merging of subclusters but also prevents the breaking up of real systems into smaller groups. Therefore all our galaxies were sorted by peculiar velocity and the difference between all adjacent pairs was calculated. Any galaxies which had a difference between adjacent galaxies of greater than 1000 km s-1 were considered interlopers and were removed. This process was iterated until the number of galaxies converged.
3.1.3 Velocity dispersion
We used our confirmed galaxy cluster members to calculate an initial estimate of the velocity dispersion of each cluster using the biweight scale method described in Beers et al. (1990). We then calculated using Equation 1, and excluded all galaxies located at projected cluster-centric radial distances outside . The velocity dispersion of each cluster was then recalculated. This final radial cut did not remove more than two galaxies from the final sample for each cluster. Tables 3 and 4 list the final redshifts, velocity dispersions, and values for the low and high redshift samples respectively.
3.2 Fitting the velocity dispersion – temperature relation
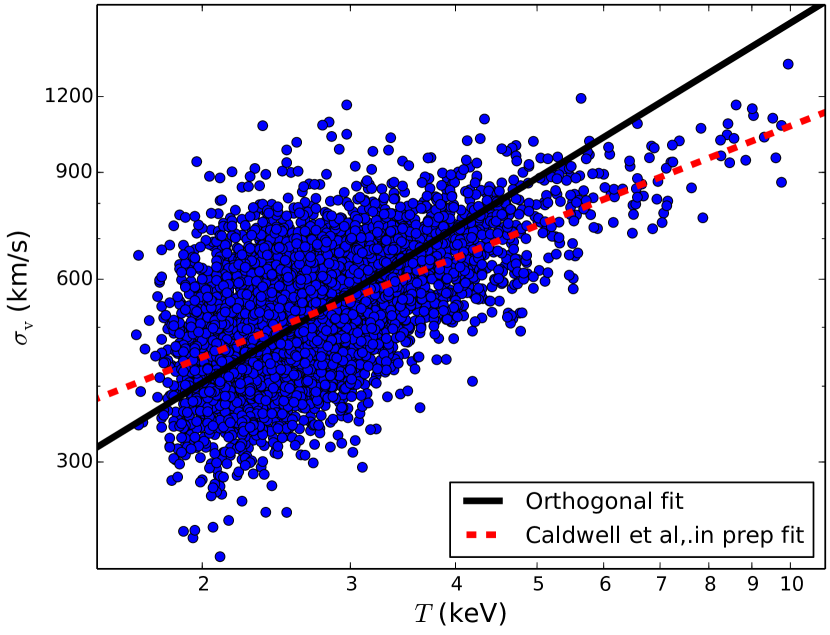
To determine the scaling relation between the velocity dispersion and temperature, we fitted a power law of the form
| (3) |
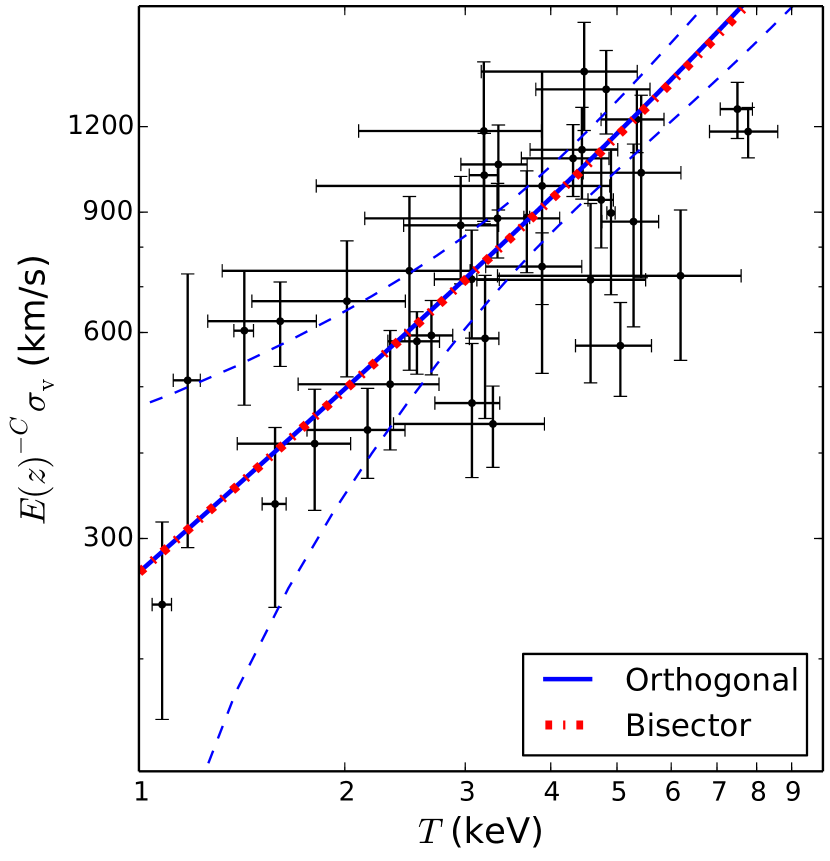
Here, 5 keV and 1000 km s-1 are the pivot temperature and velocity dispersion respectively for our fit. These were chosen to reduce the covariance between the normalisation and the slope , and for ease of comparison to previous studies. In the above, evolution of the normalisation is parametrised as , where describes the redshift evolution of the Hubble parameter. For the self similar case, and are expected.
Similarly to Hilton et al. (2012), the best fit values for these parameters were found using Markov Chain Monte-Carlo (MCMC) with the Metropolis algorithm. Both orthogonal and bisector regression methods were used. For the orthogonal method, the probability for a given cluster to be drawn from the model scaling relation is
| (4) |
where is the orthogonal distance of the cluster from the model relation, is the error on the orthogonal distance and is the intrinsic scatter orthogonal to the model relation. is calculated from the projection in the direction orthogonal to the model line of the ellipse defined by the errors on and , chosen according to the position of a given point relative to the model fit line. For the bisector method, the intrinsic scatter and measurement errors are treated independently for each axis. Therefore in the equation for , is replaced by
| (5) |
and
| (6) |
where and are replaced by , or , as appropriate. The intrinsic scatter is replaced by two parameters and .
For both methods, the likelihood of a given model is simply the product of for each cluster in the sample, i.e., in the orthogonal case
| (7) |
where we assume generous, uniform priors on each parameter, as listed in Table 5.
| Parameter | Uniform Prior | Notes |
|---|---|---|
| (-5.0,5.0) | - | |
| (0.0,2.0) | - | |
| (-1.0,1.0) | - | |
| (0.01,1.0) | Orthogonal method only | |
| (0.01,1.0) | Bisector method only | |
| (0.01,1.0) | Bisector method only |
4 Results
4.1 Evolution of the slope and intrinsic scatter
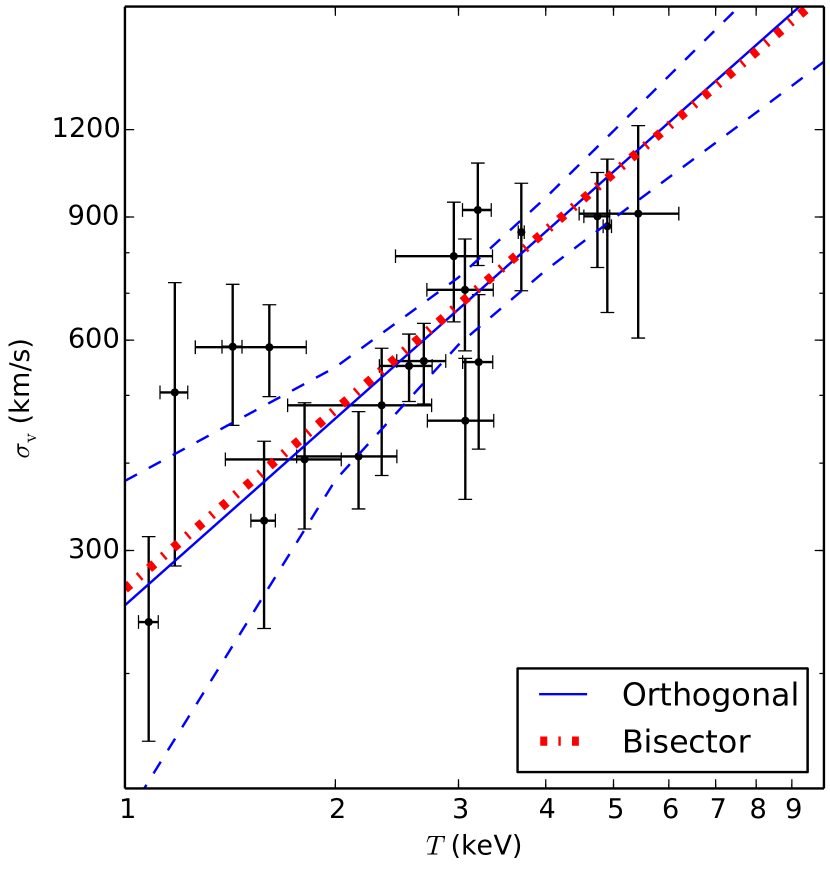
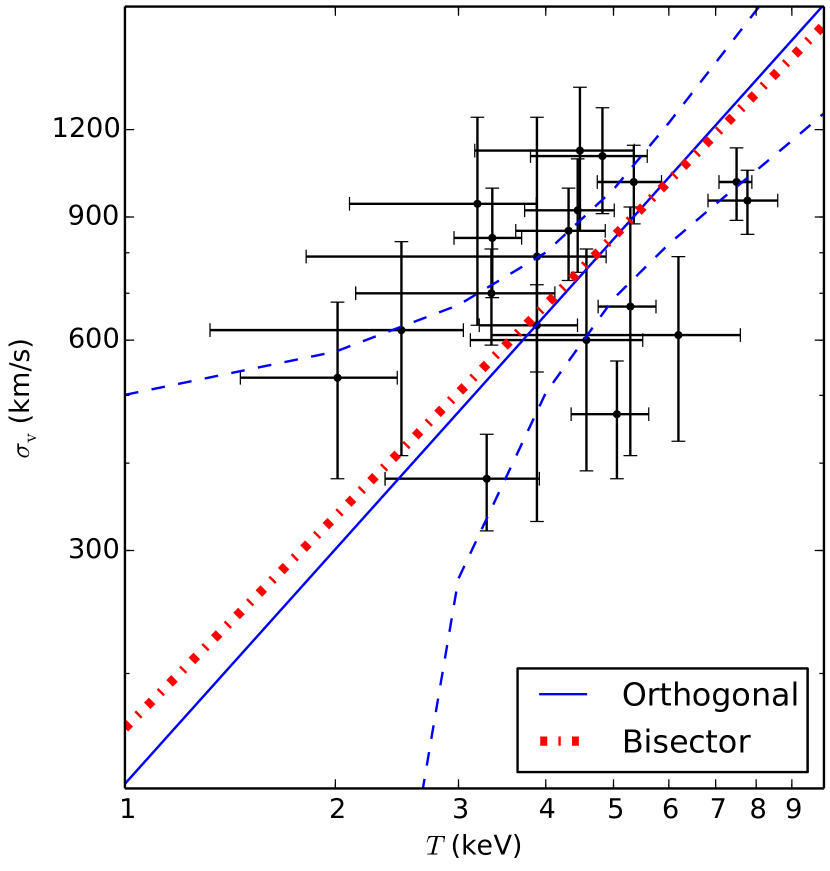
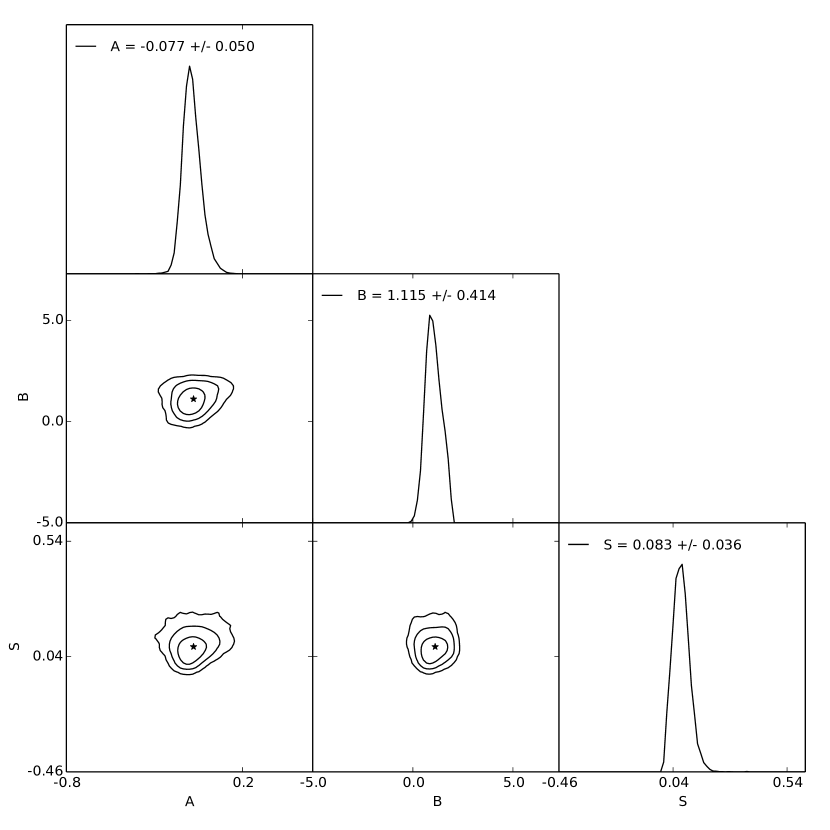
For the model given in Equation 3, it is assumed that the slope (parameter ) is not evolving with redshift. To test this, the – relation was fitted with in two redshift bins, and , with 19 clusters in each bin. The parameters , and were obtained using the MCMC method described above for the high and low redshift samples individually. The results for this are shown in Fig. 3 and Fig. 4.
Using the orthogonal method we found for the high redshift sample and for the low redshift sample. However, we found that the slope of the relation for the high redshift sample is unconstrained if the prior on is relaxed further. We assume for the remainder of this paper that the slope does not evolve with redshift, though clearly either a larger sample or more accurate measurements of individual clusters are needed to confirm that this is true.
The intrinsic scatter is for the low redshift sample and for the high redshift sample. Therefore there is no evidence that the intrinsic scatter varies with redshift.
| Method | Parameter | Low Redshift | High Redshift | Combined | Combined |
|---|---|---|---|---|---|
| (no evolution) | (with evolution) | ||||
| Orthogonal | 0.02 0.06 | -0.08 0.05 | -0.05 0.04 | 0.02 0.05 | |
| 0.89 0.16 | 1.12 0.41 | 0.72 0.12 | 0.86 0.14 | ||
| 0.05 0.03 | 0.08 0.04 | 0.06 0.03 | 0.06 0.03 | ||
| 0 | 0 | 0 | -0.37 0.33 | ||
| Bisector | 0.02 0.04 | -0.07 0.03 | -0.04 0.02 | 0.02 0.04 | |
| 0.85 0.11 | 1.01 0.17 | 0.77 0.08 | 0.86 0.09 | ||
| 0.15 0.03 | 0.19 0.03 | 0.15 0.02 | 0.14 0.02 | ||
| 0.07 0.03 | 0.12 0.04 | 0.09 0.02 | 0.09 0.02 | ||
| 0 | 0 | 0 | -0.49 0.25 |
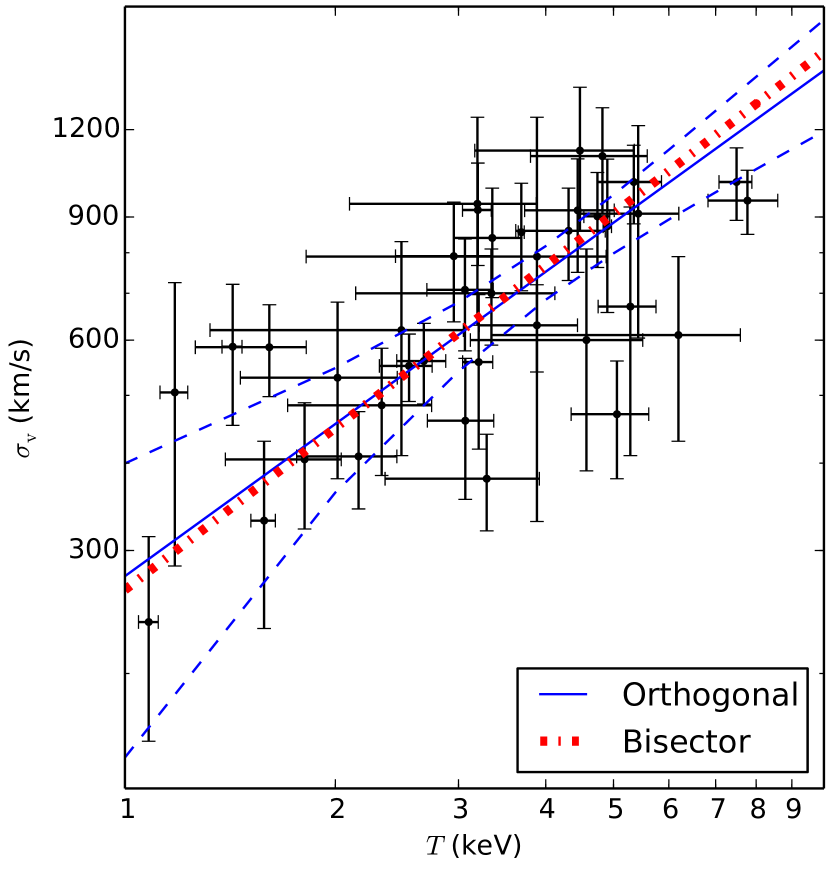
4.2 Evolution of the normalisation
To test for the evolution of the normalisation (parameter in Equation 3), the low and high redshift samples were combined and was allowed to vary in the MCMC analysis. The results obtained are shown by the the scaling relation plot in Fig. 6. We found , meaning that for a given , a higher is obtained at higher redshift. However, the no evolution relation falls within the 95 per cent confidence interval and therefore we conclude that there is no significant evidence in favour of evolution.
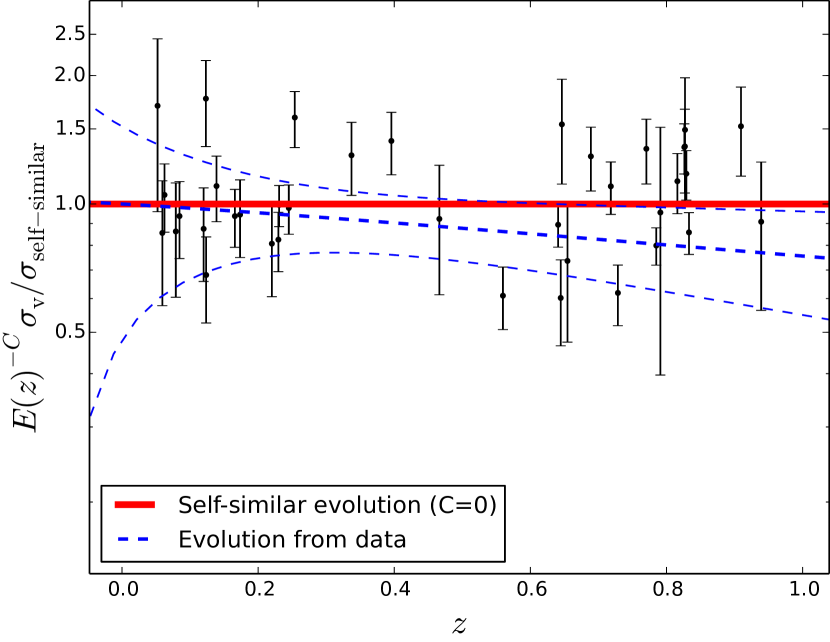
We also applied a statistical test known as the Akaike information criterion (AIC) to determine whether the model with or without evolution (Fig. 5) was preferred. The AIC estimates the quality of each model relative to each other and is therefore a means of model selection. It is defined by (Burnham & Anderson, 2002) as
| (8) |
where is the maximised likelihood function (Equation 7) and is the number of free parameters. The AIC includes a penalty for using extra parameters as a way to discourage overfitting and rewards goodness of fit based on the likelihood function. Therefore the lower the value of the AIC, the better the fit. For the combined sample with the no evolution model the AIC value was -64.6 and when the fourth parameter for evolution () was included this increased to -62.1. Therefore, combining this with the results from the – relation fit, it can be concluded that the preferred model is the one with no evolution of the normalisation of the scaling relation.
5 Discussion
5.1 Comparison with previous results
Table 6 and Figs.3–6 present the results of applying the orthogonal and bisector fitting methods to the low redshift, high redshift, and combined samples. We see that the bisector and orthogonal method give very similar results especially for our total sample without evolution. Hogg et al. (2010) suggests that the bisector method should be avoided, as by simply finding the difference between a forward and reverse fitting method large systematic errors will be introduced, but it has been widely used for scaling relation measurements in the past and is therefore included for completeness.
Results from previous studies of the – relation are collected in Table 1. All of these studies, except for Edge & Stewart (1991) and the low redshift sample of Wu et al. (1998), obtained a slope steeper than the expected self-similar slope of . We measured using the orthogonal fitting method and using the bisector fitting method for our combined sample. Therefore both the orthogonal and bisector slopes are in agreement with each other and the previous values in the literature, except for the result obtained by Edge & Stewart (1991) which is only consistent with the orthogonal result.
Except for work done by Wu et al. (1998) and Nastasi et al. (2014), all the previous results were obtained for low redshift samples and no test for evolution was performed. Wu et al. (1998) divided their sample into two groups, and , and found no significant evolution, however their sample included only four clusters in the redshift range . Nastasi et al. (2014) had a sample of 12 galaxy clusters and found a very large error of more than 50 per cent on their slope. They concluded that their sample size was too small to accurately measure evolution. We conclude that the data presented in this paper – a homogeneous cluster sample that is larger than those used in previous studies at – are consistent with previous results.
5.2 Description of simulations
Comparison to simulations are important for two main reasons. Firstly, we can determine if there is any bias due to sample selection as the simulations provide both a bigger temperature and redshift range. It also allows us to compare different simulation models and learn about the nature of the non-gravitational physics through their effect on the gas temperature.
The Millennium Gas Project is a set of hydrodynamical simulations described in Short et al. (2010) which uses the same initial perturbations as the Millennium Simulation (Springel et al., 2005). These simulations include a variety of models, including gravity only; energy injection with radiative cooling; and feedback only. For comparison to the data presented in this paper, the feedback only model (FO) in a volume of 250 Mpc3 was used. This model includes supernova and AGN feedback using a semi-analytic galaxy formation model. Heating due to supernovae and AGN and the star formation rate are obtained using the model of De Lucia & Blaizot (2007). The AGN feedback model used is described in Bower et al. (2008), which is dependent on the matter accreted by the central black hole and the efficiency with which the matter is converted to energy near the event horizon, with the upper limit being at two per cent of the Eddington rate.
As a comparison to the velocity dispersion of the cluster, two proxies were considered, the velocity dispersion of the stars () and that obtained from the dark matter particles (). The temperatures used from the simulation were spectroscopic-like temperatures (; Mazzotta et al., 2004). To ensure that only clusters similar to those in our sample were included we excluded all groups from the simulation with a mass less than 1014 M☉. We also included a temperature cut, , and a redshift cut, , to match our sample.
We also compared to the results of the BAHAMAS hydrodynamical simulation (McCarthy et al., in prep. and Caldwell et al., in prep.). Here, a 400 Mpc3 box is used, with initial conditions based on Planck 2013 cosmological parameters (Planck Collaboration et al., 2014), and both AGN and supernovae feedback models as described by Le Brun et al. (2014). A galaxy mass lower limit of M☉ and a cluster mass lower limit of M☉ were implemented. This simulation reproduces a large number of X-ray, SZ, and optical scaling relations of groups and clusters. However, unlike previous simulations, the new simulation also reproduces the observed galaxy stellar mass function remarkably well over a wide range of stellar masses. The velocity dispersion is traced by galaxies and is calculated using the gapper technique described by Beers et al. (1990). The temperatures used from the simulation were spectroscopic ().
We note that spectroscopic-like temperatures, as used in both simulations, are most robust at keV, where the bremsstrahlung mechanism dominates (Short et al., 2010). Therefore, while we have applied mass, temperature, and redshift cuts to the simulated cluster catalogues that are a reasonable match to our observed sample, the correspondance is not exact, as 6 of the observed clusters have keV. This is a compromise aimed at limiting the potential impact of low mass clusters with less reliable temperature measurements in the simulations.
Matching the velocity dispersions to the simulations, however, is not as straight-forward, and is outside the scope of this paper, but for completeness we briefly discuss causes of bias identified in previous studies. Old et al. (2013) studied the recovery of velocity dispersions from simulation data and explored how sample selection can impact the measurements and cause a bias. They introduced -band magnitude limits and found that the velocity dispersion recovered from the halos was systematically higher than that from the galaxies. When this sample was further limited to just the brightest galaxies, this discrepancy was enhanced. They suggest that the reason for this is that dynamical friction greatly affects the velocity of the galaxies, and therefore to reduce this bias a strictly magnitude-limited sample should be avoided.
Old et al. (2013) also calculated the velocity dispersion over different radial distances to see how it varied as a function of distance from the cluster centre. They found that the velocity dispersion was sensitive to the radius in which it was measured with a difference of 10 per cent in measurements being found between 0.5–1 . Sifón et al. (2016) also studied the impact of the choice of radius on velocity dispersion measurements, and found that the bias is negligible for measurements that sample beyond 0.7 (see their Figure 4). Since our observations sample out to at least 0.7 for all clusters, and beyond for more than half the sample, we expect our velocity dispersion measurements to be unaffected by this source of bias.
We used these two sets of simulations to test our orthogonal fitting methods both with and without evolution.
5.3 Comparison with simulations - Fitting with no evolution
| Simulation | Tmodel | ||||
|---|---|---|---|---|---|
| Millennium Gas | DM | -0.011 0.002 | 0.553 0.008 | 0.028 0.001 | |
| Millennium Gas | Stars | -0.034 0.003 | 0.621 0.010 | 0.034 0.001 | |
| BAHAMAS | Galaxies | -0.055 0.003 | 0.848 0.012 | 0.055 0.001 | |
| BAHAMAS (Caldwell et al., in prep) | Galaxies | Ts | -0.133 | 0.545 |
The orthogonal fitting method described in Section 3.2 was applied to both sets of simulations with . The parameters , and for both the Millennium Gas Project and BAHAMAS simulations are shown in Table 7. The – relation for the Millennium Gas Project with the two different proxies are shown in Fig. 8. The slope is slightly steeper for the stars (=0.62 0.01) than for the dark matter (=0.55 0.08) but both are consistent with previous studies of the relation and the results obtained from our data.
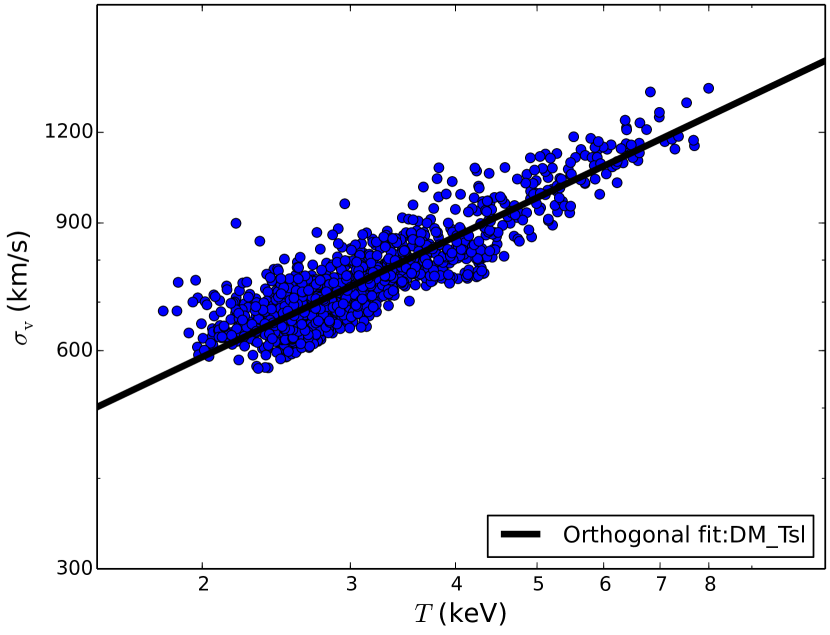
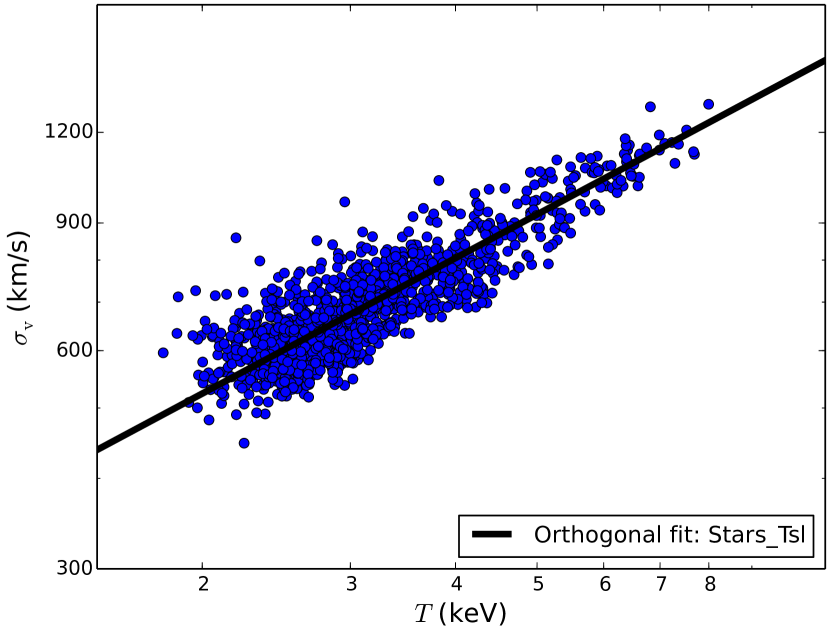
Fig. 9 shows that the orthogonal fit to the full BAHAMAS sample systematically overestimates the average velocity dispersion at keV. This may be due, in part, to the model not being a complete description of the data, as the scatter appears to vary with temperature. This is not captured in our orthogonal regression model (Equation 4), i.e., is assumed to be constant with both and . A comparison was made to a fit performed by Caldwell et al. (in prep.) to the BAHAMAS data. In this method the relation was derived by first parametrically determining the mean functions and redshift evolution of velocity dispersion and temperature, separately, with respect to mass ( critical). The velocity dispersion measurements are averaged in 0.25 log mass bins, to avoid biases from high cluster counts and the large scatter seen at low (Fig. 9). These mean values of velocity dispersion and mass are fit with a power law, and the temperature relation is derived with the same method. This was converted into the relation (with slope ) that is plotted in Fig. 9. This method provides a better fit to BAHAMAS data over the full temperature range than the orthogonal method. We use the slope obtained using the Caldwell et al. method for further studies and comparisons. We examine the effect of bias in the recovered slope on our results in Section 5.4.
We note that there is no single method which gives the underlying ‘true’ scaling relation in the presence of errors on both variables and intrinsic scatter: the recovered slope and normalisation depend upon the details of the method used. The fitting of a scaling relation is also affected by the selection processes used when determining your sample and for this study this has not been corrected for. Since our clusters are selected on X-ray luminosity rather than temperature or velocity dispersion we believe that our values are not biased and therefore selection effects will not have as big an impact on our results.
5.4 The effect of biased slope measurements on the evolution of the normalisation
Having seen, using the BAHAMAS simulation, that the slope recovered using the orthogonal regression method may be biased high, we now discuss the potential impact of a biased slope measurement on our conclusions regarding the observed cluster sample in Section 5.1.
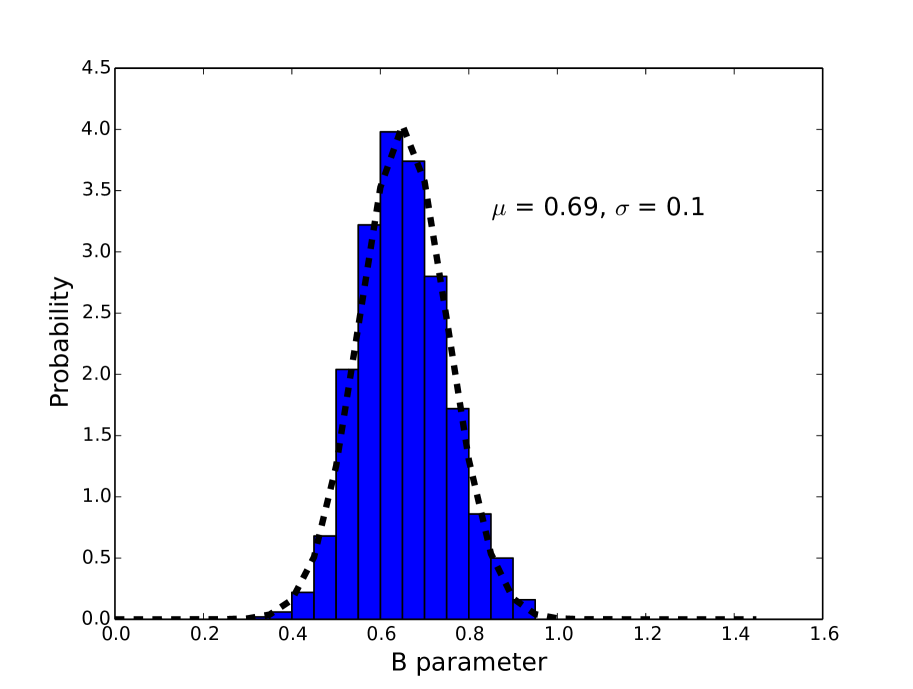
To investigate this, we generated 1000 mock samples (each containing 38 clusters) from the BAHAMAS simulation with the same temperature distribution as the observed sample, and applied the orthogonal regression method. Fig. 10 shows the distribution of recoverd slope values. The average is , which is 2 higher than the slope obtained from the fit performed by Caldwell et al. in prep (Section 5.2). Therefore, if the BAHAMAS sample is representative of the real cluster population, then we would conclude that the slope we have measured for the observed cluster sample is biased high.
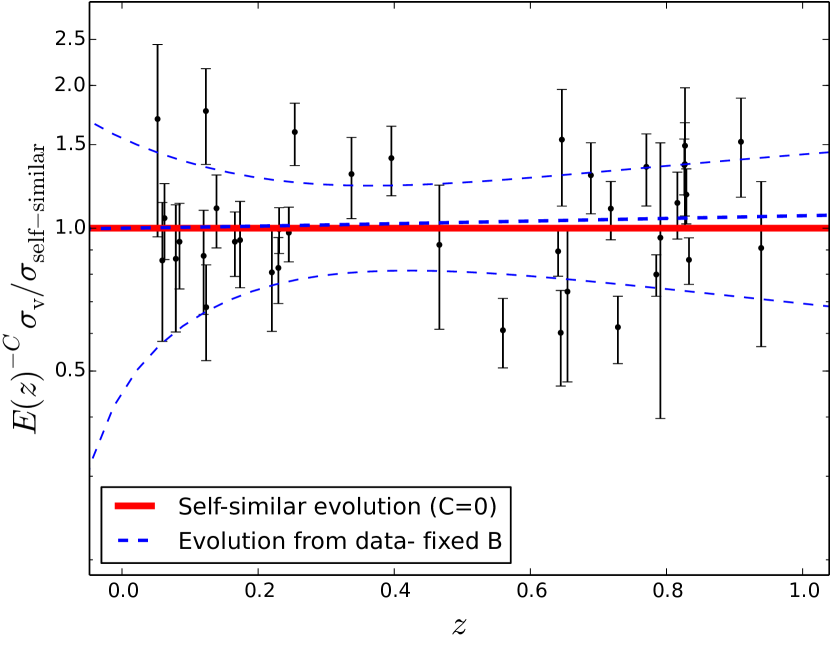
To check if a biased slope estimate affects our conclusions regarding the lack of significant evidence for evolution of the normalisation of the relation (Section 4.2), we fixed the slope to and re-ran the orthogonal fit for the observed cluster sample. We found , which is consistent with no evolution (Fig. 11). Therefore, even if the slope value of that we measured was biased high for any reason, this does not affect our conclusion that we do not see significant evidence in favour of evolution.
5.5 Comparison with simulations - Fitting with evolution
| Simulation | A | B | S | C | ||
|---|---|---|---|---|---|---|
| Millennium Gas | DM | -0.031 0.002 | 0.551 0.006 | 0.0220 0.0010 | 0.371 0.014 | |
| Millennium Gas | Stars | -0.056 0.002 | 0.619 0.009 | 0.0295 0.0010 | 0.397 0.019 | |
| BAHAMAS (fixed B) | Galaxies | -0.135 0.002 | 0.545 | 0.0390 0.0010 | 0.046 0.016 | |
| BAHAMAS (varying B) | Galaxies | -0.071 0.005 | 0.779 0.014 | 0.0570 0.0010 | -0.029 0.024 |
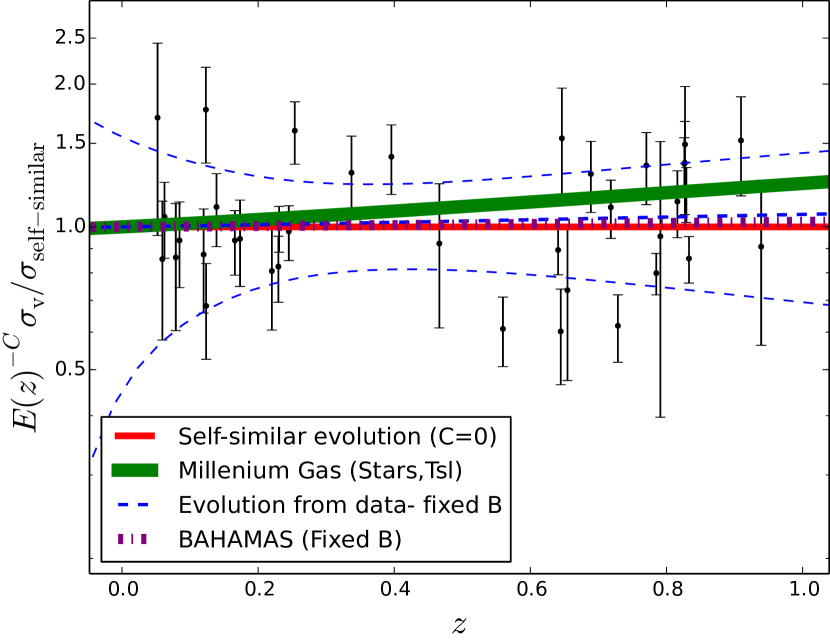
We now investigate evolution in the normalisation of the – relation in the simulations by fitting for the value of , as we did for the observed sample (see Section 4.2). The results are shown in Table 8 and graphically in Fig. 12. The BAHAMAS simulation was tested both with a slope that was allowed to vary and a fixed slope. Although, in Section 5.4 we showed that the over-estimated slope does not affect evolution, we included a fixed slope for further comparison. Both were found to be consistent with zero evolution, further proving that the biased slope does not affect evolution. However, the simulations from the Millennium Gas Project show small but significant positive evolution ( for and ). To see the reason for this, we can re-write the – relation in terms of the – and – relations, where is the cluster mass (see, e.g., Maughan, 2014). We define
| (9) |
where
| (10) | ||||
Here, , and have the same meaning as before, and the subscripts indicate the corresponding relation (e.g., indicates the slope of the – relation). If we set , and as predicted by the self-similar relation, then we obtain as expected. We performed fits to determine the values of , and in the Millennium Gas simulation at and . We found that when using either or as the measure of , and that varied from 0.55–0.6 (depending on whether spectroscopic-like or mass-weighted temperature estimates were used), which is slightly higher than the self-similar value, but not by enough to explain the positive evolution measured in the – relation. This leads to the conclusion that the evolution is driven by the value of , and it was found that the measured value for the dark matter was as expected, but that this decreased to values between 0–0.2 for the gas. Therefore in the Millennium Gas simulation, the lack of redshift evolution in the relation drives the positive evolution in the – relation.
The most likely explanation for the lack of redshift evolution in the relation in the Millennium Gas simulation is the absence of radiative cooling. When both cooling and feedback are included in simulations (as in BAHAMAS), the feedback acts as a regulation mechanism, heating the surrounding dense gas and expelling it from the cluster core. This in turn leads to higher-entropy gas flowing inwards. In the Millennium Gas simulation, the feedback model heats the gas and directly increases its entropy, which is eventually distributed throughout the cluster. This builds up over time as more and more energy is pumped into the gas from the growing black holes, and has the effect of slowing down the evolution of the relation (compared to the evolution expected due to the decreasing background density with redshift). This in turn leads to the positive evolution of the – relation. It is likely that the more sophisticated feedback model used in BAHAMAS, where the entropy evolution is driven by radiative cooling, is the more realistic of the two.
6 Conclusions
We have studied the evolution of the velocity dispersion–temperature () relation using a cluster sample spanning the range drawn from XCS. This work improves upon previous studies in terms of the use of a homogeneous cluster sample and the number of clusters included. We present new redshift and velocity dispersion measurements based on Gemini data for 12 such XCS clusters.
We used an orthogonal regression method to measure the normalisation, slope and intrinsic scatter of the – relation for two subsamples: 19 clusters at , and 19 clusters with . In both cases, we found the slope of the relation to be consistent with the findings of previous studies, i.e., slightly steeper than expected from self-similarity. Under the assumption that the slope of the relation does not evolve with redshift, we measured the evolution of the normalisation of the relation using the complete sample of 38 clusters. We found this to be slightly negative but not significantly different from the self-similar solution (). Moreover, a no evolution model is the preferred choice when considering the Akaike Information Criterion.
We applied the same scaling relation analysis methods to the BAHAMAS and Millennium Gas cosmological hydrodynamical simulations. The – relation does not evolve in BAHAMAS, in agreement with our findings for the observed cluster sample. However, positive evolution is seen in the Millennium Gas simulation. The difference is most likely due to the inclusion of self-consistent modelling of radiative cooling in BAHAMAS, which is absent in the Millennium Gas simulation. This leads to a very slowly evolving – relation in the Millennium Gas simulation, which in turn drives the positive evolution of the – relation. While this work has improved upon previous studies in terms of the number of high redshift clusters included, we note that the uncertainties on the scaling relation parameters are still rather large, and a combination of better measurements of individual cluster properties and a larger sample are required to make further progress. Future studies will look at implementing the Bayesian method described by Kelly (2007) to account for intrinsic scatter and measurement errors and looking at possible selection effects.
Acknowledgements
SW and MH acknowledge financial support from the National Research Foundation and SKA South Africa. This research has made use of the NASA/IPAC Extragalactic Database (NED) which is operated by the Jet Propulsion Laboratory, California Institute of Technology, under contract with the National Aeronautics and Space Administration. Based on observations obtained at the Gemini Observatory, which is operated by the Association of Universities for Research in Astronomy, Inc., under a cooperative agreement with the NSF on behalf of the Gemini partnership: the National Science Foundation (United States), the National Research Council (Canada), CONICYT (Chile), the Australian Research Council (Australia), Ministério da Ciência, Tecnologia e Inovação (Brazil) and Ministerio de Ciencia, Tecnología e Innovación Productiva (Argentina). PAT acknowledges support from the Science and Technology Facilities Council (grant number ST/L000652/1). JPS gratefully acknowledges support from a Hintze Research Fellowship. STK acknowledges support from STFC (grant number ST/L000768/1).
References
- Abazajian et al. (2003) Abazajian K., et al., 2003, AJ, 126, 2081
- Abazajian et al. (2004) Abazajian K., et al., 2004, AJ, 128, 502
- Abazajian et al. (2005) Abazajian K., et al., 2005, AJ, 129, 1755
- Abazajian et al. (2009) Abazajian K. N., et al., 2009, ApJS, 182, 543
- Adami et al. (2011) Adami C., et al., 2011, A&A, 526, A18
- Adelman-McCarthy et al. (2006) Adelman-McCarthy J. K., et al., 2006, ApJS, 162, 38
- Adelman-McCarthy et al. (2007) Adelman-McCarthy J. K., et al., 2007, ApJS, 172, 634
- Adelman-McCarthy et al. (2008) Adelman-McCarthy J. K., et al., 2008, ApJS, 175, 297
- Arnaud et al. (2005) Arnaud M., Pointecouteau E., Pratt G. W., 2005, A&A, 441, 893
- Balogh et al. (2002) Balogh M., Bower R. G., Smail I., Ziegler B. L., Davies R. L., Gaztelu A., Fritz A., 2002, MNRAS, 337, 256
- Basilakos et al. (2004) Basilakos S., Plionis M., Georgakakis A., Georgantopoulos I., Gaga T., Kolokotronis V., Stewart G. C., 2004, MNRAS, 351, 989
- Bayliss et al. (2011) Bayliss M. B., Hennawi J. F., Gladders M. D., Koester B. P., Sharon K., Dahle H., Oguri M., 2011, ApJS, 193, 8
- Beers et al. (1990) Beers T. C., Flynn K., Gebhardt K., 1990, AJ, 100, 32
- Bellagamba et al. (2011) Bellagamba F., Maturi M., Hamana T., Meneghetti M., Miyazaki S., Moscardini L., 2011, MNRAS, 413, 1145
- Berlind et al. (2006) Berlind A. A., et al., 2006, ApJS, 167, 1
- Bird et al. (1995) Bird C. M., Mushotzky R. F., Metzler C. A., 1995, ApJ, 453, 40
- Bower (1997) Bower R. G., 1997, MNRAS, 288, 355
- Bower et al. (2008) Bower R. G., McCarthy I. G., Benson A. J., 2008, MNRAS, 390, 1399
- Branchesi et al. (2007) Branchesi M., Gioia I. M., Fanti C., Fanti R., 2007, A&A, 472, 739
- Brusa et al. (2010) Brusa M., et al., 2010, ApJ, 716, 348
- Bryan & Norman (1998) Bryan G. L., Norman M. L., 1998, ApJ, 495, 80
- Burenin et al. (2007) Burenin R. A., Vikhlinin A., Hornstrup A., Ebeling H., Quintana H., Mescheryakov A., 2007, ApJS, 172, 561
- Burnham & Anderson (2002) Burnham K. P., Anderson D. R., 2002, Model Selection and Multimodel Inference:A Practical Information-Theoretic Approach, 2 edn. Springer-Verlag, New York
- Cappi et al. (1998) Cappi A., Held E. V., Marano B., 1998, A&AS, 129, 31
- Cash (1979) Cash W., 1979, ApJ, 228, 939
- Clerc et al. (2012) Clerc N., Sadibekova T., Pierre M., Pacaud F., Le Fèvre J.-P., Adami C., Altieri B., Valtchanov I., 2012, MNRAS, 423, 3561
- Clerc et al. (2014) Clerc N., et al., 2014, MNRAS, 444, 2723
- Cohn & White (2005) Cohn J. D., White M., 2005, Astroparticle Physics, 24, 316
- Colless et al. (2003a) Colless M., et al., 2003a, ArXiv Astrophysics e-prints,
- Colless et al. (2003b) Colless M., et al., 2003b, VizieR Online Data Catalog, 7226, 0
- Collins et al. (2009) Collins C. A., et al., 2009, Nature, 458, 603
- Coziol et al. (2009) Coziol R., Andernach H., Caretta C. A., Alamo-Martínez K. A., Tago E., 2009, AJ, 137, 4795
- Crawford et al. (2014) Crawford S. M., Wirth G. D., Bershady M. A., 2014, ApJ, 786, 30
- De Lucia & Blaizot (2007) De Lucia G., Blaizot J., 2007, MNRAS, 375, 2
- De Propris et al. (2002) De Propris R., Couch W. J., Colless M., et al., 2002, MNRAS, 329, 87
- Dickey (1990) Dickey J. M., 1990, in Thronson Jr. H. A., Shull J. M., eds, Astrophysics and Space Science Library Vol. 161, The Interstellar Medium in Galaxies. pp 473–481
- Donahue et al. (1999) Donahue M., Voit G. M., Scharf C. A., Gioia I. M., Mullis C. R., Hughes J. P., Stocke J. T., 1999, ApJ, 527, 525
- Edge & Stewart (1991) Edge A. C., Stewart G. C., 1991, MNRAS, 252, 428
- Ettori et al. (2004) Ettori S., Tozzi P., Borgani S., Rosati P., 2004, A&A, 417, 13
- Fadda et al. (1996) Fadda D., Girardi M., Giuricin G., Mardirossian F., Mezzetti M., 1996, ApJ, 473, 670
- Fassbender et al. (2011) Fassbender R., et al., 2011, New Journal of Physics, 13, 125014
- Feruglio et al. (2008) Feruglio C., et al., 2008, A&A, 488, 417
- Finn et al. (2005) Finn R. A., et al., 2005, ApJ, 630, 206
- Finoguenov et al. (2007) Finoguenov A., et al., 2007, ApJS, 172, 182
- Freudling et al. (1992) Freudling W., Haynes M. P., Giovanelli R., 1992, ApJS, 79, 157
- Gioia & Luppino (1994) Gioia I. M., Luppino G. A., 1994, ApJS, 94, 583
- Gioia et al. (2004) Gioia I. M., Wolter A., Mullis C. R., Henry J. P., Böhringer H., Briel U. G., 2004, A&A, 428, 867
- Giovanelli et al. (1995) Giovanelli R., Scodeggio M., Solanes J. M., Haynes M. P., Arce H., Sakai S., 1995, AJ, 109, 1451
- Girardi et al. (1996) Girardi M., Fadda D., Giuricin G., Mardirossian F., Mezzetti M., Biviano A., 1996, ApJ, 457, 61
- Glazebrook & Bland-Hawthorn (2001) Glazebrook K., Bland-Hawthorn J., 2001, PASP, 113, 197
- Goto et al. (2003) Goto T., et al., 2003, PASJ, 55, 771
- Guzzo et al. (2009) Guzzo L., et al., 2009, A&A, 499, 357
- Hao et al. (2010) Hao J., et al., 2010, ApJS, 191, 254
- Hasselfield et al. (2013) Hasselfield M., et al., 2013, J. Cosmology Astropart. Phys., 7, 8
- Hennawi et al. (2008) Hennawi J. F., et al., 2008, AJ, 135, 664
- Hilton et al. (2009) Hilton M., et al., 2009, ApJ, 697, 436
- Hilton et al. (2010) Hilton M., et al., 2010, ApJ, 718, 133
- Hilton et al. (2012) Hilton M., et al., 2012, MNRAS, 424, 2086
- Hoekstra et al. (2015) Hoekstra H., Herbonnet R., Muzzin A., Babul A., Mahdavi A., Viola M., Cacciato M., 2015, MNRAS, 449, 685
- Hogg et al. (2010) Hogg D. W., Bovy J., Lang D., 2010, preprint, (arXiv:1008.4686)
- Huchra et al. (2012) Huchra J. P., et al., 2012, ApJS, 199, 26
- Jeltema et al. (2007) Jeltema T. E., Mulchaey J. S., Lubin L. M., Fassnacht C. D., 2007, ApJ, 658, 865
- Jones et al. (2009) Jones D. H., et al., 2009, MNRAS, 399, 683
- Kaiser (1986) Kaiser N., 1986, MNRAS, 222, 323
- Kay et al. (2007) Kay S. T., da Silva A. C., Aghanim N., Blanchard A., Liddle A. R., Puget J.-L., Sadat R., Thomas P. A., 2007, MNRAS, 377, 317
- Kelly (2007) Kelly B. C., 2007, ApJ, 665, 1489
- Koester et al. (2007) Koester B. P., et al., 2007, ApJ, 660, 239
- Kravtsov & Borgani (2012) Kravtsov A. V., Borgani S., 2012, ARA&A, 50, 353
- Kurtz & Mink (1998) Kurtz M. J., Mink D. J., 1998, PASP, 110, 934
- Le Brun et al. (2014) Le Brun A. M. C., McCarthy I. G., Schaye J., Ponman T. J., 2014, MNRAS, 441, 1270
- Le Fevre et al. (1995) Le Fevre O., Crampton D., Lilly S. J., Hammer F., Tresse L., 1995, ApJ, 455, 60
- Lilly et al. (2007) Lilly S. J., et al., 2007, ApJS, 172, 70
- Lloyd-Davies et al. (2011) Lloyd-Davies E. J., et al., 2011, MNRAS, 418, 14
- Lubin & Bahcall (1993) Lubin L. M., Bahcall N. A., 1993, ApJ, 415, L17
- Lumb et al. (2004) Lumb D. H., et al., 2004, A&A, 420, 853
- Magnelli et al. (2009) Magnelli B., Elbaz D., Chary R. R., Dickinson M., Le Borgne D., Frayer D. T., Willmer C. N. A., 2009, A&A, 496, 57
- Mann & Ebeling (2012) Mann A. W., Ebeling H., 2012, MNRAS, 420, 2120
- Maughan (2014) Maughan B. J., 2014, MNRAS, 437, 1171
- Maughan et al. (2006) Maughan B. J., Jones L. R., Ebeling H., Scharf C., 2006, MNRAS, 365, 509
- Maughan et al. (2012) Maughan B. J., Giles P. A., Randall S. W., Jones C., Forman W. R., 2012, MNRAS, 421, 1583
- Mazzotta et al. (2004) Mazzotta P., Rasia E., Moscardini L., Tormen G., 2004, MNRAS, 354, 10
- Mehrtens et al. (2012) Mehrtens N., et al., 2012, MNRAS, 423, 1024
- Mewe & Schrijver (1986) Mewe R., Schrijver C. J., 1986, A&A, 169, 178
- Miller et al. (2002) Miller C. J., Krughoff K. S., Batuski D. J., Hill J. M., 2002, AJ, 124, 1918
- Mulchaey et al. (2006) Mulchaey J. S., Lubin L. M., Fassnacht C., Rosati P., Jeltema T. E., 2006, ApJ, 646, 133
- Mullis et al. (2003) Mullis C. R., et al., 2003, ApJ, 594, 154
- Nastasi et al. (2014) Nastasi A., et al., 2014, A&A, 564, A17
- Ofek et al. (2007) Ofek E. O., Oguri M., Jackson N., Inada N., Kayo I., 2007, MNRAS, 382, 412
- Old et al. (2013) Old L., Gray M. E., Pearce F. R., 2013, MNRAS, 434, 2606
- Ortiz-Gil et al. (2004) Ortiz-Gil A., Guzzo L., Schuecker P., Böhringer H., Collins C. A., 2004, MNRAS, 348, 325
- Perlman et al. (2002) Perlman E. S., Horner D. J., Jones L. R., Scharf C. A., Ebeling H., Wegner G., Malkan M., 2002, ApJS, 140, 265
- Pinkney et al. (1993) Pinkney J., Rhee G., Burns J. O., Hill J. M., Oegerle W., Batuski D., Hintzen P., 1993, ApJ, 416, 36
- Planck Collaboration et al. (2014) Planck Collaboration et al., 2014, A&A, 571, A16
- Planck Collaboration et al. (2015) Planck Collaboration et al., 2015, preprint, (arXiv:1502.01597)
- Ponman et al. (1996) Ponman T. J., Bourner P. D. J., Ebeling H., Böhringer H., 1996, MNRAS, 283, 690
- Poole et al. (2007) Poole G. B., Babul A., McCarthy I. G., Fardal M. A., Bildfell C. J., Quinn T., Mahdavi A., 2007, MNRAS, 380, 437
- Quintana & Melnick (1982) Quintana H., Melnick J., 1982, AJ, 87, 972
- Randall et al. (2002) Randall S. W., Sarazin C. L., Ricker P. M., 2002, ApJ, 577, 579
- Reichardt et al. (2013) Reichardt C. L., et al., 2013, ApJ, 763, 127
- Ritchie & Thomas (2002) Ritchie B. W., Thomas P. A., 2002, MNRAS, 329, 675
- Rozo et al. (2009) Rozo E., et al., 2009, ApJ, 699, 768
- Sacchi et al. (2009) Sacchi N., et al., 2009, ApJ, 703, 1778
- Sahlén et al. (2009) Sahlén M., et al., 2009, MNRAS, 397, 577
- Sakelliou & Merrifield (1998) Sakelliou I., Merrifield M. R., 1998, MNRAS, 293, 489
- Sánchez Almeida et al. (2011) Sánchez Almeida J., Aguerri J. A. L., Muñoz-Tuñón C., Huertas-Company M., 2011, ApJ, 735, 125
- Schaerer et al. (1999) Schaerer D., Contini T., Pindao M., 1999, A&AS, 136, 35
- Schafer (1991) Schafer R. A., 1991, XSPEC, an x-ray spectral fitting package : version 2 of the user’s guide
- Scharf et al. (1997) Scharf C. A., Ebeling H., Perlman E., Malkan M., Wegner G., 1997, ApJ, 477, 79
- Schweizer (1996) Schweizer F., 1996, AJ, 111, 109
- Scodeggio et al. (1995) Scodeggio M., Solanes J. M., Giovanelli R., Haynes M. P., 1995, ApJ, 444, 41
- Short et al. (2010) Short C. J., Thomas P. A., Young O. E., Pearce F. R., Jenkins A., Muanwong O., 2010, MNRAS, 408, 2213
- Sifón et al. (2013) Sifón C., et al., 2013, ApJ, 772, 25
- Sifón et al. (2016) Sifón C., et al., 2016, MNRAS,
- Silverman et al. (2005) Silverman J. D., et al., 2005, ApJ, 618, 123
- Smith et al. (2004) Smith R. J., et al., 2004, AJ, 128, 1558
- Springel et al. (2005) Springel V., et al., 2005, Nature, 435, 629
- Stott et al. (2010) Stott J. P., et al., 2010, ApJ, 718, 23
- Stoughton et al. (2002) Stoughton C., et al., 2002, AJ, 123, 485
- Struble & Rood (1999) Struble M. F., Rood H. J., 1999, ApJS, 125, 35
- Takey et al. (2011) Takey A., Schwope A., Lamer G., 2011, A&A, 534, A120
- Takey et al. (2013) Takey A., Schwope A., Lamer G., 2013, A&A, 558, A75
- Tonry & Davis (1979) Tonry J., Davis M., 1979, AJ, 84, 1511
- Tran et al. (1999) Tran K.-V. H., Kelson D. D., van Dokkum P., Franx M., Illingworth G. D., Magee D., 1999, ApJ, 522, 39
- Trichas et al. (2010) Trichas M., et al., 2010, MNRAS, 405, 2243
- Trump et al. (2007) Trump J. R., et al., 2007, ApJS, 172, 383
- Verdugo et al. (2008) Verdugo M., Ziegler B. L., Gerken B., 2008, A&A, 486, 9
- Vikhlinin et al. (1998) Vikhlinin A., McNamara B. R., Forman W., Jones C., Quintana H., Hornstrup A., 1998, ApJ, 502, 558
- Vikhlinin et al. (2002) Vikhlinin A., van Speybroeck L., Markevitch M., Forman W. R., Grego L., 2002, ApJ, 578, L107
- Vikhlinin et al. (2006) Vikhlinin A., Kravtsov A., Forman W., Jones C., Markevitch M., Murray S. S., Van Speybroeck L., 2006, ApJ, 640, 691
- Vikhlinin et al. (2009) Vikhlinin A., et al., 2009, ApJ, 692, 1060
- Voit (2005) Voit G. M., 2005, Reviews of Modern Physics, 77, 207
- Wegner (2011) Wegner G. A., 2011, MNRAS, 413, 1333
- White et al. (1997) White D. A., Jones C., Forman W., 1997, MNRAS, 292, 419
- Wu et al. (1998) Wu X.-P., Fang L.-Z., Xu W., 1998, A&A, 338, 813
- Wu et al. (1999) Wu X.-P., Xue Y.-J., Fang L.-Z., 1999, ApJ, 524, 22
- Xue & Wu (2000) Xue Y.-J., Wu X.-P., 2000, ApJ, 538, 65
- Yoon et al. (2008) Yoon J. H., Schawinski K., Sheen Y.-K., Ree C. H., Yi S. K., 2008, ApJS, 176, 414
- Šuhada et al. (2011) Šuhada R., et al., 2011, A&A, 530, A110
- von der Linden et al. (2014) von der Linden A., et al., 2014, MNRAS, 439, 2
Appendix A Observations log
| Cluster Name | Mask | Slits | Airmass Range | Observation Date | Frames(s) | Seeing () | |
|---|---|---|---|---|---|---|---|
| XMMXCS J005656.6-274031.9 | GS2012B–Q–011–03 | 33 | 1.22 | 2012–10–19 | 1 x 1830 | ||
| " | " | 1.48 – 1.76 | 2012–10–16 | 2 x 1830 | |||
| " | " | 1.01 – 1.04 | 2012–10–15 | 3 x 1830 | 0.76 – 0.80 | ||
| " | GS2012B–Q–011–04 | 35 | 1.05 – 1.35 | 2012–11–14 | 4 x 1830 | ||
| XMMXCS J015241.1-133855.9 | GS2011B–Q–050–01 | 33 | 1.05 – 1.21 | 2011–12–02 | 6 x 1830 | ||
| " | GS2011B–Q–050–02 | 34 | 1.05 – 1.65 | 2011–12–03 | 6 x 1830 | ||
| XMMXCS J021734.7-051326.9 | GS2012B–Q–011–06 | 34 | 1.14 – 1.48 | 2012–12–05 | 4 x 1830 | ||
| XMMXCS J025006.4-310400.8 | GS2012B–Q–011–09 | 32 | 1.11 – 1.20 | 2012–11–24 | 2 x 1830 | ||
| " | " | 1.01 – 1.19 | 2012–11–21 | 4 x 1830 | |||
| " | GS2010B–Q–046–06 | 35 | 1.06 – 1.12 | 2010–11–14 | 2 x 1830 | 0.50 – 0.60 | |
| " | " | 1.06 – 1.44 | 2010–11–13 | 5 x 1830, 1 x 762 | 1 | ||
| XMMXCS J030205.1-000003.6 | GS2011B–Q–050–03 | 32 | 1.17 | 2011–12–01 | 1 x 1830 | ||
| " | " | 1.18 | 2011–11–20 | 1 x 1098 | |||
| " | " | 1.17 – 1.45 | 2011–11–18 | 4 x 1830 | |||
| " | GS2011B–Q–050–04 | 32 | 1.32 | 2011–12–31 | 1 x 1098 | ||
| " | " | 1.23 – 1.74 | 2011–12–30 | 4 x 1830 | 0.85 – 1.40 | ||
| " | GS2011B–Q–050–05 | 33 | 1.27 – 1.57 | 2012–01–17 | 2 x 1830 | 0.7 | |
| XMMXCS J095940.7+023113.4 | GS2010B–Q–046–02 | 35 | 1.19 – 1.23 | 2011–01–09 | 3 x 1830 | ||
| " | " | 1.19 – 1.25 | 2011–01–08 | 4 x 1830 | |||
| " | GS–2012A–Q–46–01 | 35 | 1.19 – 1.29 | 2012–03–18 | 4 x 1830 | ||
| " | " | 1.19 – 1.23 | 2012–03–02 | 2 x 1830 | |||
| " | GS–2012A–Q–46–02 | 34 | 1.20 – 1.35 | 2012–03–27 | 3 x 1830 | ||
| " | " | 1.23 – 1.46 | 2012–03–23 | 3 x 1830 | 0.8 | ||
| " | GS–2012A–Q–46–03 | 34 | 1.21 – 1.54 | 2012–03–22 | 6 x 1830 | 0.65 – 0.70 | |
| XMMXCS J112349.3+052956.8 | GS–2012A–Q–46–05 | 33 | 1.23 – 1.33 | 2012–04–22 | 5 x 1830 | ||
| " | " | 1.47 | 2012–04–21 | 1 x 1830 | |||
| " | GS–2012A–Q–46–06 | 32 | 1.25 – 1.65 | 2012–05–15 | 4 x 1830 | 0.63 – 0.76 | |
| " | " | 1.45 – 1.66 | 2012–04–22 | 2 x 1830 | |||
| " | GS2010B–Q–046–03 | 33 | 1.26 | 2011–01–31 | 1 x 1830 | ||
| " | " | 1.35 – 1.64 | 2011–01–29 | 2 x 1525, 1 x 975 | |||
| " | " | 1.23 – 1.24 | 2011–01–27 | 2 x 1830 | |||
| XMMXCS J113602.9–032943.2 | GS–2012A–Q–46–07 | 36 | 1.14 | 2012–05–24 | 1 x 1830 | ||
| " | " | 1.12 | 2012–05–23 | 1 x 1830 | |||
| " | " | 1.12 – 1.16 | 2012–05–20 | 3 x 1830 | |||
| " | " | 1.12 | 2012–05–19 | 1 x 1830 | |||
| " | GS–2012A–Q–46–08 | 33 | 1.48 – 1.76 | 2012–07–15 | 2 x 1830 | ||
| " | " | 1.41 – 1.80 | 2012–07–11 | 3 x 1830 | 0.50 – 0.70 | ||
| " | " | 1.5 | 2012–07–10 | 1 x 1830 | |||
| XMMXCS J134305.1-000056.8 | GS–2012A–Q–46–10 | 36 | 1.16 – 1.23 | 2012–05–24 | 4 x 1830 | ||
| " | " | 1.24 | 2012–05–21 | 1 x 1830 | |||
| " | GS–2012A–Q–46–11 | 34 | 1.25 | 2012–07–10 | 1 x 1830 | ||
| " | " | 1.16 – 1.19 | 2012–07–09 | 2 x 1830 | |||
| " | " | 1.2 | 2012–07–06 | 1 x 1830 | |||
| " | " | 1.54 – 1.84 | 2012–06–22 | 2 x 1830 | |||
| XMMXCS J145009.3+090428.8 | GN2012A–Q–070–05 | 32 | 1.02 – 1.05 | 2012–07–09 | 2 x 1800 | 1.15 | |
| " | " | 1.11 – 1.62 | 2012–06–26 | 4 x 1800 | 0.84 – 0.98 | ||
| " | GN2012A–Q–070–06 | 34 | 1.02 – 1.04 | 2012–07–07 | 2 x 1800 | ||
| " | " | 1.09 – 1.17 | 2012–07–06 | 2 x 1800 | |||
| " | " | 1.48 – 1.79 | 2012–06–27 | 2 x 1800 | |||
| " | GN2012A–Q–070–07 | 33 | 1.22 – 1.59 | 2012–07–22 | 3 x 1800 | ||
| " | " | 1.04 – 1.16 | 2012–07–08 | 3 x 1800 | 1 | ||
| XMMXCS J215221.0–273022.6 | GS2010B–Q–046–04 | 36 | 1.14 – 1.24 | 2010–11–12 | 2 x 1830 | ||
| " | " | 1.02 – 1.21 | 2010–09–14 | 4 x 1830 | |||
| " | GS2011B–Q–050–06 | 34 | 1.07 – 1.15 | 2011–10–05 | 2 x 1830 | ||
| " | " | 1.12 – 1.56 | 2011–09–18 | 4 x 1830 | 0.60 – 1.00 | ||
| " | GS2011B–Q–050–07 | 34 | 1.00 – 1.10 | 2011–10–24 | 4 x 1830 | ||
| " | " | 1.05 – 1.12 | 2011–10–16 | 2 x 1830 | |||
| XMMXCS J230247.7+084355.9 | GN2012A–Q–070–10 | 34 | 1.37 | 2012–08–08 | 1 x 1800 | 0.60 – 0.68 | |
| " | " | 1.02 – 1.11 | 2012–07–30 | 5 x 1800 | 0.43 – 0.86 | ||
| " | GN2012A–Q–070–11 | 33 | 1.18 – 1.31 | 2012–08–13 | 2 x 1800 | ||
| " | " | 1.02 – 1.08 | 2012–08–09 | 3 x 1800 | 0.60 – 0.68 | ||
| " | " | 1.19 | 2012–08–08 | 1 x 1800 | 1 |
Appendix B Redshift catalogue
Tables of galaxy redshifts measured in each cluster to appear in the online version of the article.
| Name | RA(J2000) | Dec(J2000) | z | Reference |
|---|---|---|---|---|
| GALEXASC J000046.26-251058.3 | 00h00m46.26s | -25∘10′59.9′′ | 0.0821 | Colless et al. (2003a) |
| GALEXASC J000057.30-250623.9 | 00h00m57.23s | -25∘06′25.9′′ | 0.0821 | Colless et al. (2003a) |
| 2dFGRS S134Z161 | 23h59m32.60s | -25∘13′02.2′′ | 0.0823 | Colless et al. (2003a) |
| GALEXASC J235957.50-250120.7 | 23h59m57.51s | -25∘01′20.5′′ | 0.0823 | Colless et al. (2003a) |
| 2dFGRS S134Z139 | 00h00m25.25s | -25∘20′48.2′′ | 0.0834 | Colless et al. (2003a) |
| 2MASX J00002408-2510371 | 00h00m24.10s | -25∘10′38.0′′ | 0.0837 | Colless et al. (2003a) |
| 2MASX J00004212-2512080 | 00h00m42.12s | -25∘12′08.1′′ | 0.0837 | Jones et al. (2009) |
| 2MASX J00002446-2516181 | 00h00m24.45s | -25∘16′18.3′′ | 0.0839 | Colless et al. (2003a) |
| AM 2357-252 NED01 | 00h00m13.28s | -25∘11′08.1′′ | 0.0841 | Coziol et al. (2009) |
| 2dFGRS S134Z105 | 00h01m02.68s | -25∘08′59.4′′ | 0.0844 | Colless et al. (2003a) |
| 2MASX J00000684-2515021 | 00h00m06.85s | -25∘15′02.0′′ | 0.0847 | Colless et al. (2003a) |
| 2MASX J00001841-2510051 | 00h00m18.43s | -25∘10′04.9′′ | 0.0847 | Colless et al. (2003a) |
| AM 2357-252 | 00h00m13.70s | -25∘11′10.0′′ | 0.0847 | Colless et al. (2003a) |
| 2MASX J00000093-2521313 | 00h00m00.94s | -25∘21′31.8′′ | 0.0848 | Colless et al. (2003a) |
| AM 2357-252 | 00h00m14.06s | -25∘11′12.6′′ | 0.0851 | Jones et al. (2009) |
| 2dFGRS S134Z131 | 00h00m28.86s | -25∘07′11.2′′ | 0.0854 | Colless et al. (2003a) |
| 2MASX J00003358-2509120 | 00h00m33.59s | -25∘09′12.1′′ | 0.0857 | Colless et al. (2003a) |
| 2MASX J00000817-2512181 | 00h00m08.16s | -25∘12′18.1′′ | 0.0864 | Colless et al. (2003a) |
| 2MASX J00004617-2515090 | 00h00m46.18s | -25∘15′09.3′′ | 0.0869 | Colless et al. (2003a) |
| Name | RA(J2000) | Dec(J2000) | z | Reference |
|---|---|---|---|---|
| GALEXMSC J003407.05-432228.7 | 00h34m06.97s | -43∘22′30.2′′ | 0.3877 | Feruglio et al. (2008) |
| SWIRE3 J003407.30-432152.8 | 00h34m07.29s | -43∘21′52.9′′ | 0.3880 | Sacchi et al. (2009) |
| SWIRE3 J003400.83-432122.5 | 00h34m00.77s | -43∘21′22.5′′ | 0.3890 | Sacchi et al. (2009) |
| SWIRE3 J003408.87-432244.6 | 00h34m08.87s | -43∘22′44.7′′ | 0.3890 | Sacchi et al. (2009) |
| SWIRE3 J003405.07-431742.3 | 00h34m05.06s | -43∘17′42.3′′ | 0.3910 | Sacchi et al. (2009) |
| IRAC 236852 | 00h34m27.40s | -43∘18′59.6′′ | 0.3925 | Feruglio et al. (2008) |
| SWIRE3 J003425.16-431912.1 | 00h34m25.15s | -43∘19′12.2′′ | 0.3930 | Sacchi et al. (2009) |
| SWIRE3 J003422.50-431550.8 | 00h34m22.49s | -43∘15′51.0′′ | 0.3940 | Sacchi et al. (2009) |
| SWIRE3 J003428.37-431704.2 | 00h34m28.36s | -43∘17′04.4′′ | 0.3940 | Sacchi et al. (2009) |
| SWIRE3 J003444.36-431806.2 | 00h34m44.37s | -43∘18′06.4′′ | 0.3940 | Sacchi et al. (2009) |
| SWIRE3 J003413.21-431727.4 | 00h34m13.20s | -43∘17′27.5′′ | 0.3960 | Sacchi et al. (2009) |
| SWIRE3 J003417.67-431909.8 | 00h34m17.67s | -43∘19′09.9′′ | 0.3960 | Sacchi et al. (2009) |
| SWIRE3 J003424.77-432117.8 | 00h34m24.78s | -43∘21′18.2′′ | 0.3960 | Sacchi et al. (2009) |
| SWIRE3 J003430.66-431956.6 | 00h34m30.65s | -43∘19′56.8′′ | 0.3960 | Sacchi et al. (2009) |
| SWIRE3 J003419.36-432157.4 | 00h34m19.35s | -43∘21′57.6′′ | 0.3970 | Sacchi et al. (2009) |
| SWIRE3 J003426.75-431854.7 | 00h34m26.74s | -43∘18′54.6′′ | 0.3970 | Sacchi et al. (2009) |
| SWIRE3 J003407.33-432141.6 | 00h34m07.33s | -43∘21′41.7′′ | 0.3980 | Sacchi et al. (2009) |
| SWIRE3 J003417.78-431928.4 | 00h34m17.77s | -43∘19′28.5′′ | 0.3980 | Sacchi et al. (2009) |
| ESIS J003412.63-431705.5 | 00h34m12.63s | -43∘17′05.5′′ | 0.3990 | Sacchi et al. (2009) |
| SWIRE3 J003425.85-432057.8 | 00h34m25.86s | -43∘20′58.0′′ | 0.3990 | Sacchi et al. (2009) |
| SWIRE3 J003424.03-431914.9 | 00h34m24.02s | -43∘19′15.0′′ | 0.4010 | Sacchi et al. (2009) |
| SWIRE3 J003442.95-431727.6 | 00h34m42.94s | -43∘17′27.2′′ | 0.4020 | Sacchi et al. (2009) |
| Name | RA(J2000) | Dec(J2000) | z | Reference |
|---|---|---|---|---|
| Cl 0053-37:[CHM98] 12 | 00h55m55.56s | -37∘32′19.7′′ | 0.1613 | Guzzo et al. (2009) |
| Cl 0053-37:[CHM98] 14 | 00h55m57.74s | -37∘32′22.6′′ | 0.1613 | Guzzo et al. (2009) |
| Cl 0053-37:[CHM98] 08 | 00h55m58.90s | -37∘33′00.7′′ | 0.1617 | Cappi et al. (1998) |
| (GSB2009) J005552.68-373143.0 | 00h55m52.68s | -37∘31′43.0′′ | 0.1626 | Guzzo et al. (2009) |
| 2MASX J00555916-3732186 | 00h55m59.11s | -37∘32′18.2′′ | 0.1631 | Cappi et al. (1998) |
| APMUKS(BJ) B005339.96-374945.2 | 00h56m01.56s | -37∘33′32.0′′ | 0.1633 | Guzzo et al. (2009) |
| Cl 0053-37:[CHM98] 15 | 00h55m59.32s | -37∘32′35.2′′ | 0.1636 | Cappi et al. (1998) |
| APMUKS(BJ) B005340.88-374818.8 | 00h56m02.42s | -37∘32′04.6′′ | 0.1638 | Cappi et al. (1998) |
| Cl 0053-37:[CHM98] 20 | 00h55m56.26s | -37∘31′48.0′′ | 0.1649 | Cappi et al. (1998) |
| 2XMM J005557.1-373237 | 00h55m56.74s | -37∘32′35.4′′ | 0.1653 | Cappi et al. (1998) |
| Cl 0053-37:[CHM98] 09 | 00h56m02.76s | -37∘33′03.9′′ | 0.1654 | Cappi et al. (1998) |
| 2MASX J00560639-3733176 | 00h56m06.41s | -37∘33′17.6′′ | 0.1661 | Guzzo et al. (2009) |
| Cl 0053-37:[CHM98] 21 | 00h56m09.54s | -37∘31′49.0′′ | 0.1663 | Cappi et al. (1998) |
| (GSB2009) J005559.52-373343.2 | 00h55m59.52s | -37∘33′43.2′′ | 0.1665 | Guzzo et al. (2009) |
| APMUKS(BJ) B005339.81-374854.8 | 00h56m01.34s | -37∘32′40.9′′ | 0.1673 | Cappi et al. (1998) |
| APMUKS(BJ) B005343.30-374914.5 | 00h56m04.82s | -37∘33′00.0′′ | 0.1682 | Guzzo et al. (2009) |
| (GSB2009) J005552.42-373131.8 | 00h55m52.42s | -37∘31′31.8′′ | 0.1686 | Guzzo et al. (2009) |
| Cl 0053-37:[CHM98] 04 | 00h56m09.71s | -37∘33′39.9′′ | 0.1691 | Cappi et al. (1998) |
| 2MASX J00560925-3733595 | 00h56m09.28s | -37∘33′59.3′′ | 0.1694 | Cappi et al. (1998) |
| APMUKS(BJ) B005348.77-375021.3 | 00h56m10.23s | -37∘34′07.9′′ | 0.1720 | Cappi et al. (1998) |
| Cl 0053-37:[CHM98] 11 | 00h56m04.75s | -37∘32′51.0′′ | 0.1721 | Cappi et al. (1998) |
| Cl 0053-37:[CHM98] 03 | 00h56m07.07s | -37∘33′49.4′′ | 0.1722 | Cappi et al. (1998) |
| Name | RA(J2000) | Dec(J2000) | z | Reference |
|---|---|---|---|---|
| 2MASX J01530967+0102002 | 01h53m09.69s | +01∘02′00.3′′ | 0.0579 | Berlind et al. (2006) |
| 2MASX J01531414+0103443 | 01h53m14.16s | +01∘03′44.4′′ | 0.0579 | Abazajian et al. (2003) |
| 2MASX J01531014+0101302 | 01h53m10.13s | +01∘01′30.5′′ | 0.0586 | Abazajian et al. (2003) |
| 2MASX J01530528+0059092 | 01h53m05.29s | +00∘59′09.2′′ | 0.0588 | Stoughton et al. (2002) |
| 2MASX J01531034+0105562 | 01h53m10.37s | +01∘05′56.7′′ | 0.0590 | Abazajian et al. (2003) |
| 2MASX J01530827+0101502 | 01h53m08.29s | +01∘01′50.7′′ | 0.0594 | Berlind et al. (2006) |
| SDSS J015251.27+010705.4 | 01h52m51.28s | +01∘07′05.4′′ | 0.0595 | Stoughton et al. (2002) |
| SDSS J015316.74+010139.4 | 01h53m16.75s | +01∘01′39.5′′ | 0.0596 | Berlind et al. (2006) |
| 2MASX J01530347+0101232 | 01h53m03.49s | +01∘01′23.0′′ | 0.0596 | Abazajian et al. (2003) |
| 2MASX J01531521+0102203 | 01h53m15.24s | +01∘02′20.7′′ | 0.0598 | Abazajian et al. (2003) |
| SDSS J015249.63+010023.3 | 01h52m49.61s | +01∘00′22.6′′ | 0.0600 | Goto et al. (2003) |
| 2MASX J01532128+0055143 | 01h53m21.27s | +00∘55′14.6′′ | 0.0607 | Stoughton et al. (2002) |
| Name | RA(J2000) | Dec(J2000) | z | Reference |
|---|---|---|---|---|
| (MLF2006) J072049.93+710856.6 | 07h20m49.93s | +71∘08′56.6′′ | 0.2270 | Mulchaey et al. (2006) |
| 1RXS J072049.0+710724 | 07h20m47.35s | +71∘07′15.4′′ | 0.2274 | Jeltema et al. (2007) |
| (MLF2006) J072103.45+710906.0 | 07h21m03.45s | +71∘09′06.0′′ | 0.2274 | Mulchaey et al. (2006) |
| (MLF2006) J072044.89+710845.5 | 07h20m44.89s | +71∘08′45.5′′ | 0.2275 | Mulchaey et al. (2006) |
| (MLF2006) J072039.75+710950.8 | 07h20m39.75s | +71∘09′50.8′′ | 0.2277 | Mulchaey et al. (2006) |
| (MLF2006) J072046.96+710922.8 | 07h20m46.96s | +71∘09′22.8′′ | 0.2285 | Jeltema et al. (2007) |
| (MLF2006) J072059.93+710932.2 | 07h20m59.93s | +71∘09′32.2′′ | 0.2288 | Mulchaey et al. (2006) |
| (JML2007) J072044.89+710930.9 | 07h20m44.89s | +71∘09′30.9′′ | 0.2294 | Jeltema et al. (2007) |
| (JML2007) J072048.69+711123.2 | 07h20m48.69s | +71∘11′23.2′′ | 0.2299 | Jeltema et al. (2007) |
| GALEXASC J072040.85+711127.4 | 07h20m40.46s | +71∘11′27.9′′ | 0.2300 | Jeltema et al. (2007) |
| (MLF2006) J072053.73+710859.6 | 07h20m53.73s | +71∘08′59.6′′ | 0.2300 | Jeltema et al. (2007) |
| (MLF2006) J072114.17+711028.0 | 07h21m14.17s | +71∘10′28.0′′ | 0.2304 | Mulchaey et al. (2006) |
| (MLF2006) J072054.47+710857.4 | 07h20m54.47s | +71∘08′57.4′′ | 0.2305 | Mulchaey et al. (2006) |
| (JML2007) J072045.08+711118.1 | 07h20m45.08s | +71∘11′18.1′′ | 0.2306 | Jeltema et al. (2007) |
| (JML2007) J072046.39+711005.0 | 07h20m46.39s | +71∘10′05.0′′ | 0.2307 | Jeltema et al. (2007) |
| (MLF2006) J072103.43+710917.7 | 07h21m03.43s | +71∘09′17.7′′ | 0.2308 | Mulchaey et al. (2006) |
| GALEXMSC J072113.65+710952.5 | 07h21m13.26s | +71∘09′49.8′′ | 0.2314 | Mulchaey et al. (2006) |
| (MLF2006) J072109.63+710903.3 | 07h21m09.63s | +71∘09′03.3′′ | 0.2315 | Mulchaey et al. (2006) |
| (MLF2006) J072109.09+710922.1 | 07h21m09.09s | +71∘09′22.1′′ | 0.2320 | Mulchaey et al. (2006) |
| (JML2007) J072039.35+710730.9 | 07h20m39.35s | +71∘07′30.9′′ | 0.2323 | Jeltema et al. (2007) |
| GALEXASC J072111.89+710857.1 | 07h21m11.40s | +71∘08′57.2′′ | 0.2325 | Mulchaey et al. (2006) |
| (MLF2006) J072048.06+711037.5 | 07h20m48.06s | +71∘10′37.5′′ | 0.2326 | Jeltema et al. (2007) |
| (MLF2006) J072058.02+710916.2 | 07h20m58.02s | +71∘09′16.2′′ | 0.2328 | Jeltema et al. (2007) |
| (MLF2006) J072050.33+710925.7 | 07h20m50.33s | +71∘09′25.7′′ | 0.2329 | Jeltema et al. (2007) |
| (JML2007) J072056.17+711105.1 | 07h20m56.17s | +71∘11′05.1′′ | 0.2331 | Jeltema et al. (2007) |
| (JML2007) J072055.02+710815.0 | 07h20m55.02s | +71∘08′15.0′′ | 0.2335 | Jeltema et al. (2007) |
| (MLF2006) J072046.75+710904.4 | 07h20m46.75s | +71∘09′04.4′′ | 0.2337 | Jeltema et al. (2007) |
| GALEXMSC J072016.54+710943.2 | 07h20m16.53s | +71∘09′42.6′′ | 0.2340 | Mulchaey et al. (2006) |
| (MLF2006) J072044.19+710854.1 | 07h20m44.19s | +71∘08′54.1′′ | 0.2347 | Mulchaey et al. (2006) |
| Name | RA(J2000) | Dec(J2000) | z | Reference |
|---|---|---|---|---|
| (VMF98) 049:[BBS2002] 021 | 08h19m42.12s | +70∘54′32.1′′ | 0.2272 | Balogh et al. (2002) |
| (VMF98) 049:[BBS2002] 040 | 08h19m11.99s | +70∘55′43.8′′ | 0.2274 | Balogh et al. (2002) |
| (VMF98) 049:[BBS2002] 027 | 08h19m01.38s | +70∘54′51.6′′ | 0.2277 | Balogh et al. (2002) |
| (VMF98) 049:[BBS2002] 002 | 08h18m48.72s | +70∘52′55.8′′ | 0.2278 | Balogh et al. (2002) |
| (VMF98) 049:[BBS2002] 026 | 08h19m22.86s | +70∘54′44.9′′ | 0.2280 | Balogh et al. (2002) |
| (VMF98) 049:[BBS2002] 033 | 08h19m17.75s | +70∘55′01.0′′ | 0.2289 | Balogh et al. (2002) |
| (VMF98) 049:[BBS2002] 013 | 08h19m46.92s | +70∘53′53.9′′ | 0.2294 | Balogh et al. (2002) |
| (VMF98) 049:[BBS2002] 025 | 08h18m56.12s | +70∘54′39.4′′ | 0.2296 | Balogh et al. (2002) |
| (VMF98) 049:[BBS2002] 029 | 08h18m54.03s | +70∘54′52.6′′ | 0.2297 | Balogh et al. (2002) |
| (VMF98) 049:[BBS2002] 011 | 08h19m07.76s | +70∘53′37.7′′ | 0.2304 | Balogh et al. (2002) |
| 2MASX J08191836+7055042 | 08h19m18.31s | +70∘55′04.2′′ | 0.2304 | Balogh et al. (2002) |
| (VMF98) 049:[BBS2002] 036 | 08h19m23.75s | +70∘55′24.3′′ | 0.2304 | Balogh et al. (2002) |
| (VMF98) 049:[BBS2002] 015 | 08h19m35.25s | +70∘54′02.4′′ | 0.2305 | Balogh et al. (2002) |
| (VMF98) 049:[BBS2002] 047 | 08h19m23.60s | +70∘56′30.8′′ | 0.2306 | Balogh et al. (2002) |
| (VMF98) 049:[BBS2002] 012 | 08h19m37.97s | +70∘53′49.5′′ | 0.2309 | Balogh et al. (2002) |
| (VMF98) 049:[BBS2002] 037 | 08h19m05.95s | +70∘55′34.5′′ | 0.2310 | Balogh et al. (2002) |
| (VMF98) 049:[BBS2002] 043 | 08h19m12.64s | +70∘56′05.8′′ | 0.2313 | Balogh et al. (2002) |
| (VMF98) 049:[BBS2002] 006 | 08h19m06.49s | +70∘53′04.1′′ | 0.2319 | Balogh et al. (2002) |
| (VMF98) 049:[BBS2002] 016 | 08h19m04.37s | +70∘53′55.0′′ | 0.2320 | Balogh et al. (2002) |
| Name | RA(J2000) | Dec(J2000) | z | Reference |
|---|---|---|---|---|
| SDSS J094400.28+164011.1 | 09h44m00.29s | +16∘40′11.2′′ | 0.2487 | Verdugo et al. (2008) |
| SDSS J094334.06+164035.7 | 09h43m34.06s | +16∘40′35.7′′ | 0.2500 | Verdugo et al. (2008) |
| SDSS J094353.35+163958.8 | 09h43m53.35s | +16∘39′58.8′′ | 0.2511 | Verdugo et al. (2008) |
| SDSS J094345.51+164130.4 | 09h43m45.52s | +16∘41′30.5′′ | 0.2514 | Verdugo et al. (2008) |
| SDSS J094353.48+164022.7 | 09h43m53.49s | +16∘40′22.7′′ | 0.2516 | Verdugo et al. (2008) |
| SDSS J094358.03+164116.5 | 09h43m58.03s | +16∘41′16.6′′ | 0.2520 | Verdugo et al. (2008) |
| 2MASX J09435839+1641091 | 09h43m58.33s | +16∘41′09.1′′ | 0.2527 | Verdugo et al. (2008) |
| SDSS J094351.68+164144.7 | 09h43m51.68s | +16∘41′44.7′′ | 0.2529 | Verdugo et al. (2008) |
| SDSS J094353.53+164142.6 | 09h43m53.53s | +16∘41′42.7′′ | 0.2529 | Verdugo et al. (2008) |
| SDSS J094333.62+163906.3 | 09h43m33.62s | +16∘39′06.3′′ | 0.2530 | Verdugo et al. (2008) |
| SDSS J094338.73+163854.9 | 09h43m38.74s | +16∘38′55.0′′ | 0.2533 | Verdugo et al. (2008) |
| SDSS J094401.36+163800.9 | 09h44m01.37s | +16∘38′01.0′′ | 0.2536 | Verdugo et al. (2008) |
| SDSS J094352.54+164439.4 | 09h43m52.54s | +16∘44′39.5′′ | 0.2538 | Verdugo et al. (2008) |
| SDSS J094358.77+164001.9 | 09h43m58.78s | +16∘40′01.9′′ | 0.2538 | Verdugo et al. (2008) |
| SDSS J094332.40+164000.5 | 09h43m32.41s | +16∘40′00.6′′ | 0.2539 | Verdugo et al. (2008) |
| SDSS J094359.68+163729.9 | 09h43m59.69s | +16∘37′29.9′′ | 0.2542 | Verdugo et al. (2008) |
| SDSS J094348.66+164038.8 | 09h43m48.67s | +16∘40′38.8′′ | 0.2546 | Verdugo et al. (2008) |
| SDSS J094355.86+164035.5 | 09h43m55.86s | +16∘40′35.6′′ | 0.2551 | Verdugo et al. (2008) |
| SDSS J094336.77+164102.3 | 09h43m36.78s | +16∘41′02.3′′ | 0.2552 | Verdugo et al. (2008) |
| SDSS J094356.38+163650.7 | 09h43m56.38s | +16∘36′50.8′′ | 0.2552 | Verdugo et al. (2008) |
| SDSS J094358.90+163921.7 | 09h43m58.90s | +16∘39′21.7′′ | 0.2561 | Verdugo et al. (2008) |
| SDSS J094405.00+163834.3 | 09h44m05.00s | +16∘38′34.4′′ | 0.2561 | Verdugo et al. (2008) |
| SDSS J094359.32+164109.4 | 09h43m59.33s | +16∘41′09.4′′ | 0.2570 | Verdugo et al. (2008) |
| SDSS J094342.95+164034.1 | 09h43m42.96s | +16∘40′34.1′′ | 0.2573 | Verdugo et al. (2008) |
| SDSS J094403.16+163948.1 | 09h44m03.17s | +16∘39′48.1′′ | 0.2574 | Verdugo et al. (2008) |
| SDSS J094337.95+163932.2 | 09h43m37.95s | +16∘39′32.3′′ | 0.2574 | Verdugo et al. (2008) |
| SDSS J094340.06+163923.2 | 09h43m40.06s | +16∘39′23.3′′ | 0.2578 | Verdugo et al. (2008) |
| Name | RA(J2000) | Dec(J2000) | z | Reference |
|---|---|---|---|---|
| SDSS J100027.86+251750.9 | 10h00m27.87s | +25∘17′51.0′′ | 0.0495 | Le Fevre et al. (1995) |
| 2MASX J09590595+2512006 | 09h59m05.97s | +25∘12′01.0′′ | 0.0511 | Adelman-McCarthy et al. (2008) |
| 2MASX J09585969+2518276 | 09h58m59.70s | +25∘18′27.8′′ | 0.0518 | Adelman-McCarthy et al. (2008) |
| SDSS J095848.25+251116.9 | 09h58m48.25s | +25∘11′16.9′′ | 0.0518 | Adelman-McCarthy et al. (2008) |
| 2MASX J09594076+2459301 | 09h59m40.76s | +24∘59′30.5′′ | 0.0519 | Adelman-McCarthy et al. (2008) |
| 2MASX J10001346+2450242 | 10h00m13.49s | +24∘50′24.1′′ | 0.0519 | Adelman-McCarthy et al. (2008) |
| UGC 05361 | 09h59m00.86s | +25∘12′08.2′′ | 0.0519 | Huchra et al. (2012) |
| 2MASX J09590450+2527176 | 09h59m04.50s | +25∘27′18.2′′ | 0.0519 | Adelman-McCarthy et al. (2008) |
| SDSS J100144.49+250159.3 | 10h01m44.49s | +25∘01′59.3′′ | 0.0526 | Adelman-McCarthy et al. (2008) |
| 2MASX J09591647+2509482 | 09h59m16.44s | +25∘09′48.8′′ | 0.0528 | Adelman-McCarthy et al. (2008) |
| SDSS J095900.71+251134.6 | 09h59m00.72s | +25∘11′34.7′′ | 0.0529 | Adelman-McCarthy et al. (2008) |
| 2MASX J10010959+2520030 | 10h01m09.60s | +25∘20′03.3′′ | 0.0542 | Adelman-McCarthy et al. (2008) |
| SDSS J100105.06+245810.3 | 10h01m05.06s | +24∘58′10.4′′ | 0.0549 | Adelman-McCarthy et al. (2008) |
| SDSS J095938.75+251010.8 | 09h59m38.75s | +25∘10′10.9′′ | 0.0555 | Adelman-McCarthy et al. (2008) |
| 2MASX J10000767+2514162 | 10h00m07.65s | +25∘14′16.4′′ | 0.0556 | Adelman-McCarthy et al. (2008) |
| Name | RA(J2000) | Dec(J2000) | z | Reference |
|---|---|---|---|---|
| SDSS J100052.66+013941.1 | 10h00m52.67s | +01∘39′41.2′′ | 0.2166 | Lilly et al. (2007) |
| zCOSMOS 805589 | 10h00m33.07s | +01∘41′04.8′′ | 0.2179 | Lilly et al. (2007) |
| SDSS J100057.84+013637.1 | 10h00m57.84s | +01∘36′37.2′′ | 0.2190 | Lilly et al. (2007) |
| 2MASX J10004852+0139137 | 10h00m48.54s | +01∘39′13.9′′ | 0.2190 | Colless et al. (2003b) |
| SDSS J100037.77+014013.9 | 10h00m37.77s | +01∘40′14.0′′ | 0.2194 | Lilly et al. (2007) |
| SDSS J100057.85+013752.1 | 10h00m57.85s | +01∘37′52.2′′ | 0.2195 | Lilly et al. (2007) |
| SDSS J100045.29+013847.4 | 10h00m45.30s | +01∘38′47.4′′ | 0.2205 | Abazajian et al. (2004) |
| 2MASX J10004552+0139267 | 10h00m45.54s | +01∘39′26.5′′ | 0.2207 | Abazajian et al. (2003) |
| zCOSMOS 805608 | 10h00m32.16s | +01∘38′43.5′′ | 0.2212 | Lilly et al. (2007) |
| SDSS J100044.55+013942.0 | 10h00m44.55s | +01∘39′42.2′′ | 0.2214 | Trump et al. (2007) |
| SDSS J100038.81+013827.6 | 10h00m38.81s | +01∘38′27.6′′ | 0.2219 | Lilly et al. (2007) |
| SDSS J100049.03+013526.8 | 10h00m49.03s | +01∘35′26.9′′ | 0.2220 | Brusa et al. (2010) |
| SDSS J100103.45+014413.1 | 10h01m03.45s | +01∘44′13.1′′ | 0.2220 | Lilly et al. (2007) |
| zCOSMOS 805183 | 10h00m50.21s | +01∘43′20.6′′ | 0.2224 | Lilly et al. (2007) |
| zCOSMOS 805250 | 10h00m47.36s | +01∘37′41.6′′ | 0.2235 | Lilly et al. (2007) |
| SDSS J100108.66+013935.2 | 10h01m08.67s | +01∘39′35.2′′ | 0.2278 | Abazajian et al. (2004) |
| Name | RA(J2000) | Dec(J2000) | z | Reference |
|---|---|---|---|---|
| SDSS J100125.41+023145.1 | 10h01m25.42s | +02∘31′45.2′′ | 0.1210 | Abazajian et al. (2004) |
| SDSS J100131.47+022556.7 | 10h01m31.48s | +02∘25′56.7′′ | 0.1211 | Trump et al. (2007) |
| SDSS J100157.95+022746.1 | 10h01m57.96s | +02∘27′46.1′′ | 0.1213 | Lilly et al. (2007) |
| SDSS J100120.63+022601.5 | 10h01m20.63s | +02∘26′01.6′′ | 0.1216 | Lilly et al. (2007) |
| GALEXMSC J100120.08+022019.9 | 10h01m20.07s | +02∘20′20.0′′ | 0.1224 | Lilly et al. (2007) |
| SDSS J100131.65+022001.3 | 10h01m31.66s | +02∘20′01.3′′ | 0.1224 | Lilly et al. (2007) |
| SDSS J100135.32+022831.2 | 10h01m35.33s | +02∘28′31.2′′ | 0.1225 | Lilly et al. (2007) |
| SDSS J100138.98+022607.8 | 10h01m38.99s | +02∘26′07.8′′ | 0.1228 | Lilly et al. (2007) |
| SDSS J100130.65+022624.2 | 10h01m30.65s | +02∘26′24.2′′ | 0.1228 | Abazajian et al. (2004) |
| SDSS J100117.12+022919.1 | 10h01m17.13s | +02∘29′19.2′′ | 0.1230 | Lilly et al. (2007) |
| SDSS J100141.85+022519.5 | 10h01m41.86s | +02∘25′19.5′′ | 0.1232 | Abazajian et al. (2004) |
| 2MASX J10013646+0226418 | 10h01m36.46s | +02∘26′42.2′′ | 0.1234 | Abazajian et al. (2003) |
| 2MASX J10013692+0230318 | 10h01m36.93s | +02∘30′31.9′′ | 0.1237 | Abazajian et al. (2003) |
| SDSS J100119.77+022756.1 | 10h01m19.77s | +02∘27′56.1′′ | 0.1237 | Lilly et al. (2007) |
| zCOSMOS 830563 | 10h01m20.30s | +02∘27′14.6′′ | 0.1237 | Lilly et al. (2007) |
| 2MASX J10013974+0225487 | 10h01m39.76s | +02∘25′48.8′′ | 0.1242 | Abazajian et al. (2003) |
| SDSS J100143.45+022409.8 | 10h01m43.45s | +02∘24′09.9′′ | 0.1245 | Abazajian et al. (2004) |
| SDSS J100115.65+022423.0 | 10h01m15.66s | +02∘24′23.1′′ | 0.1245 | Lilly et al. (2007) |
| SDSS J100144.43+022654.0 | 10h01m44.43s | +02∘26′54.0′′ | 0.1246 | Trump et al. (2007) |
| SDSS J100132.33+023306.1 | 10h01m32.33s | +02∘33′06.2′′ | 0.1253 | Lilly et al. (2007) |
| SDSS J100123.59+022416.8 | 10h01m23.59s | +02∘24′16.8′′ | 0.1264 | Lilly et al. (2007) |
| SDSS J100135.42+022246.8 | 10h01m35.42s | +02∘22′46.8′′ | 0.1265 | Lilly et al. (2007) |
| SDSS J100147.06+022257.6 | 10h01m47.07s | +02∘22′57.7′′ | 0.1269 | Lilly et al. (2007) |
| SDSS J100123.20+022414.9 | 10h01m23.20s | +02∘24′14.9′′ | 0.1273 | Lilly et al. (2007) |
| SDSS J100154.07+021935.8 | 10h01m54.07s | +02∘19′35.9′′ | 0.1281 | Lilly et al. (2007) |
| SDSS J100127.72+023126.4 | 10h01m27.73s | +02∘31′26.5′′ | 0.1298 | Lilly et al. (2007) |
| Name | RA(J2000) | Dec(J2000) | z | Reference |
|---|---|---|---|---|
| 2MASX J10403601+4002107 | 10h40m35.98s | +40∘02′10.8′′ | 0.1331 | Adelman-McCarthy et al. (2006) |
| SDSS J104045.34+395448.5 | 10h40m45.35s | +39∘54′48.6′′ | 0.1341 | Sánchez Almeida et al. (2011) |
| B3 1037+401 | 10h40m44.45s | +39∘54′54.9′′ | 0.1341 | Adelman-McCarthy et al. (2006) |
| SDSS J104126.57+395845.5 | 10h41m26.58s | +39∘58′45.5′′ | 0.1352 | Miller et al. (2002) |
| SDSS J104043.44+395705.3 | 10h40m43.44s | +39∘57′05.3′′ | 0.1357 | Adelman-McCarthy et al. (2006) |
| 2MASX J10403391+4003497 | 10h40m33.96s | +40∘03′49.5′′ | 0.1369 | Miller et al. (2002) |
| 2MASX J10405360+4001417 | 10h40m53.62s | +40∘01′42.0′′ | 0.1374 | Adelman-McCarthy et al. (2006) |
| SDSS J104044.49+395711.2 | 10h40m44.50s | +39∘57′11.3′′ | 0.1380 | Ofek et al. (2007) |
| SDSS J103943.42+400435.2 | 10h39m43.42s | +40∘04′35.2′′ | 0.1384 | Adelman-McCarthy et al. (2006) |
| 2MASX J10414241+4000453 | 10h41m42.43s | +40∘00′45.8′′ | 0.1385 | Adelman-McCarthy et al. (2006) |
| 2MASX J10404446+3957117 | 10h40m44.50s | +39∘57′11.3′′ | 0.1386 | Schaerer et al. (1999) |
| SDSS J104047.01+395551.8 | 10h40m47.01s | +39∘55′51.8′′ | 0.1386 | Adelman-McCarthy et al. (2006) |
| SDSS J104114.47+395901.6 | 10h41m14.48s | +39∘59′01.6′′ | 0.1401 | Adelman-McCarthy et al. (2006) |
| SDSS J104027.21+400459.3 | 10h40m27.22s | +40∘04′59.4′′ | 0.1416 | Adelman-McCarthy et al. (2006) |
| SDSS J104006.83+395356.8 | 10h40m06.84s | +39∘53′56.9′′ | 0.1420 | Adelman-McCarthy et al. (2006) |
| 2MASX J10412053+3947284 | 10h41m20.49s | +39∘47′29.3′′ | 0.1433 | Adelman-McCarthy et al. (2006) |
| SDSS J103945.82+400047.0 | 10h39m45.83s | +40∘00′47.1′′ | 0.1441 | Adelman-McCarthy et al. (2006) |
| Name | RA(J2000) | Dec(J2000) | z | Reference |
|---|---|---|---|---|
| SDSS J111512.70+531930.5 | 11h15m12.71s | +53∘19′30.6′′ | 0.4586 | Bayliss et al. (2011) |
| SDSS J111520.84+532100.9 | 11h15m20.84s | +53∘21′01.0′′ | 0.4601 | Bayliss et al. (2011) |
| SDSS J111517.30+532115.2 | 11h15m17.30s | +53∘21′15.3′′ | 0.4639 | Bayliss et al. (2011) |
| SDSS J111517.85+531949.3 | 11h15m17.85s | +53∘19′49.4′′ | 0.4640 | Bayliss et al. (2011) |
| SDSS J111507.37+531955.7 | 11h15m07.38s | +53∘19′55.8′′ | 0.4642 | Bayliss et al. (2011) |
| SDSS J111505.53+532042.4 | 11h15m05.54s | +53∘20′42.4′′ | 0.4654 | Bayliss et al. (2011) |
| SDSS J111514.49+531948.8 | 11h15m14.49s | +53∘19′48.9′′ | 0.4654 | Bayliss et al. (2011) |
| SDSS J111514.51+531853.1 | 11h15m14.51s | +53∘18′53.1′′ | 0.4660 | Bayliss et al. (2011) |
| SDSS J111514.84+531954.3 | 11h15m14.85s | +53∘19′54.3′′ | 0.4664 | Abazajian et al. (2005) |
| SDSS J111519.70+531837.9 | 11h15m19.71s | +53∘18′37.9′′ | 0.4670 | Bayliss et al. (2011) |
| SDSS J111504.19+532100.4 | 11h15m04.20s | +53∘21′00.5′′ | 0.4671 | Bayliss et al. (2011) |
| SDSS J111518.75+531948.3 | 11h15m18.76s | +53∘19′48.4′′ | 0.4686 | Abazajian et al. (2005) |
| SDSS J111509.79+531925.2 | 11h15m09.79s | +53∘19′25.3′′ | 0.4702 | Bayliss et al. (2011) |
| SDSS J111515.10+532002.8 | 11h15m15.10s | +53∘20′02.8′′ | 0.4708 | Bayliss et al. (2011) |
| SDSS J111512.25+531830.8 | 11h15m12.26s | +53∘18′30.9′′ | 0.4745 | Bayliss et al. (2011) |
| (BHG2011) J111510.10+531939.9 | 11h15m10.11s | +53∘19′39.9′′ | 0.4759 | Bayliss et al. (2011) |
| Name | RA(J2000) | Dec(J2000) | z | Reference |
|---|---|---|---|---|
| 2MASX J11511361+5507364 | 11h51m13.65s | +55∘07′36.5′′ | 0.0757 | Abazajian et al. (2005) |
| 2MASX J11513633+5505433 | 11h51m36.33s | +55∘05′43.3′′ | 0.0781 | Abazajian et al. (2005) |
| SDSS J115109.52+550645.0 | 11h51m09.52s | +55∘06′45.1′′ | 0.0782 | Abazajian et al. (2005) |
| SDSS J115107.14+550839.1 | 11h51m07.14s | +55∘08′39.3′′ | 0.0783 | Abazajian et al. (2005) |
| 2MASX J11510461+5510363 | 11h51m04.57s | +55∘10′36.0′′ | 0.0787 | Abazajian et al. (2005) |
| 2MASX J11505351+5512012 | 11h50m53.45s | +55∘12′01.3′′ | 0.0793 | Abazajian et al. (2005) |
| 2MASX J11511349+5506594 | 11h51m13.47s | +55∘06′59.2′′ | 0.0794 | Abazajian et al. (2005) |
| (KK81) 1 | 11h51m25.80s | +55∘06′19.0′′ | 0.0794 | Schweizer (1996) |
| SDSS J115146.44+550644.2 | 11h51m46.45s | +55∘06′44.2′′ | 0.0796 | Abazajian et al. (2005) |
| 2MASX J11515770+5508085 | 11h51m57.70s | +55∘08′08.4′′ | 0.0797 | Abazajian et al. (2005) |
| 2MASX J11512829+5504483 | 11h51m28.30s | +55∘04′48.2′′ | 0.0797 | Abazajian et al. (2005) |
| SDSS J115132.91+550757.0 | 11h51m32.92s | +55∘07′57.1′′ | 0.0798 | Abazajian et al. (2005) |
| SDSS J115213.62+551312.7 | 11h52m13.62s | +55∘13′12.7′′ | 0.0803 | Abazajian et al. (2005) |
| 2MASX J11512340+5506563 | 11h51m23.38s | +55∘06′56.0′′ | 0.0806 | Abazajian et al. (2005) |
| 2MASX J11511641+5509594 | 11h51m16.45s | +55∘09′59.0′′ | 0.0811 | Abazajian et al. (2005) |
| SDSS J115201.62+550414.1 | 11h52m01.63s | +55∘04′14.2′′ | 0.0814 | Abazajian et al. (2005) |
| Name | RA(J2000) | Dec(J2000) | z | Reference |
|---|---|---|---|---|
| SDSS J123140.79+413626.3 | 12:31m40.80s | +41∘36′26.4′′ | 0.1708 | Adelman-McCarthy et al. (2006) |
| 2MASX J12320414+4133324 | 12:32m04.12s | +41∘33′32.4′′ | 0.1713 | Adelman-McCarthy et al. (2006) |
| 2MASX J12315661+4133582 | 12:31m56.59s | +41∘33′58.5′′ | 0.1719 | Adelman-McCarthy et al. (2006) |
| 2MASX J12320054+4133322 | 12:32m00.56s | +41∘33′31.9′′ | 0.1727 | Adelman-McCarthy et al. (2006) |
| 2MASX J12320463+4133362 | 12:32m04.68s | +41∘33′36.0′′ | 0.1732 | Adelman-McCarthy et al. (2007) |
| 2MASX J12315296+4133182 | 12:31m52.98s | +41∘33′18.7′′ | 0.1739 | Adelman-McCarthy et al. (2006) |
| 2MASX J12314144+4139361 | 12:31m41.46s | +41∘39′35.9′′ | 0.1750 | Adelman-McCarthy et al. (2006) |
| SDSS J123151.89+413434.7 | 12:31m51.90s | +41∘34′34.7′′ | 0.1750 | Adelman-McCarthy et al. (2006) |
| 2MASX J12314386+4137341 | 12:31m43.90s | +41∘37′33.9′′ | 0.1757 | Adelman-McCarthy et al. (2006) |
| SDSS J123136.04+414314.0 | 12:31m36.05s | +41∘43′14.0′′ | 0.1763 | Adelman-McCarthy et al. (2006) |
| Name | RA(J2000) | Dec(J2000) | z | Reference |
|---|---|---|---|---|
| SDSS J151623.79+000156.4 | 15h16m23.79s | +00∘01′56.5′′ | 0.1126 | Stoughton et al. (2002) |
| SDSS J151626.35-000228.8 | 15h16m26.35s | -00∘02′28.9′′ | 0.1142 | Stoughton et al. (2002) |
| 2MASX J15161900+0005067 | 15h16m19.00s | +00∘05′06.6′′ | 0.1147 | Abazajian et al. (2003) |
| 2MASX J15162348+0006093 | 15h16m23.49s | +00∘06′09.1′′ | 0.1154 | Abazajian et al. (2003) |
| 2MASX J15161563+0005291 | 15h16m15.63s | +00∘05′29.0′′ | 0.1158 | Abazajian et al. (2003) |
| 2MASX J15162547+0003377 | 15h16m25.45s | +00∘03′37.6′′ | 0.1167 | Abazajian et al. (2003) |
| SDSS J151626.17+000707.4 | 15h16m26.18s | +00∘07′07.5′′ | 0.1167 | Stoughton et al. (2002) |
| 2MASX J15161988+0003343 | 15h16m19.92s | +00∘03′34.5′′ | 0.1174 | Abazajian et al. (2003) |
| SDSS J151602.71+001518.3 | 15h16m02.71s | +00∘15′18.4′′ | 0.1178 | Abazajian et al. (2003) |
| 2MASX J15160423+0002561 | 15h16m04.21s | +00∘02′56.4′′ | 0.1183 | Abazajian et al. (2003) |
| 2MASX J15171323+0009193 | 15h17m13.25s | +00∘09′19.7′′ | 0.1186 | Abazajian et al. (2003) |
| SDSS J151640.19-000404.8 | 15h16m40.19s | -00∘04′04.8′′ | 0.1188 | Stoughton et al. (2002) |
| 2MASX J15160950+0014541 | 15h16m09.53s | +00∘14′54.2′′ | 0.1189 | Abazajian et al. (2003) |
| 2MASX J15170956+0007443 | 15h17m09.57s | +00∘07′44.7′′ | 0.1190 | Abazajian et al. (2003) |
| SDSS J151614.81+000022.5 | 15h16m14.81s | +00∘0′22.5′′ | 0.1196 | Abazajian et al. (2003) |
| SDSS J151615.10+000429.5 | 15h16m15.11s | +00∘04′29.6′′ | 0.1201 | Abazajian et al. (2003) |
| 2MASX J15162640+0017507 | 15h16m26.38s | +00∘17′51.1′′ | 0.1202 | Abazajian et al. (2003) |
| SDSS J151629.25+000835.5 | 15h16m29.26s | +00∘08′35.6′′ | 0.1203 | Abazajian et al. (2003) |
| 2MASX J15161210+0017401 | 15h16m12.12s | +00∘17′40.0′′ | 0.1204 | Abazajian et al. (2003) |
| 2MASX J15160737+0020071 | 15h16m07.37s | +00∘20′07.1′′ | 0.1206 | Abazajian et al. (2003) |
| SDSS J151637.99+000718.7 | 15h16m38.00s | +00∘07′18.7′′ | 0.1207 | Abazajian et al. (2003) |
| 2MASX J15161794+0005203 | 15h16m17.93s | +00∘05′20.5′′ | 0.1208 | Guzzo et al. (2009) |
| SDSS J151559.04-000323.8 | 15h15m59.04s | -00∘03′23.9′′ | 0.1208 | Stoughton et al. (2002) |
| SDSS J151709.75+001224.0 | 15h17m09.75s | +00∘12′24.1′′ | 0.1210 | Abazajian et al. (2003) |
| SDSS J151615.30-000325.4 | 15h16m15.3s | -00∘03′25.4′′ | 0.1211 | Abazajian et al. (2003) |
| SDSS J151649.45-000135.0 | 15h16m49.46s | -00∘01′35.0′′ | 0.1215 | Abazajian et al. (2003) |
| 2MASX J15160803+0002011 | 15h16m08.06s | +00∘02′01.1′′ | 0.1215 | Abazajian et al. (2003) |
| SDSS J151624.58-000923.7 | 15h16m24.58s | -00∘09′23.7′′ | 0.1216 | Abazajian et al. (2003) |
| SDSS J151604.14+001024.8 | 15h16m04.15s | +00∘01′24.9′′ | 0.1218 | Abazajian et al. (2003) |
| 2MASX J15160330+0008271 | 15h16m03.33s | +00∘08′27.5′′ | 0.1223 | Abazajian et al. (2003) |
| SDSS J151614.44+000508.3 | 15h16m14.45s | +00∘05′08.4′′ | 0.1229 | Guzzo et al. (2009) |
| SDSS J151613.19+000509.1 | 15h16m13.19s | +00∘05′09.1′′ | 0.1239 | Guzzo et al. (2009) |
| SDSS J151631.54+000648.1 | 15h16m31.54s | +00∘06′48.2′′ | 0.1260 | Abazajian et al. (2003) |
| 2MASX J15155460+0002127 | 15h15m54.63s | +00∘02′13.0′′ | 0.1266 | Abazajian et al. (2003) |
| 2MASX J15163414-0004296 | 15h16m34.14s | -00∘04′29.7′′ | 0.1266 | Jones et al. (2009) |
| Name | RA(J2000) | Dec(J2000) | z | Reference |
|---|---|---|---|---|
| SDSS J161126.49+541619.2 | 16h11m26.49s | +54∘16′19.2′′ | 0.3310 | Trichas et al. (2010) |
| SDSS J161131.39+541333.1 | 16h11m31.39s | +54∘13′33.2′′ | 0.3330 | Trichas et al. (2010) |
| SDSS J161147.78+541132.2 | 16h11m47.78s | +54∘11′32.3′′ | 0.3340 | Trichas et al. (2010) |
| ELAIS06S(R) J161127.5+541422 | 16h11m27.53s | +54∘14′22.7′′ | 0.3350 | Trichas et al. (2010) |
| SDSS J161122.54+541706.5 | 16h11m22.54s | +54∘17′06.6′′ | 0.3360 | Trichas et al. (2010) |
| SDSS J161134.91+541404.6 | 16h11m34.92s | +54∘14′04.7′′ | 0.3360 | Trichas et al. (2010) |
| SDSS J161135.93+541634.5 | 16h11m35.94s | +54∘16′34.5′′ | 0.3380 | Trichas et al. (2010) |
| SDSS J161138.50+541922.0 | 16h11m38.50s | +54∘19′22.1′′ | 0.3390 | Trichas et al. (2010) |
| SDSS J161128.25+541720.8 | 16h11m28.26s | +54∘17′20.8′′ | 0.3400 | Trichas et al. (2010) |
| SDSS J161140.23+541741.1 | 16h11m40.24s | +54∘17′41.1′′ | 0.3410 | Trichas et al. (2010) |
| SDSS J161143.52+541628.5 | 16h11m43.53s | +54∘16′28.5′′ | 0.3410 | Trichas et al. (2010) |
| SDSS J161115.41+541627.4 | 16h11m15.42s | +54∘16′27.4′′ | 0.3420 | Trichas et al. (2010) |
| Name | RA(J2000) | Dec(J2000) | z | Reference |
|---|---|---|---|---|
| SDSS J163057.87+243412.6 | 16h30m57.88s | +24∘34′12.7′′ | 0.0560 | Adelman-McCarthy et al. (2006) |
| CGCG 138-016 | 16h28m36.04s | +24∘33′19.8′′ | 0.0571 | Freudling et al. (1992) |
| SDSS J162854.19+243138.5 | 16h28m54.20s | +24∘31′38.6′′ | 0.0574 | Adelman-McCarthy et al. (2006) |
| 2MASX J16305968+2437076 | 16h30m59.72s | +24∘37′08.0′′ | 0.0579 | Adelman-McCarthy et al. (2007) |
| SDSS J163039.80+243938.2 | 16h30m39.80s | +24∘39′38.3′′ | 0.0580 | Adelman-McCarthy et al. (2006) |
| 2MASX J16310298+2442456 | 16h31m03.00s | +24∘42′45.6′′ | 0.0581 | Adelman-McCarthy et al. (2006) |
| 2MASX J16311876+2442442 | 16h31m18.75s | +24∘42′44.2′′ | 0.0582 | Adelman-McCarthy et al. (2006) |
| 2MASX J16310320+2442586 | 16h31m03.26s | +24∘42′58.5′′ | 0.0586 | Adelman-McCarthy et al. (2007) |
| SDSS J163056.45+243816.4 | 16h30m56.45s | +24∘38′16.4′′ | 0.0589 | Adelman-McCarthy et al. (2006) |
| 2MASX J16293963+2408563 | 16h29m39.59s | +24∘08′56.0′′ | 0.0591 | Adelman-McCarthy et al. (2007) |
| SDSS J163021.72+245911.6 | 16h30m21.73s | +24∘59′11.6′′ | 0.0607 | Adelman-McCarthy et al. (2006) |
| SDSS J163020.55+243457.6 | 16h30m20.56s | +24∘34′57.6′′ | 0.0611 | Adelman-McCarthy et al. (2006) |
| SDSS J163022.47+243215.9 | 16h30m22.48s | +24∘32′16.0′′ | 0.0613 | Adelman-McCarthy et al. (2006) |
| 2MASX J16301853+2430424 | 16h30m18.54s | +24∘30′42.0′′ | 0.0614 | Adelman-McCarthy et al. (2007) |
| 2MASX J16303722+2440374 | 16h30m37.21s | +24∘40′37.8′′ | 0.0616 | Adelman-McCarthy et al. (2006) |
| SDSS J163031.89+242519.5 | 16h30m31.89s | +24∘25′19.6′′ | 0.0617 | Adelman-McCarthy et al. (2006) |
| 2MASX J16300229+2434054 | 16h30m02.28s | +24∘34′05.3′′ | 0.0618 | Adelman-McCarthy et al. (2007) |
| SDSS J163026.85+243652.1 | 16h30m26.86s | +24∘36′52.2′′ | 0.0619 | Adelman-McCarthy et al. (2006) |
| 2MASX J16295863+2440084 | 16h29m58.65s | +24∘40′08.3′′ | 0.0620 | Adelman-McCarthy et al. (2006) |
| SDSS J163025.22+243517.2 | 16h30m25.23s | +24∘35′17.3′′ | 0.0622 | Adelman-McCarthy et al. (2006) |
| 2MASX J16302666+2436404 | 16h30m26.65s | +24∘36′40.3′′ | 0.0623 | Adelman-McCarthy et al. (2006) |
| SDSS J163110.03+243637.9 | 16h31m10.04s | +24∘36′38.0′′ | 0.0623 | Adelman-McCarthy et al. (2006) |
| MCG +04-39-010 NED01 | 16h30m14.56s | +24∘34′38.0′′ | 0.0626 | Adelman-McCarthy et al. (2006) |
| SDSS J163046.39+245653.0 | 16h30m46.40s | +24∘56′53.1′′ | 0.0629 | Adelman-McCarthy et al. (2006) |
| 2MASX J16300112+2432064 | 16h30m01.12s | +24∘32′06.8′′ | 0.0630 | Adelman-McCarthy et al. (2007) |
| CGCG 138-030 | 16h30m53.84s | +24∘33′43.6′′ | 0.0632 | Huchra et al. (2012) |
| SDSS J162854.70+244050.7 | 16h28m54.71s | +24∘40′50.8′′ | 0.0632 | Adelman-McCarthy et al. (2006) |
| SDSS J163042.59+242611.3 | 16h30m42.60s | +24∘26′11.3′′ | 0.0633 | Adelman-McCarthy et al. (2006) |
| 2MASX J16314233+2445531 | 16h31m42.33s | +24∘45′53.1′′ | 0.0634 | Adelman-McCarthy et al. (2007) |
| MCG +04-39-010 NED07 | 16h30m16.11s | +24∘34′16.3′′ | 0.0634 | Adelman-McCarthy et al. (2007) |
| 2MASX J16292467+2452082 | 16h29m24.69s | +24∘52′08.2′′ | 0.0634 | Adelman-McCarthy et al. (2007) |
| SDSS J163053.84+243147.2 | 16h30m53.84s | +24∘31′47.3′′ | 0.0635 | Adelman-McCarthy et al. (2006) |
| SDSS J163019.67+243330.0 | 16h30m19.68s | +24∘33′30.1′′ | 0.0635 | Adelman-McCarthy et al. (2006) |
| 2MASX J16313042+2449302 | 16h31m30.39s | +24∘49′30.1′′ | 0.0636 | Adelman-McCarthy et al. (2007) |
| 2MASX J16284192+2446279 | 16h28m41.91s | +24∘46′27.8′′ | 0.0638 | Adelman-McCarthy et al. (2006) |
| SDSS J163104.62+245719.8 | 16h31m04.62s | +24∘57′19.9′′ | 0.0639 | Adelman-McCarthy et al. (2006) |
| IC 4607 | 16h30m15.87s | +24∘34′27.7′′ | 0.0639 | Huchra et al. (2012) |
| SDSS J163106.44+241248.7 | 16h31m06.45s | +24∘12′48.7′′ | 0.0639 | Adelman-McCarthy et al. (2006) |
| SDSS J163110.30+245853.6 | 16h31m10.31s | +24∘58′53.7′′ | 0.0641 | Adelman-McCarthy et al. (2006) |
| SDSS J163109.43+242202.7 | 16h31m09.43s | +24∘22′02.8′′ | 0.0642 | Adelman-McCarthy et al. (2006) |
| 2MASX J16301543+2442443 | 16h30m15.43s | +24∘42′44.1′′ | 0.0643 | Adelman-McCarthy et al. (2007) |
| 2MASX J16303890+2430594 | 16h30m38.89s | +24∘30′59.2′′ | 0.0643 | Adelman-McCarthy et al. (2006) |
| MCG +04-39-010 NED03 | 16h30m14.59s | +24∘35′13.2′′ | 0.0643 | Adelman-McCarthy et al. (2007) |
| SDSS J163041.54+245853.0 | 16h30m41.55s | +24∘58′53.0′′ | 0.0644 | Adelman-McCarthy et al. (2006) |
| SDSS J162836.55+244752.4 | 16h28m36.56s | +24∘47′52.4′′ | 0.0644 | Adelman-McCarthy et al. (2006) |
| 2MASX J16315966+2428552 | 16h31m59.69s | +24∘28′55.4′′ | 0.0645 | Adelman-McCarthy et al. (2007) |
| 2MASX J16301449+2437063 | 16h30m14.50s | +24∘37′06.4′′ | 0.0646 | Adelman-McCarthy et al. (2006) |
| 2MASX J16305028+2455226 | 16h30m50.28s | +24∘55′22.7′′ | 0.0647 | Adelman-McCarthy et al. (2006) |
| 2MASX J16302886+2433164 | 16h30m28.83s | +24∘33′16.3′′ | 0.0647 | Adelman-McCarthy et al. (2006) |
| 2MASX J16301215+2433473 | 16h30m12.17s | +24∘33′47.7′′ | 0.0649 | Adelman-McCarthy et al. (2006) |
| SDSS J163004.88+240409.2 | 16h30m04.89s | +24∘04′09.3′′ | 0.0650 | Adelman-McCarthy et al. (2006) |
| 2MASX J16300743+2440363 | 16h30m07.44s | +24∘40′36.3′′ | 0.0651 | Adelman-McCarthy et al. (2006) |
| 2MASX J16304317+2440386 | 16h30m43.18s | +24∘40′39.1′′ | 0.0653 | Adelman-McCarthy et al. (2006) |
| 2MASX J16303509+2435324 | 16h30m35.09s | +24∘35′32.3′′ | 0.0654 | Adelman-McCarthy et al. (2007) |
| SDSS J162911.44+243413.9 | 16h29m11.45s | +24∘34′14.0′′ | 0.0655 | Adelman-McCarthy et al. (2006) |
| 2MASX J16294712+2434194 | 16h29m47.10s | +24∘34′19.4′′ | 0.0656 | Adelman-McCarthy et al. (2007) |
| 2MASX J16303981+2434546 | 16h30m39.85s | +24∘34′55.2′′ | 0.0659 | Adelman-McCarthy et al. (2007) |
| 2MASX J16303606+2455434 | 16h30m36.06s | +24∘55′43.2′′ | 0.0659 | Adelman-McCarthy et al. (2006) |
| SDSS J163002.23+244721.6 | 16h30m02.24s | +24∘47′21.7′′ | 0.0660 | Adelman-McCarthy et al. (2006) |
| 2MASX J16303737+2440154 | 16h30m37.41s | +24∘40′15.2′′ | 0.0663 | Adelman-McCarthy et al. (2007) |
| 2MASX J16311982+2424422 | 16h31m19.80s | +24∘24′41.9′′ | 0.0665 | Adelman-McCarthy et al. (2006) |
| SDSS J163025.16+243528.7 | 16h30m25.17s | +24∘35′28.7′′ | 0.0670 | Adelman-McCarthy et al. (2006) |
| Name | RA(J2000) | Dec(J2000) | z | Reference |
|---|---|---|---|---|
| (W2011) J339.86728-05.76581 | 22h39m28.15s | -05∘45′56.9′′ | 0.2402 | Wegner (2011) |
| (W2011) J339.85526-05.78358 | 22h39m25.26s | -05∘47′00.9′′ | 0.2405 | Wegner (2011) |
| (W2011) J339.85416-05.78444 | 22h39m25.00s | -05∘47′04.0′′ | 0.2410 | Wegner (2011) |
| (W2011) J339.84311-05.75219 | 22h39m22.35s | -05∘45′07.9′′ | 0.2414 | Wegner (2011) |
| (W2011) J339.85796-05.66972 | 22h39m25.91s | -05∘40′11.0′′ | 0.2421 | Wegner (2011) |
| (W2011) J339.91522-05.73214 | 22h39m39.65s | -05∘43′55.7′′ | 0.2421 | Wegner (2011) |
| (W2011) J339.92899-05.70703 | 22h39m42.96s | -05∘42′25.3′′ | 0.2424 | Wegner (2011) |
| APMUKS(BJ) B223649.45-060121.8 | 22h39m25.61s | -05∘45′43.1′′ | 0.2425 | Wegner (2011) |
| (W2011) J339.88293-05.68617 | 22h39m31.91s | -05∘41′10.2′′ | 0.2425 | Wegner (2011) |
| (W2011) J339.93253-05.72194 | 22h39m43.81s | -05∘43′19.0′′ | 0.2427 | Wegner (2011) |
| (W2011) J339.85922-05.77811 | 22h39m26.21s | -05∘46′41.2′′ | 0.2434 | Wegner (2011) |
| APMUKS(BJ) B223704.30-055906.2 | 22h39m40.49s | -05∘43′26.7′′ | 0.2436 | Wegner (2011) |
| (W2011) J339.91388-05.73789 | 22h39m39.33s | -05∘44′16.4′′ | 0.2437 | Wegner (2011) |
| (W2011) J339.93896-05.75525 | 22h39m45.35s | -05∘45′18.9′′ | 0.2437 | Wegner (2011) |
| APMUKS(BJ) B223702.94-060320.8 | 22h39m39.10s | -05∘47′41.7′′ | 0.2441 | Wegner (2011) |
| (W2011) J339.92871-05.74033 | 22h39m42.89s | -05∘44′25.2′′ | 0.2441 | Wegner (2011) |
| (W2011) J339.87462-05.69311 | 22h39m29.91s | -05∘41′35.2′′ | 0.2441 | Wegner (2011) |
| (W2011) J339.91187-05.63333 | 22h39m38.85s | -05∘38′00.0′′ | 0.2442 | Wegner (2011) |
| GALEXASC J223938.36-054401.5 | 22h39m38.36s | -05∘44′03.8′′ | 0.2442 | Wegner (2011) |
| (W2011) J339.82141-05.70861 | 22h39m17.14s | -05∘42′31.0′′ | 0.2443 | Wegner (2011) |
| APMUKS(BJ) B223656.20-055649.6 | 22h39m32.31s | -05∘41′10.7′′ | 0.2443 | Wegner (2011) |
| (W2011) J339.90479-05.74742 | 22h39m37.15s | -05∘44′50.7′′ | 0.2445 | Wegner (2011) |
| GALEXASC J223932.33-054544.9 | 22h39m32.36s | -05∘45′46.5′′ | 0.2445 | Wegner (2011) |
| (W2011) J339.90805-05.72461 | 22h39m37.93s | -05∘43′28.6′′ | 0.2445 | Wegner (2011) |
| (W2011) J339.88004-05.67217 | 22h39m31.21s | -05∘40′19.8′′ | 0.2446 | Wegner (2011) |
| (W2011) J339.88586-05.68911 | 22h39m32.61s | -05∘41′20.8′′ | 0.2446 | Wegner (2011) |
| (W2011) J339.91403-05.73167 | 22h39m39.37s | -05∘43′54.0′′ | 0.2447 | Wegner (2011) |
| (W2011) J339.89958-05.70617 | 22h39m35.90s | -05∘42′22.2′′ | 0.2448 | Wegner (2011) |
| (W2011) J339.90379-05.75611 | 22h39m36.91s | -05∘45′22.0′′ | 0.2448 | Wegner (2011) |
| (W2011) J339.89209-05.80678 | 22h39m34.10s | -05∘48′24.4′′ | 0.2448 | Wegner (2011) |
| (W2011) J339.85654-05.78022 | 22h39m25.57s | -05∘46′48.8′′ | 0.2449 | Wegner (2011) |
| (W2011) J339.93542-05.67039 | 22h39m44.50s | -05∘40′13.4′′ | 0.2451 | Wegner (2011) |
| (W2011) J339.83524-05.75508 | 22h39m20.46s | -05∘45′18.3′′ | 0.2452 | Wegner (2011) |
| (W2011) J339.85291-05.78672 | 22h39m24.70s | -05∘47′12.2′′ | 0.2452 | Wegner (2011) |
| (W2011) J340.00000-05.73803 | 22h40m00.00s | -05∘44′16.9′′ | 0.2453 | Wegner (2011) |
| 2MASX J22392454-0547173 | 22h39m24.57s | -05∘47′17.4′′ | 0.2453 | Wegner (2011) |
| APMUKS(BJ) B223715.80-060103.5 | 22h39m51.98s | -05∘45′23.8′′ | 0.2454 | Wegner (2011) |
| (W2011) J339.85626-05.78508 | 22h39m25.50s | -05∘47′06.3′′ | 0.2454 | Wegner (2011) |
| (W2011) J339.95475-05.79149 | 22h39m49.14s | -05∘47′29.4′′ | 0.2454 | Wegner (2011) |
| (W2011) J339.85004-05.74921 | 22h39m24.01s | -05∘44′57.2′′ | 0.2454 | Wegner (2011) |
| APMUKS(BJ) B223651.70-060319.5 | 22h39m27.86s | -05∘47′40.2′′ | 0.2455 | Wegner (2011) |
| (W2011) J339.88324-05.68225 | 22h39m31.98s | -05∘40′56.1′′ | 0.2457 | Wegner (2011) |
| (W2011) J339.84662-05.75625 | 22h39m23.19s | -05∘45′22.5′′ | 0.2457 | Wegner (2011) |
| (W2011) J339.90917-05.77036 | 22h39m38.20s | -05∘46′13.3′′ | 0.2458 | Wegner (2011) |
| (W2011) J339.89420-05.81267 | 22h39m34.61s | -05∘48′45.6′′ | 0.2460 | Wegner (2011) |
| (W2011) J339.94089-05.71742 | 22h39m45.81s | -05∘43′02.7′′ | 0.2462 | Wegner (2011) |
| (W2011) J339.94528-05.76256 | 22h39m46.87s | -05∘45′45.2′′ | 0.2463 | Wegner (2011) |
| (W2011) J339.90976-05.75339 | 22h39m38.34s | -05∘45′12.2′′ | 0.2464 | Wegner (2011) |
| (W2011) J339.87332-05.80614 | 22h39m29.60s | -05∘48′22.1′′ | 0.2466 | Wegner (2011) |
| (W2011) J339.89771-05.80597 | 22h39m35.45s | -05∘48′21.5′′ | 0.2469 | Wegner (2011) |
| 2MASX J22392032-0544233 | 22h39m20.40s | -05∘44′23.1′′ | 0.2469 | Wegner (2011) |
| (W2011) J339.87396-05.76278 | 22h39m29.75s | -05∘45′46.0′′ | 0.2470 | Wegner (2011) |
| APMUKS(BJ) B223704.44-055858.1 | 22h39m40.60s | -05∘43′18.5′′ | 0.2470 | Wegner (2011) |
| (W2011) J339.90925-05.77828 | 22h39m38.22s | -05∘46′41.8′′ | 0.2471 | Wegner (2011) |
| (W2011) J339.94589-05.64414 | 22h39m47.01s | -05∘38′38.9′′ | 0.2472 | Wegner (2011) |
| (W2011) J339.84738-05.74164 | 22h39m23.37s | -05∘44′29.9′′ | 0.2473 | Wegner (2011) |
| APMUKS(BJ) B223710.40-055450.0 | 22h39m46.57s | -05∘39′11.1′′ | 0.2475 | Wegner (2011) |
| (W2011) J339.82697-05.74289 | 22h39m18.47s | -05∘44′34.4′′ | 0.2475 | Wegner (2011) |
| (W2011) J339.82428-05.74400 | 22h39m17.83s | -05∘44′38.4′′ | 0.2475 | Wegner (2011) |
| (W2011) J339.88842-05.80075 | 22h39m33.23s | -05∘48′02.7′′ | 0.2478 | Wegner (2011) |
| (W2011) J339.88092-05.75026 | 22h39m31.42s | -05∘45′00.9′′ | 0.2489 | Wegner (2011) |
| (W2011) J339.91043-05.69272 | 22h39m38.50s | -05∘41′33.8′′ | 0.2490 | Wegner (2011) |
| (W2011) J339.90521-05.68931 | 22h39m37.25s | -05∘41′21.5′′ | 0.2492 | Wegner (2011) |
| (W2011) J339.92203-05.73417 | 22h39m41.29s | -05∘44′03.0′′ | 0.2492 | Wegner (2011) |
| (W2011) J339.92083-05.73192 | 22h39m41.00s | -05∘43′54.8′′ | 0.2497 | Wegner (2011) |
| (W2011) J339.91183-05.68417 | 22h39m38.84s | -05∘41′03.0′′ | 0.2500 | Wegner (2011) |
| APMUKS(BJ) B223659.52-055721.9 | 22h39m35.71s | -05∘41′42.4′′ | 0.2502 | Wegner (2011) |
| (W2011) J339.90482-05.67711 | 22h39m37.16s | -05∘40′37.6′′ | 0.2509 | Wegner (2011) |
| Name | RA(J2000) | Dec(J2000) | z | Reference |
|---|---|---|---|---|
| AGC 331543 | 23h38m31.41s | +27∘13′48.2′′ | 0.1218 | Scodeggio et al. (1995) |
| AGC 331535 | 23h37m55.52s | +27∘08′25.8′′ | 0.1222 | Scodeggio et al. (1995) |
| 2MASX J23380720+2715028 | 23h38m07.24s | +27∘15′02.9′′ | 0.1222 | Scodeggio et al. (1995) |
| AGC 331529 | 23h37m41.99s | +27∘04′37.4′′ | 0.1226 | Scodeggio et al. (1995) |
| AGC 331531 | 23h37m47.13s | +27∘09′29.5′′ | 0.1226 | Scodeggio et al. (1995) |
| 2MASX J23375415+2718448 | 23h37m54.16s | +27∘18′44.8′′ | 0.1238 | Scodeggio et al. (1995) |
| 2MASX J23375559+2711128 | 23h37m55.59s | +27∘11′13.1′′ | 0.1245 | Giovanelli et al. (1995) |
| AGC 331526 | 23h37m22.51s | +27∘06′32.6′′ | 0.1246 | Scodeggio et al. (1995) |
| 2MASX J23380218+2712088 | 23h38m02.18s | +27∘12′09.1′′ | 0.1246 | Smith et al. (2004) |
| 2MASX J23382282+2717516 | 23h38m22.83s | +27∘17′51.6′′ | 0.1263 | Scodeggio et al. (1995) |
| 2MASX J23372726+2707408 | 23h37m27.26s | +27∘07′41.0′′ | 0.1264 | Scodeggio et al. (1995) |
| BATC J233724.29+271434.14 | 23h37m24.10s | +27∘14′32.8′′ | 0.1265 | Pinkney et al. (1993) |
| ID | RA(J2000) | Dec(J2000) | z | Reference | Member |
|---|---|---|---|---|---|
| 1 | 10h57m03.77s | -03∘37′37.3′′ | 0.8312 | Nastasi et al. (2014) Tran et al. (1999) | |
| 2 | 10h56m50.84s | -03∘37′37.4′′ | 0.8390 | Nastasi et al. (2014) Tran et al. (1999) | |
| 3 | 10h57m04.10s | -03∘37′37.3′′ | 0.8329 | Nastasi et al. (2014) Tran et al. (1999) | |
| 4 | 10h56m54.31s | -03∘37′37.4′′ | 0.8380 | Nastasi et al. (2014) Tran et al. (1999) | |
| 5 | 10h56m51.77s | -03∘37′37.4′′ | 0.8371 | Nastasi et al. (2014) Tran et al. (1999) | |
| 6 | 10h56m58.44s | -03∘37′37.4′′ | 0.8353 | Nastasi et al. (2014) Tran et al. (1999) | |
| 7 | 10h56m56.37s | -03∘37′37.4′′ | 0.8317 | Nastasi et al. (2014) Tran et al. (1999) | |
| 8 | 10h57m01.50s | -03∘37′37.3′′ | 0.8346 | Nastasi et al. (2014) Tran et al. (1999) | |
| 9 | 10h56m56.90s | -03∘37′37.4′′ | 0.8403 | Nastasi et al. (2014) Tran et al. (1999) | |
| 10 | 10h56m57.31s | -03∘37′37.4′′ | 0.8175 | Nastasi et al. (2014) Tran et al. (1999) | |
| 11 | 10h57m02.97s | -03∘37′37.3′′ | 0.8367 | Nastasi et al. (2014) Tran et al. (1999) | |
| 12 | 10h57m01.64s | -03∘37′37.3′′ | 0.8239 | Nastasi et al. (2014) Tran et al. (1999) | |
| 13 | 10h57m01.04s | -03∘37′37.3′′ | 0.8420 | Nastasi et al. (2014) Tran et al. (1999) | |
| 14 | 10h56m59.51s | -03∘37′37.4′′ | 0.8454 | Nastasi et al. (2014) Tran et al. (1999) | |
| 15 | 10h56m59.90s | -03∘37′37.4′′ | 0.8314 | Nastasi et al. (2014) Tran et al. (1999) | |
| 16 | 10h57m04.64s | -03∘37′37.3′′ | 0.8282 | Nastasi et al. (2014) Tran et al. (1999) | |
| 17 | 10h57m03.37s | -03∘37′37.3′′ | 0.8259 | Nastasi et al. (2014) Tran et al. (1999) | |
| 18 | 10h57m02.44s | -03∘37′37.3′′ | 0.8397 | Nastasi et al. (2014) Tran et al. (1999) | |
| 19 | 10h57m02.44s | -03∘37′37.3′′ | 0.8224 | Nastasi et al. (2014) Tran et al. (1999) | |
| 20 | 10h57m02.84s | -03∘37′37.3′′ | 0.8314 | Nastasi et al. (2014) Tran et al. (1999) | |
| 21 | 10h57m02.17s | -03∘37′37.3′′ | 0.8249 | Nastasi et al. (2014) Tran et al. (1999) | |
| 22 | 10h57m03.77s | -03∘37′37.3′′ | 0.8392 | Nastasi et al. (2014) Tran et al. (1999) | |
| 23 | 10h57m03.84s | -03∘37′37.3′′ | 0.8308 | Nastasi et al. (2014) Tran et al. (1999) | |
| 24 | 10h57m08.84s | -03∘37′37.3′′ | 0.8250 | Nastasi et al. (2014) Tran et al. (1999) | |
| 25 | 10h57m01.97s | -03∘37′37.3′′ | 0.8127 | Nastasi et al. (2014) Tran et al. (1999) | |
| 26 | 10h57m01.31s | -03∘37′37.3′′ | 0.8213 | Nastasi et al. (2014) Tran et al. (1999) | |
| 27 | 10h56m57.97s | -03∘37′37.4′′ | 0.8209 | Nastasi et al. (2014) Tran et al. (1999) | |
| 28 | 10h56m57.77s | -03∘37′37.4′′ | 0.8286 | Nastasi et al. (2014) Tran et al. (1999) | |
| 29 | 10h56m57.37s | -03∘37′37.4′′ | 0.8353 | Nastasi et al. (2014) Tran et al. (1999) | |
| 30 | 10h56m56.97s | -03∘37′37.4′′ | 0.8332 | Nastasi et al. (2014) Tran et al. (1999) | |
| 31 | 10h56m54.44s | -03∘37′37.4′′ | 0.8378 | Nastasi et al. (2014) Tran et al. (1999) | |
| 32 | 10h56m53.30s | -03∘37′37.4′′ | 0.8319 | Nastasi et al. (2014) Tran et al. (1999) |
| ID | RA(J2000) | Dec(J2000) | z | Reference | Member |
|---|---|---|---|---|---|
| 1 | 11h40m22.31s | 66∘08′15.1′′ | 0.7844 | Nastasi et al. (2014) Donahue et al. (1999) | |
| 2 | 11h40m22.01s | 66∘08′12.1′′ | 0.7903 | Nastasi et al. (2014) Donahue et al. (1999) | |
| 3 | 11h40m22.61s | 66∘08′17.1′′ | 0.7844 | Nastasi et al. (2014) Donahue et al. (1999) | |
| 4 | 11h40m22.01s | 66∘08′19.0′′ | 0.7927 | Nastasi et al. (2014) Donahue et al. (1999) | |
| 5 | 11h40m21.41s | 66∘08′20.1′′ | 0.7826 | Nastasi et al. (2014) Donahue et al. (1999) | |
| 6 | 11h40m17.70s | 66∘08′23.0′′ | 0.7808 | Nastasi et al. (2014) Donahue et al. (1999) | |
| 7 | 11h40m16.91s | 66∘08′25.1′′ | 0.7909 | Nastasi et al. (2014) Donahue et al. (1999) | |
| 8 | 11h40m17.21s | 66∘08′29.1′′ | 0.7916 | Nastasi et al. (2014) Donahue et al. (1999) | |
| 9 | 11h40m27.41s | 66∘08′23.0′′ | 0.7761 | Nastasi et al. (2014) Donahue et al. (1999) | |
| 10 | 11h40m27.01s | 66∘08′09.0′′ | 0.7760 | Nastasi et al. (2014) Donahue et al. (1999) | |
| 11 | 11h40m29.30s | 66∘08′02.1′′ | 0.7831 | Nastasi et al. (2014) Donahue et al. (1999) | |
| 12 | 11h40m24.50s | 66∘07′26.1′′ | 0.7823 | Nastasi et al. (2014) Donahue et al. (1999) | |
| 13 | 11h40m14.81s | 66∘07′32.1′′ | 0.7824 | Nastasi et al. (2014) Donahue et al. (1999) | |
| 14 | 11h40m30.80s | 66∘09′03.0′′ | 0.7900 | Nastasi et al. (2014) Donahue et al. (1999) | |
| 15 | 11h40m15.11s | 66∘09′22.0′′ | 0.7773 | Nastasi et al. (2014) Donahue et al. (1999) | |
| 16 | 11h40m17.40s | 66∘09′14.1′′ | 0.7909 | Nastasi et al. (2014) Donahue et al. (1999) | |
| 17 | 11h40m42.80s | 66∘10′19.0′′ | 0.7814 | Nastasi et al. (2014) Donahue et al. (1999) | |
| 18 | 11h40m40.40s | 66∘07′52.0′′ | 0.7889 | Nastasi et al. (2014) Donahue et al. (1999) | |
| 19 | 11h40m37.10s | 66∘07′25.0′′ | 0.7902 | Nastasi et al. (2014) Donahue et al. (1999) | |
| 20 | 11h40m10.31s | 66∘07′18.1′′ | 0.7898 | Nastasi et al. (2014) Donahue et al. (1999) | |
| 21 | 11h40m05.90s | 66∘08′05.0′′ | 0.7790 | Nastasi et al. (2014) Donahue et al. (1999) | |
| 22 | 11h39m58.91s | 66∘07′60.0′′ | 0.7792 | Nastasi et al. (2014) Donahue et al. (1999) | |
| 23 | 11h40m06.00s | 66∘08′18.0′′ | 0.7714 | Nastasi et al. (2014) Donahue et al. (1999) |
| ID | RA(J2000) | Dec(J2000) | z | Reference | Member |
|---|---|---|---|---|---|
| 1 | 18h21m16.61s | 68∘30′25.0′′ | 0.8151 | Nastasi et al. (2014) Gioia et al. (2004) | |
| 2 | 18h21m21.50s | 68∘29′57.1′′ | 0.8225 | Nastasi et al. (2014) Gioia et al. (2004) | |
| 3 | 18h21m26.21s | 68∘29′31.0′′ | 0.8206 | Nastasi et al. (2014) Gioia et al. (2004) | |
| 4 | 18h21m30.80s | 68∘29′29.1′′ | 0.8204 | Nastasi et al. (2014) Gioia et al. (2004) | |
| 5 | 18h21m27.90s | 68∘28′43.0′′ | 0.8229 | Nastasi et al. (2014) Gioia et al. (2004) | |
| 6 | 18h21m33.80s | 68∘28′40.1′′ | 0.8235 | Nastasi et al. (2014) Gioia et al. (2004) | |
| 7 | 18h21m32.60s | 68∘27′54.1′′ | 0.8167 | Nastasi et al. (2014) Gioia et al. (2004) | |
| 8 | 18h21m34.91s | 68∘27′53.0′′ | 0.8099 | Nastasi et al. (2014) Gioia et al. (2004) | |
| 9 | 18h21m37.20s | 68∘27′51.1′′ | 0.8153 | Nastasi et al. (2014) Gioia et al. (2004) | |
| 10 | 18h21m33.60s | 68∘27′50.1′′ | 0.8161 | Nastasi et al. (2014) Gioia et al. (2004) | |
| 11 | 18h21m35.21s | 68∘27′34.0′′ | 0.8115 | Nastasi et al. (2014) Gioia et al. (2004) | |
| 12 | 18h21m36.60s | 68∘27′21.0′′ | 0.8172 | Nastasi et al. (2014) Gioia et al. (2004) | |
| 13 | 18h21m37.50s | 68∘27′07.0′′ | 0.8231 | Nastasi et al. (2014) Gioia et al. (2004) | |
| 14 | 18h21m37.91s | 68∘27′00.1′′ | 0.8159 | Nastasi et al. (2014) Gioia et al. (2004) | |
| 15 | 18h21m18.20s | 68∘27′00.1′′ | 0.7942 | Nastasi et al. (2014) Gioia et al. (2004) | |
| 16 | 18h21m47.71s | 68∘27′06.1′′ | 0.8089 | Nastasi et al. (2014) Gioia et al. (2004) | |
| 17 | 18h21m51.11s | 68∘27′17.0′′ | 0.8060 | Nastasi et al. (2014) Gioia et al. (2004) | |
| 18 | 18h21m57.71s | 68∘27′25.0′′ | 0.8118 | Nastasi et al. (2014) Gioia et al. (2004) | |
| 19 | 18h21m50.81s | 68∘26′09.0′′ | 0.8152 | Nastasi et al. (2014) Gioia et al. (2004) | |
| 20 | 18h21m47.81s | 68∘25′18.1′′ | 0.8122 | Nastasi et al. (2014) Gioia et al. (2004) |
| ID | Mask | RA(J2000) | Dec(J2000) | z | Quality | Identification | Member |
|---|---|---|---|---|---|---|---|
| 1 | GS-2012B-Q-011-03 | 00h56m46.52s | -27∘41′57.9′′ | 0.6625 | 3 | X | |
| 2 | GS-2012B-Q-011-03 | 00h56m47.54s | -27∘41′53.6′′ | 0.6294 | 2 | X | |
| 3 | GS-2012B-Q-011-03 | 00h56m47.56s | -27∘41′03.2′′ | 0.5864 | 3 | X | |
| 5 | GS-2012B-Q-011-03 | 00h56m47.54s | -27∘41′19.7′′ | 0.5604 | 3 | X | |
| 6 | GS-2012B-Q-011-03 | 00h56m54.47s | -27∘41′52.9′′ | 0.5604 | 3 | X | |
| 7 | GS-2012B-Q-011-03 | 00h56m52.73s | -27∘41′46.0′′ | 0.5744 | 3 | X | |
| 9 | GS-2012B-Q-011-03 | 00h56m53.45s | -27∘41′28.0′′ | 0.5754 | 3 | X | |
| 11 | GS-2012B-Q-011-03 | 00h56m53.03s | -27∘40′44.8′′ | 0.5574 | 3 | X | |
| 12 | GS-2012B-Q-011-03 | 00h56m57.06s | -27∘40′12.4′′ | 0.8196 | 2 | X | |
| 13 | GS-2012B-Q-011-03 | 00h56m58.95s | -27∘40′28.2′′ | 0.5604 | 3 | X | |
| 14 | GS-2012B-Q-011-03 | 00h56m55.93s | -27∘40′27.9′′ | 0.5584 | 3 | X | |
| 16 | GS-2012B-Q-011-03 | 00h56m54.31s | -27∘40′29.3′′ | 0.5614 | 3 | X | |
| 17 | GS-2012B-Q-011-03 | 00h56m57.48s | -27∘41′01.7′′ | 0.5584 | 3 | X | |
| 18 | GS-2012B-Q-011-03 | 00h56m59.35s | -27∘40′52.0′′ | 0.5974 | 3 | X | |
| 19 | GS-2012B-Q-011-03 | 00h56m57.03s | -27∘40′30.4′′ | 0.5584 | 3 | X | |
| 20 | GS-2012B-Q-011-03 | 00h56m56.80s | -27∘39′34.3′′ | 0.6014 | 3 | X | |
| 23 | GS-2012B-Q-011-03 | 00h56m59.28s | -27∘39′33.9′′ | 0.8326 | 3 | X | |
| 25 | GS-2012B-Q-011-03 | 00h57m02.36s | -27∘39′29.9′′ | 0.6284 | 2 | X | |
| 26 | GS-2012B-Q-011-03 | 00h57m01.73s | -27∘39′34.3′′ | 0.5694 | 3 | X | |
| 27 | GS-2012B-Q-011-03 | 00h57m00.36s | -27∘39′24.9′′ | 0.8646 | 3 | X | |
| 28 | GS-2012B-Q-011-03 | 00h57m02.35s | -27∘38′51.1′′ | 0.5574 | 3 | X | |
| 29 | GS-2012B-Q-011-03 | 00h57m03.56s | -27∘39′31.0′′ | 0.5604 | 3 | X | |
| 31 | GS-2012B-Q-011-03 | 00h57m04.76s | -27∘39′09.0′′ | 0.6294 | 3 | X | |
| 32 | GS-2012B-Q-011-03 | 00h57m03.51s | -27∘38′27.3′′ | 0.2472 | 3 | X | |
| 1 | GS-2012B-Q-011-04 | 00h56m46.96s | -27∘41′44.6′′ | 1.0127 | 2 | X | |
| 2 | GS-2012B-Q-011-04 | 00h56m46.52s | -27∘41′57.9′′ | 0.6625 | 3 | X | |
| 3 | GS-2012B-Q-011-04 | 00h56m49.75s | -27∘42′31.4′′ | 0.8336 | 3 | X | |
| 4 | GS-2012B-Q-011-04 | 00h56m44.95s | -27∘40′56.3′′ | 0.7956 | 2 | X | |
| 5 | GS-2012B-Q-011-04 | 00h56m46.64s | -27∘41′05.7′′ | 0.5874 | 3 | X | |
| 6 | GS-2012B-Q-011-04 | 00h56m47.56s | -27∘41′03.2′′ | 0.5844 | 3 | X | |
| 7 | GS-2012B-Q-011-04 | 00h56m48.10s | -27∘41′00.3′′ | 0.8126 | 3 | X | |
| 8 | GS-2012B-Q-011-04 | 00h56m52.46s | -27∘41′45.7′′ | 0.2121 | 3 | X | |
| 10 | GS-2012B-Q-011-04 | 00h56m54.96s | -27∘41′47.8′′ | 0.5614 | 3 | X | |
| 11 | GS-2012B-Q-011-04 | 00h56m50.57s | -27∘40′27.9′′ | 0.5634 | 3 | X | |
| 12 | GS-2012B-Q-011-04 | 00h56m53.08s | -27∘40′49.5′′ | 0.8586 | 3 | X | |
| 13 | GS-2012B-Q-011-04 | 00h56m58.35s | -27∘41′49.6′′ | 0.6785 | 2 | X | |
| 14 | GS-2012B-Q-011-04 | 00h56m52.88s | -27∘40′14.6′′ | 0.7365 | 2 | X | |
| 15 | GS-2012B-Q-011-04 | 00h56m54.90s | -27∘39′55.1′′ | 0.5584 | 3 | X | |
| 16 | GS-2012B-Q-011-04 | 00h56m54.76s | -27∘40′12.1′′ | 0.5594 | 3 | X | |
| 17 | GS-2012B-Q-011-04 | 00h56m54.76s | -27∘40′51.7′′ | 0.5614 | 3 | X | |
| 18 | GS-2012B-Q-011-04 | 00h56m56.82s | -27∘40′30.8′′ | 0.5994 | 3 | X | |
| 19 | GS-2012B-Q-011-04 | 00h56m59.12s | -27∘40′41.9′′ | 0.5964 | 3 | X | |
| 20 | GS-2012B-Q-011-04 | 00h56m56.89s | -27∘40′02.0′′ | 1.1908 | 2 | X | |
| 23 | GS-2012B-Q-011-04 | 00h56m58.05s | -27∘37′52.0′′ | 0.7795 | 3 | X | |
| 24 | GS-2012B-Q-011-04 | 00h56m59.04s | -27∘37′40.1′′ | 0.6515 | 3 | X | |
| 25 | GS-2012B-Q-011-04 | 00h56m57.22s | -27∘39′34.6′′ | 0.6314 | 3 | X | |
| 26 | GS-2012B-Q-011-04 | 00h56m59.03s | -27∘39′15.2′′ | 0.6294 | 3 | X | |
| 27 | GS-2012B-Q-011-04 | 00h57m07.97s | -27∘39′28.5′′ | 0.6525 | 3 | X | |
| 28 | GS-2012B-Q-011-04 | 00h57m04.24s | -27∘39′23.8′′ | 0.5614 | 3 | X | |
| 29 | GS-2012B-Q-011-04 | 00h57m04.76s | -27∘39′09.0′′ | 0.6294 | 3 | X | |
| 30 | GS-2012B-Q-011-04 | 00h57m03.46s | -27∘39′29.6′′ | 0.4123 | 3 | X | |
| 31 | GS-2012B-Q-011-04 | 00h57m02.17s | -27∘40′29.0′′ | 0.5574 | 3 | X | |
| 32 | GS-2012B-Q-011-04 | 00h57m02.74s | -27∘40′15.3′′ | 0.5614 | 3 | X | |
| 33 | GS-2012B-Q-011-04 | 00h57m01.02s | -27∘39′31.7′′ | 0.3893 | 3 | X | |
| 35 | GS-2012B-Q-011-04 | 00h57m02.94s | -27∘40′29.7′′ | 0.5614 | 3 | X |
| ID | Mask | RA(J2000) | Dec(J2000) | z | Quality | Identification | Member |
|---|---|---|---|---|---|---|---|
| 1 | Nastasi et al. (2014) | 01h52m41.30s | -13∘38′55.0′′ | 0.8307 | 2 | ||
| 3 | Nastasi et al. (2014) | 01h52m41.11s | -13∘39′07.9′′ | 0.8303 | 3 | ||
| 4 | Nastasi et al. (2014) | 01h52m42.71s | -13∘38′59.1′′ | 0.8261 | 4 | ||
| 5 | Nastasi et al. (2014) | 01h52m39.41s | -13∘38′55.8′′ | 0.8233 | 3 | ||
| 6 | Nastasi et al. (2014) | 01h52m40.70s | -13∘39′21.0′′ | 0.8261 | 2 | ||
| 7 | Nastasi et al. (2014) | 01h52m40.21s | -13∘39′24.1′′ | 0.8307 | 3 | ||
| 8 | Nastasi et al. (2014) | 01h52m43.20s | -13∘38′29.5′′ | 0.8268 | 3 | ||
| 9 | Nastasi et al. (2014) | 01h52m35.81s | -13∘39′15.0′′ | 0.8326 | 2 | ||
| 11 | Nastasi et al. (2014) | 01h52m47.21s | -13∘38′00.1′′ | 0.8256 | 3 | ||
| 13 | Nastasi et al. (2014) | 01h52m37.01s | -13∘40′15.0′′ | 0.8324 | 2 | ||
| 14 | Nastasi et al. (2014) | 01h52m36.00s | -13∘40′15.9′′ | 0.8295 | 3 | ||
| 15 | Nastasi et al. (2014) | 01h52m32.90s | -13∘40′01.9′′ | 0.8279 | 3 | ||
| 1 | GS-2011B-Q-050-01 | 01h52m47.02s | -13∘41′18.3′′ | 0.3772 | 2 | X | |
| 2 | GS-2011B-Q-050-01 | 01h52m50.28s | -13∘39′20.2′′ | 0.8277 | 3 | X | |
| 7 | GS-2011B-Q-050-01 | 01h52m46.56s | -13∘39′37.1′′ | 0.6377 | 2 | X | |
| 9 | GS-2011B-Q-050-01 | 01h52m41.85s | -13∘40′19.6′′ | 0.8149 | 2 | X | |
| 11 | GS-2011B-Q-050-01 | 01h52m42.62s | -13∘39′50.4′′ | 0.6160 | 2 | X | |
| 12 | GS-2011B-Q-050-01 | 01h52m40.75s | -13∘39′20.9′′ | 0.8250 | 3 | X | |
| 13 | GS-2011B-Q-050-01 | 01h52m41.35s | -13∘38′56.1′′ | 0.8290 | 3 | X | |
| 14 | GS-2011B-Q-050-01 | 01h52m38.16s | -13∘38′54.3′′ | 0.2460 | 3 | X | |
| 15 | GS-2011B-Q-050-01 | 01h52m45.36s | -13∘38′38.5′′ | 0.3533 | 3 | X | |
| 19 | GS-2011B-Q-050-01 | 01h52m38.81s | -13∘38′28.0′′ | 0.8211 | 3 | X | |
| 20 | GS-2011B-Q-050-01 | 01h52m45.02s | -13∘39′26.0′′ | 0.2756 | 3 | X | |
| 23 | GS-2011B-Q-050-01 | 01h52m39.42s | -13∘38′02.8′′ | 0.8211 | 2 | X | |
| 25 | GS-2011B-Q-050-01 | 01h52m33.99s | -13∘38′48.2′′ | 0.7724 | 3 | X | |
| 28 | GS-2011B-Q-050-01 | 01h52m33.31s | -13∘38′45.3′′ | 0.6357 | 3 | X | |
| 29 | GS-2011B-Q-050-01 | 01h52m32.11s | -13∘38′28.7′′ | 0.6345 | 3 | X | |
| 30 | GS-2011B-Q-050-01 | 01h52m34.76s | -13∘37′58.5′′ | 0.3948 | 3 | X | |
| 32 | GS-2011B-Q-050-01 | 01h52m32.62s | -13∘37′44.1′′ | 0.4942 | 2 | X | |
| 4 | GS-2011B-Q-050-02 | 01h52m50.28s | -13∘39′20.2′′ | 0.8276 | 2 | X | |
| 6 | GS-2011B-Q-050-02 | 01h52m44.86s | -13∘40′14.2′′ | 0.4947 | 2 | V | |
| 8 | GS-2011B-Q-050-02 | 01h52m48.15s | -13∘38′53.9′′ | 0.7398 | 2 | X | |
| 9 | GS-2011B-Q-050-02 | 01h52m41.65s | -13∘39′42.5′′ | 0.5290 | 3 | X | |
| 10 | GS-2011B-Q-050-02 | 01h52m39.98s | -13∘39′22.4′′ | 0.8294 | 3 | X | |
| 11 | GS-2011B-Q-050-02 | 01h52m45.13s | -13∘39′09.0′′ | 0.8313 | 2 | X | |
| 16 | GS-2011B-Q-050-02 | 01h52m44.84s | -13∘38′24.8′′ | 0.5340 | 2 | X | |
| 17 | GS-2011B-Q-050-02 | 01h52m43.17s | -13∘38′29.5′′ | 0.8258 | 3 | X | |
| 19 | GS-2011B-Q-050-02 | 01h52m38.37s | -13∘39′22.7′′ | 0.8290 | 2 | X | |
| 21 | GS-2011B-Q-050-02 | 01h52m40.24s | -13∘39′00.4′′ | 0.8193 | 3 | X | |
| 22 | GS-2011B-Q-050-02 | 01h52m37.62s | -13∘38′30.5′′ | 0.8202 | 2 | X | |
| 23 | GS-2011B-Q-050-02 | 01h52m38.75s | -13∘38′24.1′′ | 0.2813 | 3 | X | |
| 26 | GS-2011B-Q-050-02 | 01h52m36.40s | -13∘36′50.5′′ | 0.7283 | 3 | X | |
| 28 | GS-2011B-Q-050-02 | 01h52m32.62s | -13∘37′44.1′′ | 0.4941 | 2 | X | |
| 31 | GS-2011B-Q-050-02 | 01h52m36.01s | -13∘37′45.2′′ | 0.7848 | 2 | X | |
| 32 | GS-2011B-Q-050-02 | 01h52m37.42s | -13∘37′45.5′′ | 0.7858 | 2 | X | |
| 5606 | KECK | 01h52m44.13s | -13∘34′11.9′′ | 0.8140 | |||
| 5612 | KECK | 01h52m44.19s | -13∘34′49.9′′ | 0.8209 | |||
| 5638 | KECK | 01h52m42.02s | -13∘38′40.8′′ | 0.8300 | |||
| 5655 | KECK | 01h52m43.40s | -13∘38′24.1′′ | 0.8348 | |||
| 5688 | KECK | 01h52m42.88s | -13∘38′25.1′′ | 0.8300 | |||
| 5853 | KECK | 01h52m40.42s | -13∘38′20.7′′ | 0.8297 | |||
| 5900 | KECK | 01h52m39.78s | -13∘38′44.0′′ | 0.8222 | |||
| 5909 | KECK | 01h52m39.15s | -13∘40′35.3′′ | 0.8213 | |||
| 5922 | KECK | 01h52m39.52s | -13∘39′50.9′′ | 0.8211 |
| ID | Mask | RA(J2000) | Dec(J2000) | z | Quality | Identification | Member |
|---|---|---|---|---|---|---|---|
| 2 | GS-2012B-Q-011-06 | 02h17m30.50s | -05∘11′31.4′′ | 0.5674 | 3 | X | |
| 3 | GS-2012B-Q-011-06 | 02h17m28.40s | -05∘12′03.6′′ | 0.9216 | 3 | X | |
| 6 | GS-2012B-Q-011-06 | 02h17m27.60s | -05∘13′60.0′′ | 0.6424 | 3 | X | |
| 8 | GS-2012B-Q-011-06 | 02h17m34.35s | -05∘12′43.8′′ | 0.6474 | 3 | X | |
| 10 | GS-2012B-Q-011-06 | 02h17m33.72s | -05∘12′51.6′′ | 0.6408 | 3 | X | |
| 11 | GS-2012B-Q-011-06 | 02h17m35.84s | -05∘12′58.9′′ | 0.8246 | 3 | X | |
| 12 | GS-2012B-Q-011-06 | 02h17m30.52s | -05∘13′21.4′′ | 0.8336 | 2 | X | |
| 13 | GS-2012B-Q-011-06 | 02h17m35.79s | -05∘14′20.1′′ | 0.6454 | 3 | X | |
| 15 | GS-2012B-Q-011-06 | 02h17m32.55s | -05∘12′59.2′′ | 0.6414 | 3 | X | |
| 16 | GS-2012B-Q-011-06 | 02h17m33.02s | -05∘13′13.4′′ | 0.6494 | 3 | V | |
| 17 | GS-2012B-Q-011-06 | 02h17m34.18s | -05∘13′38.8′′ | 0.4443 | 3 | X | |
| 18 | GS-2012B-Q-011-06 | 02h17m34.97s | -05∘13′28.6′′ | 0.6494 | 3 | X | |
| 19 | GS-2012B-Q-011-06 | 02h17m35.92s | -05∘13′28.8′′ | 1.0958 | 3 | X | |
| 20 | GS-2012B-Q-011-06 | 02h17m41.81s | -05∘11′32.9′′ | 0.4963 | 3 | X | |
| 22 | GS-2012B-Q-011-06 | 02h17m38.72s | -05∘13′00.8′′ | 0.6484 | 3 | X | |
| 23 | GS-2012B-Q-011-06 | 02h17m39.37s | -05∘13′32.3′′ | 0.7515 | 3 | X | |
| 24 | GS-2012B-Q-011-06 | 02h17m37.16s | -05∘13′29.0′′ | 0.6444 | 3 | X | |
| 25 | GS-2012B-Q-011-06 | 02h17m38.01s | -05∘13′09.3′′ | 0.6494 | 3 | X | |
| 26 | GS-2012B-Q-011-06 | 02h17m40.15s | -05∘13′13.4′′ | 0.7445 | 3 | X | |
| 27 | GS-2012B-Q-011-06 | 02h17m43.39s | -05∘12′32.3′′ | 0.6504 | 2 | V | |
| 28 | GS-2012B-Q-011-06 | 02h17m42.49s | -05∘12′52.5′′ | 0.4893 | 3 | X | |
| 29 | GS-2012B-Q-011-06 | 02h17m41.00s | -05∘14′03.2′′ | 0.6805 | 3 | X | |
| 30 | GS-2012B-Q-011-06 | 02h17m44.89s | -05∘12′58.0′′ | 0.4233 | 3 | X | |
| 31 | GS-2012B-Q-011-06 | 02h17m45.25s | -05∘13′11.1′′ | 0.2892 | 3 | X | |
| 32 | GS-2012B-Q-011-06 | 02h17m43.79s | -05∘13′47.5′′ | 0.6484 | 3 | V | |
| 33 | GS-2012B-Q-011-06 | 02h17m46.73s | -05∘13′34.3′′ | 0.6454 | 3 | V | |
| 34 | GS-2012B-Q-011-06 | 02h17m46.01s | -05∘13′32.0′′ | 0.5804 | 3 | X |
| ID | Mask | RA(J2000) | Dec(J2000) | z | Quality | Identification | Member |
|---|---|---|---|---|---|---|---|
| 1 | GS-2010B-Q-46-06 | 02h50m22.92s | -31∘03′53.0′′ | 0.8337 | 3 | X | |
| 8 | GS-2010B-Q-46-06 | 02h50m15.25s | -31∘03′33.5′′ | 0.7263 | 3 | X | |
| 9 | GS-2010B-Q-46-06 | 02h50m13.27s | -31∘03′35.7′′ | 0.6168 | 3 | X | |
| 10 | GS-2010B-Q-46-06 | 02h50m12.05s | -31∘03′08.0′′ | 0.7146 | 3 | X | |
| 14 | GS-2010B-Q-46-06 | 02h50m06.63s | -31∘03′13.7′′ | 0.8496 | 3 | X | |
| 15 | GS-2010B-Q-46-06 | 02h50m08.70s | -31∘03′49.7′′ | 0.9052 | 3 | X | |
| 16 | GS-2010B-Q-46-06 | 02h50m03.78s | -31∘03′51.5′′ | 0.3533 | 3 | X | |
| 17 | GS-2010B-Q-46-06 | 02h50m06.89s | -31∘03′51.5′′ | 0.9217 | 3 | X | |
| 18 | GS-2010B-Q-46-06 | 02h50m05.48s | -31∘03′53.0′′ | 0.6972 | 3 | X | |
| 19 | GS-2010B-Q-46-06 | 02h50m04.50s | -31∘03′51.5′′ | 0.9149 | 3 | X | |
| 21 | GS-2010B-Q-46-06 | 02h50m02.79s | -31∘04′04.9′′ | 0.9831 | 3 | X | |
| 22 | GS-2010B-Q-46-06 | 02h50m06.48s | -31∘03′56.9′′ | 0.9069 | 3 | X | |
| 23 | GS-2010B-Q-46-06 | 02h50m09.04s | -31∘04′06.3′′ | 0.7567 | 3 | X | |
| 25 | GS-2010B-Q-46-06 | 02h50m03.83s | -31∘04′34.0′′ | 0.8988 | 3 | X | |
| 26 | GS-2010B-Q-46-06 | 02h50m04.24s | -31∘04′50.6′′ | 0.9095 | 3 | X | |
| 28 | GS-2010B-Q-46-06 | 02h50m04.59s | -31∘05′41.7′′ | 0.6197 | 3 | X | |
| 34 | GS-2010B-Q-46-06 | 02h50m04.26s | -31∘07′05.2′′ | 0.1261 | 3 | X | |
| 1 | GS-2012B-Q-011-09 | 02h50m22.92s | -31∘03′53.0′′ | 0.5924 | 2 | X | |
| 2 | GS-2012B-Q-011-09 | 02h50m18.11s | -31∘03′10.5′′ | 0.9326 | 2 | X | |
| 4 | GS-2012B-Q-011-09 | 02h50m16.05s | -31∘03′23.1′′ | 1.0077 | 2 | X | |
| 5 | GS-2012B-Q-011-09 | 02h50m14.89s | -31∘03′32.1′′ | 0.7245 | 3 | X | |
| 6 | GS-2012B-Q-011-09 | 02h50m14.94s | -31∘02′56.8′′ | 0.9927 | 2 | X | |
| 9 | GS-2012B-Q-011-09 | 02h50m08.98s | -31∘03′01.1′′ | 0.9086 | 3 | X | |
| 10 | GS-2012B-Q-011-09 | 02h50m10.24s | -31∘03′27.8′′ | 0.9056 | 3 | X | |
| 11 | GS-2012B-Q-011-09 | 02h50m07.01s | -31∘01′00.9′′ | 0.5204 | 3 | X | |
| 13 | GS-2012B-Q-011-09 | 02h50m06.54s | -31∘03′44.7′′ | 0.9126 | 3 | X | |
| 17 | GS-2012B-Q-011-09 | 02h50m03.99s | -31∘03′53.0′′ | 0.9176 | 3 | X | |
| 18 | GS-2012B-Q-011-09 | 02h50m07.33s | -31∘04′10.6′′ | 0.9106 | 3 | X | |
| 19 | GS-2012B-Q-011-09 | 02h50m02.67s | -31∘03′26.0′′ | 0.9797 | 3 | X | |
| 20 | GS-2012B-Q-011-09 | 02h50m07.38s | -31∘05′28.7′′ | 0.6494 | 2 | X | |
| 21 | GS-2012B-Q-011-09 | 02h49m58.10s | -31∘03′39.6′′ | 0.8696 | 3 | X | |
| 22 | GS-2012B-Q-011-09 | 02h50m05.48s | -31∘04′40.5′′ | 0.9026 | 2 | X | |
| 27 | GS-2012B-Q-011-09 | 02h49m58.68s | -31∘05′25.8′′ | 0.6274 | 3 | X | |
| 28 | GS-2012B-Q-011-09 | 02h49m59.99s | -31∘05′07.8′′ | 0.8816 | 2 | X | |
| 29 | GS-2012B-Q-011-09 | 02h49m58.60s | -31∘04′59.2′′ | 0.9216 | 3 | X | |
| 30 | GS-2012B-Q-011-09 | 02h50m00.51s | -31∘04′44.5′′ | 0.5654 | 3 | X | |
| 31 | GS-2012B-Q-011-09 | 02h50m04.26s | -31∘07′05.2′′ | 0.9827 | 3 | X |
| ID | Mask | RA(J2000) | Dec(J2000) | z | Quality | Identification | Member |
|---|---|---|---|---|---|---|---|
| 1 | GS-2011B-Q-050-03 | 03h02m13.84s | -00∘00′41.6′′ | 0.4988 | 3 | X | |
| 7 | GS-2011B-Q-050-03 | 03h02m13.04s | 00∘00′41.5′′ | 0.5958 | 3 | X | |
| 9 | GS-2011B-Q-050-03 | 03h02m06.74s | -00∘00′06.1′′ | 0.6432 | 3 | X | |
| 11 | GS-2011B-Q-050-03 | 03h02m07.86s | 00∘00′21.2′′ | 0.6425 | 3 | X | |
| 12 | GS-2011B-Q-050-03 | 03h02m06.20s | -00∘00′04.0′′ | 0.6451 | 3 | X | |
| 13 | GS-2011B-Q-050-03 | 03h02m08.78s | 00∘00′39.9′′ | 0.6486 | 3 | X | |
| 15 | GS-2011B-Q-050-03 | 03h02m05.64s | -00∘00′00.5′′ | 0.6452 | 3 | X | |
| 17 | GS-2011B-Q-050-03 | 03h02m02.94s | -00∘00′53.1′′ | 0.6503 | 3 | X | |
| 19 | GS-2011B-Q-050-03 | 03h02m04.94s | -00∘00′33.0′′ | 0.6477 | 2 | X | |
| 21 | GS-2011B-Q-050-03 | 03h02m02.12s | 00∘00′04.2′′ | 0.6368 | 3 | X | |
| 22 | GS-2011B-Q-050-03 | 03h02m00.91s | -00∘00′53.0′′ | 0.4075 | 3 | X | |
| 23 | GS-2011B-Q-050-03 | 03h02m00.40s | -00∘00′49.9′′ | 0.6482 | 2 | X | |
| 25 | GS-2011B-Q-050-03 | 03h01m59.56s | 00∘00′31.0′′ | 0.4688 | 2 | X | |
| 28 | GS-2011B-Q-050-03 | 03h01m56.38s | 00∘00′59.2′′ | 0.4070 | 2 | X | |
| 31 | GS-2011B-Q-050-03 | 03h01m55.80s | -00∘00′20.3′′ | 0.7886 | 3 | X | |
| 5 | GS-2011B-Q-050-04 | 03h02m11.53s | 00∘00′46.1′′ | 0.4094 | 2 | X | |
| 9 | GS-2011B-Q-050-04 | 03h02m09.28s | -00∘01′04.8′′ | 0.6700 | 3 | X | |
| 11 | GS-2011B-Q-050-04 | 03h02m04.69s | -00∘00′32.1′′ | 0.6435 | 2 | X | |
| 14 | GS-2011B-Q-050-04 | 03h02m08.70s | 00∘01′05.4′′ | 0.6450 | 2 | X | |
| 15 | GS-2011B-Q-050-04 | 03h02m07.94s | 00∘00′30.1′′ | 0.4770 | 3 | X | |
| 16 | GS-2011B-Q-050-04 | 03h02m05.73s | 00∘00′02.0′′ | 0.6390 | 2 | X | |
| 17 | GS-2011B-Q-050-04 | 03h02m05.26s | 00∘00′09.0′′ | 0.6454 | 2 | X | |
| 18 | GS-2011B-Q-050-04 | 03h02m06.46s | 00∘00′00.8′′ | 0.6457 | 2 | X | |
| 23 | GS-2011B-Q-050-04 | 03h02m00.18s | -00∘00′40.1′′ | 0.4694 | 2 | X | |
| 24 | GS-2011B-Q-050-04 | 03h02m00.65s | 00∘00′21.3′′ | 0.4051 | 3 | X | |
| 27 | GS-2011B-Q-050-04 | 03h01m57.71s | -00∘00′34.4′′ | 0.4944 | 2 | X | |
| 29 | GS-2011B-Q-050-04 | 03h01m56.13s | -00∘00′20.8′′ | 0.7888 | 3 | X | |
| 30 | GS-2011B-Q-050-04 | 03h01m56.63s | 00∘00′47.0′′ | 0.9857 | 3 | X | |
| 17 | GS-2011B-Q-050-05 | 03h02m06.06s | -00∘00′53.1′′ | 0.6431 | 2 | X | |
| 18 | GS-2011B-Q-050-05 | 03h02m02.64s | -00∘00′47.7′′ | 0.6609 | 2 | X | |
| 20 | GS-2011B-Q-050-05 | 03h02m04.82s | -00∘00′43.3′′ | 0.6477 | 2 | X | |
| 21 | GS-2011B-Q-050-05 | 03h02m06.50s | -00∘00′27.7′′ | 0.4945 | 2 | X | |
| 26 | GS-2011B-Q-050-05 | 03h01m59.29s | 00∘00′43.5′′ | 0.4070 | 3 | X | |
| 27 | GS-2011B-Q-050-05 | 03h02m00.34s | 00∘00′36.2′′ | 0.4072 | 3 | X | |
| 28 | GS-2011B-Q-050-05 | 03h01m57.26s | -00∘00′31.2′′ | 0.5948 | 3 | X |
| ID | Mask | RA(J2000) | Dec(J2000) | z | Quality | Identification | Member |
|---|---|---|---|---|---|---|---|
| 2 | GS-2010B-Q-046-01 | 09h59m41.78s | 02∘33′39.1′′ | 0.6964 | 3 | X | |
| 3 | GS-2010B-Q-046-01 | 09h59m34.47s | 02∘33′47.0′′ | 0.6766 | 3 | X | |
| 4 | GS-2010B-Q-046-01 | 09h59m43.01s | 02∘32′32.0′′ | 0.6963 | 3 | X | |
| 5 | GS-2010B-Q-046-01 | 09h59m42.91s | 02∘31′49.7′′ | 0.7268 | 3 | X | |
| 7 | GS-2010B-Q-046-01 | 09h59m39.41s | 02∘33′00.1′′ | 0.4701 | 3 | X | |
| 8 | GS-2010B-Q-046-01 | 09h59m39.35s | 02∘32′39.2′′ | 0.6778 | 3 | X | |
| 9 | GS-2010B-Q-046-01 | 09h59m38.13s | 02∘32′11.0′′ | 0.7296 | 3 | X | |
| 10 | GS-2010B-Q-046-01 | 09h59m39.29s | 02∘32′04.1′′ | 0.7317 | 3 | X | |
| 11 | GS-2010B-Q-046-01 | 09h59m35.47s | 02∘31′56.0′′ | 0.3317 | 3 | X | |
| 15 | GS-2010B-Q-046-01 | 09h59m43.71s | 02∘31′01.9′′ | 0.2455 | 3 | X | |
| 16 | GS-2010B-Q-046-01 | 09h59m43.04s | 02∘31′08.7′′ | 0.7314 | 3 | X | |
| 17 | GS-2010B-Q-046-01 | 09h59m42.96s | 02∘31′16.7′′ | 0.7285 | 3 | X | |
| 18 | GS-2010B-Q-046-01 | 09h59m40.88s | 02∘30′34.2′′ | 0.8369 | 3 | X | |
| 20 | GS-2010B-Q-046-01 | 09h59m40.58s | 02∘31′41.2′′ | 0.7248 | 3 | X | |
| 21 | GS-2010B-Q-046-01 | 09h59m41.64s | 02∘31′29.9′′ | 0.7307 | 3 | X | |
| 23 | GS-2010B-Q-046-01 | 09h59m40.98s | 02∘30′40.5′′ | 0.8360 | 3 | X | |
| 24 | GS-2010B-Q-046-01 | 09h59m40.40s | 02∘30′54.6′′ | 0.7169 | 3 | X | |
| 25 | GS-2010B-Q-046-01 | 09h59m44.35s | 02∘29′54.1′′ | 0.7303 | 3 | X | |
| 27 | GS-2010B-Q-046-01 | 09h59m41.46s | 02∘30′18.2′′ | 0.8352 | 3 | X | |
| 28 | GS-2010B-Q-046-01 | 09h59m41.05s | 02∘30′09.9′′ | 0.7156 | 3 | X | |
| 30 | GS-2010B-Q-046-01 | 09h59m35.91s | 02∘29′13.4′′ | 0.7149 | 3 | X | |
| 35 | GS-2010B-Q-046-01 | 09h59m40.98s | 02∘28′49.6′′ | 0.4095 | 3 | X | |
| 6 | GS-2012A-Q-046-01 | 09h59m38.44s | 02∘33′13.9′′ | 0.6603 | 2 | X | |
| 7 | GS-2012A-Q-046-01 | 09h59m38.89s | 02∘33′05.6′′ | 0.7531 | 2 | X | |
| 8 | GS-2012A-Q-046-01 | 09h59m43.03s | 02∘32′00.1′′ | 0.7259 | 2 | X | |
| 9 | GS-2012A-Q-046-01 | 09h59m42.42s | 02∘32′09.3′′ | 0.7289 | 3 | X | |
| 10 | GS-2012A-Q-046-01 | 09h59m42.27s | 02∘31′34.6′′ | 0.7265 | 2 | X | |
| 13 | GS-2012A-Q-046-01 | 09h59m39.70s | 02∘31′19.0′′ | 0.7286 | 3 | X | |
| 14 | GS-2012A-Q-046-01 | 09h59m42.19s | 02∘32′36.8′′ | 0.8893 | 3 | X | |
| 16 | GS-2012A-Q-046-01 | 09h59m41.79s | 02∘32′18.2′′ | 0.5489 | 3 | X | |
| 17 | GS-2012A-Q-046-01 | 09h59m40.25s | 02∘31′10.9′′ | 0.7332 | 3 | X | |
| 18 | GS-2012A-Q-046-01 | 09h59m41.14s | 02∘31′25.8′′ | 0.7290 | 3 | X | |
| 19 | GS-2012A-Q-046-01 | 09h59m42.36s | 02∘30′45.3′′ | 0.7270 | 3 | X | |
| 20 | GS-2012A-Q-046-01 | 09h59m38.94s | 02∘30′59.6′′ | 0.7271 | 3 | X | |
| 21 | GS-2012A-Q-046-01 | 09h59m39.66s | 02∘30′52.1′′ | 0.7186 | 3 | X | |
| 23 | GS-2012A-Q-046-01 | 09h59m43.95s | 02∘29′52.3′′ | 0.7294 | 3 | X | |
| 25 | GS-2012A-Q-046-01 | 09h59m40.35s | 02∘30′19.2′′ | 0.4748 | 2 | X | |
| 26 | GS-2012A-Q-046-01 | 09h59m40.97s | 02∘29′58.6′′ | 0.7309 | 3 | X | |
| 29 | GS-2012A-Q-046-01 | 09h59m40.95s | 02∘29′16.9′′ | 0.4053 | 3 | X | |
| 33 | GS-2012A-Q-046-01 | 09h59m38.40s | 02∘28′40.2′′ | 0.7542 | 3 | X | |
| 35 | GS-2012A-Q-046-01 | 09h59m40.88s | 02∘28′46.8′′ | 0.2494 | 3 | X | |
| 1 | GS-2012A-Q-046-02 | 09h59m46.92s | 02∘33′46.3′′ | 0.6901 | 2 | X | |
| 5 | GS-2012A-Q-046-02 | 09h59m43.78s | 02∘31′54.5′′ | 0.4687 | 3 | X | |
| 8 | GS-2012A-Q-046-02 | 09h59m40.81s | 02∘31′34.3′′ | 0.7286 | 3 | X | |
| 11 | GS-2012A-Q-046-02 | 09h59m39.41s | 02∘33′00.1′′ | 0.4703 | 3 | X | |
| 12 | GS-2012A-Q-046-02 | 09h59m38.57s | 02∘33′06.8′′ | 0.7515 | 3 | X | |
| 15 | GS-2012A-Q-046-02 | 09h59m39.41s | 02∘32′20.4′′ | 1.1040 | 3 | X | |
| 16 | GS-2012A-Q-046-02 | 09h59m38.58s | 02∘32′12.6′′ | 0.4419 | 3 | X | |
| 19 | GS-2012A-Q-046-02 | 09h59m40.65s | 02∘31′15.9′′ | 0.7295 | 3 | X | |
| 20 | GS-2012A-Q-046-02 | 09h59m39.45s | 02∘30′38.5′′ | 0.7242 | 3 | X | |
| 23 | GS-2012A-Q-046-02 | 09h59m42.80s | 02∘30′08.8′′ | 0.7248 | 3 | X | |
| 25 | GS-2012A-Q-046-02 | 09h59m38.38s | 02∘30′16.4′′ | 0.7295 | 3 | X | |
| 26 | GS-2012A-Q-046-02 | 09h59m40.52s | 02∘30′02.4′′ | 0.7308 | 3 | X | |
| 31 | GS-2012A-Q-046-02 | 09h59m40.67s | 02∘29′32.9′′ | 0.9603 | 2 | X | |
| 33 | GS-2012A-Q-046-02 | 09h59m39.64s | 02∘28′37.8′′ | 0.2489 | 3 | X | |
| 34 | GS-2012A-Q-046-02 | 09h59m40.88s | 02∘28′46.8′′ | 0.2495 | 3 | X |
| ID | Mask | RA(J2000) | Dec(J2000) | z | Quality | Identification | Member |
|---|---|---|---|---|---|---|---|
| 2 | GS-2010B-Q-046-03 | 11h24m00.44s | 05∘27′13.8′′ | 0.4726 | 3 | X | |
| 4 | GS-2010B-Q-046-03 | 11h24m00.65s | 05∘27′42.1′′ | 0.3752 | 3 | X | |
| 5 | GS-2010B-Q-046-03 | 11h24m00.16s | 05∘27′43.0′′ | 0.1554 | 3 | X | |
| 6 | GS-2010B-Q-046-03 | 11h24m02.58s | 05∘28′43.8′′ | 0.3942 | 3 | X | |
| 11 | GS-2010B-Q-046-03 | 11h23m58.50s | 05∘28′10.8′′ | 0.6544 | 3 | X | |
| 12 | GS-2010B-Q-046-03 | 11h23m59.15s | 05∘28′07.0′′ | 0.5945 | 3 | X | |
| 13 | GS-2010B-Q-046-03 | 11h23m57.11s | 05∘28′34.9′′ | 0.6514 | 3 | X | |
| 14 | GS-2010B-Q-046-03 | 11h23m56.49s | 05∘29′01.0′′ | 0.6567 | 3 | X | |
| 15 | GS-2010B-Q-046-03 | 11h23m59.97s | 05∘29′13.0′′ | 0.3750 | 3 | X | |
| 16 | GS-2010B-Q-046-03 | 11h23m48.65s | 05∘28′09.0′′ | 0.5299 | 3 | X | |
| 17 | GS-2010B-Q-046-03 | 11h23m51.43s | 05∘28′49.7′′ | 0.6569 | 3 | X | |
| 18 | GS-2010B-Q-046-03 | 11h23m52.17s | 05∘28′51.5′′ | 0.6557 | 3 | X | |
| 19 | GS-2010B-Q-046-03 | 11h23m50.28s | 05∘29′13.9′′ | 0.6557 | 3 | X | |
| 21 | GS-2010B-Q-046-03 | 11h23m50.49s | 05∘29′32.2′′ | 0.6551 | 3 | X | |
| 25 | GS-2010B-Q-046-03 | 11h23m53.46s | 05∘29′04.3′′ | 0.3747 | 3 | X | |
| 26 | GS-2010B-Q-046-03 | 11h23m50.06s | 05∘29′35.8′′ | 0.6591 | 3 | X | |
| 27 | GS-2010B-Q-046-03 | 11h23m43.65s | 05∘28′04.6′′ | 0.6552 | 3 | X | |
| 28 | GS-2010B-Q-046-03 | 11h23m48.89s | 05∘29′36.5′′ | 0.6478 | 3 | X | |
| 30 | GS-2010B-Q-046-03 | 11h23m46.52s | 05∘29′52.2′′ | 0.5826 | 3 | X | |
| 31 | GS-2010B-Q-046-03 | 11h23m46.33s | 05∘30′09.1′′ | 0.6543 | 3 | X | |
| 32 | GS-2010B-Q-046-03 | 11h23m47.45s | 05∘29′57.6′′ | 0.6389 | 3 | X | |
| 33 | GS-2010B-Q-046-03 | 11h23m47.88s | 05∘29′54.6′′ | 0.6496 | 3 | X | |
| 2 | GS2012AQ046-05 | 11h23m59.56s | 05∘26′58.8′′ | 0.4146 | 3 | X | |
| 7 | GS2012AQ046-05 | 11h23m52.84s | 05∘27′18.3′′ | 0.6487 | 3 | X | |
| 14 | GS2012AQ046-05 | 11h23m56.35s | 05∘29′01.0′′ | 0.2713 | 2 | X | |
| 15 | GS2012AQ046-05 | 11h23m55.48s | 05∘29′02.5′′ | 0.6603 | 2 | X | |
| 16 | GS2012AQ046-05 | 11h24m00.33s | 05∘29′21.8′′ | 0.6559 | 2 | X | |
| 19 | GS2012AQ046-05 | 11h23m49.80s | 05∘28′47.3′′ | 0.6551 | 2 | X | |
| 20 | GS2012AQ046-05 | 11h23m52.23s | 05∘28′33.8′′ | 0.2704 | 2 | X | |
| 23 | GS2012AQ046-05 | 11h23m49.77s | 05∘29′29.6′′ | 0.6173 | 2 | X | |
| 26 | GS2012AQ046-05 | 11h23m53.92s | 05∘28′49.5′′ | 0.6550 | 3 | X | |
| 32 | GS2012AQ046-05 | 11h23m48.09s | 05∘30′40.6′′ | 0.2154 | 3 | X | |
| 3 | GS2012AQ046-06 | 11h24m00.02s | 05∘27′32.8′′ | 0.4144 | 3 | X | |
| 6 | GS2012AQ046-06 | 11h23m59.87s | 05∘27′53.9′′ | 0.4714 | 3 | X | |
| 12 | GS2012AQ046-06 | 11h23m59.15s | 05∘28′07.0′′ | 0.5944 | 2 | X | |
| 13 | GS2012AQ046-06 | 11h23m57.44s | 05∘29′05.2′′ | 0.6511 | 3 | X | |
| 14 | GS2012AQ046-06 | 11h24m01.00s | 05∘29′07.5′′ | 0.3749 | 3 | X | |
| 15 | GS2012AQ046-06 | 11h23m50.31s | 05∘28′06.3′′ | 0.6129 | 3 | X | |
| 17 | GS2012AQ046-06 | 11h23m51.87s | 05∘28′25.8′′ | 0.5517 | 3 | X | |
| 18 | GS2012AQ046-06 | 11h23m50.07s | 05∘29′00.3′′ | 0.6378 | 3 | X | |
| 19 | GS2012AQ046-06 | 11h23m52.14s | 05∘28′56.7′′ | 0.6515 | 3 | X | |
| 20 | GS2012AQ046-06 | 11h23m54.84s | 05∘29′04.5′′ | 0.6381 | 3 | X | |
| 23 | GS2012AQ046-06 | 11h23m55.15s | 05∘30′28.9′′ | 0.3745 | 3 | X | |
| 27 | GS2012AQ046-06 | 11h23m48.05s | 05∘29′40.3′′ | 0.8828 | 3 | X | |
| 28 | GS2012AQ046-06 | 11h23m51.48s | 05∘30′27.4′′ | 0.4231 | 3 | X | |
| 30 | GS2012AQ046-06 | 11h23m45.31s | 05∘29′57.0′′ | 0.5678 | 2 | X | |
| 32 | GS2012AQ046-06 | 11h23m49.50s | 05∘30′51.6′′ | 0.6562 | 3 | X |
| ID | Mask | RA(J2000) | Dec(J2000) | z | Quality | Identification | Member |
|---|---|---|---|---|---|---|---|
| 3 | GS-2012A-Q-046-07 | 11h35m58.38s | -03∘31′15.8′′ | 1.0306 | 3 | X | |
| 5 | GS-2012A-Q-046-07 | 11h35m59.26s | -03∘31′33.9′′ | 0.8323 | 3 | X | |
| 6 | GS-2012A-Q-046-07 | 11h35m59.51s | -03∘32′04.2′′ | 0.8353 | 3 | X | |
| 8 | GS-2012A-Q-046-07 | 11h36m01.95s | -03∘31′10.1′′ | 0.8255 | 3 | X | |
| 9 | GS-2012A-Q-046-07 | 11h36m02.76s | -03∘31′04.6′′ | 0.8841 | 3 | X | |
| 11 | GS-2012A-Q-046-07 | 11h36m01.15s | -03∘29′33.8′′ | 0.8215 | 3 | X | |
| 12 | GS-2012A-Q-046-07 | 11h36m04.68s | -03∘30′39.0′′ | 0.8266 | 3 | X | |
| 13 | GS-2012A-Q-046-07 | 11h36m04.36s | -03∘30′17.7′′ | 0.8265 | 3 | X | |
| 14 | GS-2012A-Q-046-07 | 11h36m03.15s | -03∘30′00.7′′ | 0.8339 | 3 | X | |
| 15 | GS-2012A-Q-046-07 | 11h36m04.33s | -03∘30′30.7′′ | 0.8332 | 3 | X | |
| 16 | GS-2012A-Q-046-07 | 11h36m06.69s | -03∘30′14.3′′ | 0.7021 | 3 | X | |
| 17 | GS-2012A-Q-046-07 | 11h36m04.13s | -03∘29′47.9′′ | 0.8253 | 3 | X | |
| 18 | GS-2012A-Q-046-07 | 11h36m03.74s | -03∘29′54.7′′ | 0.8314 | 3 | X | |
| 20 | GS-2012A-Q-046-07 | 11h36m00.34s | -03∘29′20.0′′ | 0.8250 | 3 | X | |
| 21 | GS-2012A-Q-046-07 | 11h36m01.38s | -03∘28′56.4′′ | 0.9718 | 2 | X | |
| 22 | GS-2012A-Q-046-07 | 11h36m01.43s | -03∘29′11.3′′ | 0.8254 | 3 | X | |
| 23 | GS-2012A-Q-046-07 | 11h36m10.03s | -03∘29′19.2′′ | 0.6508 | 3 | X | |
| 24 | GS-2012A-Q-046-07 | 11h36m09.58s | -03∘29′05.1′′ | 0.6502 | 3 | X | |
| 25 | GS-2012A-Q-046-07 | 11h36m05.87s | -03∘28′39.5′′ | 0.8265 | 3 | X | |
| 26 | GS-2012A-Q-046-07 | 11h36m04.83s | -03∘28′22.6′′ | 0.8831 | 3 | X | |
| 28 | GS-2012A-Q-046-07 | 11h36m03.95s | -03∘27′59.7′′ | 0.8307 | 3 | X | |
| 34 | GS-2012A-Q-046-07 | 11h36m02.55s | -03∘27′08.5′′ | 0.6434 | 3 | X | |
| 36 | GS-2012A-Q-046-07 | 11h36m04.01s | -03∘27′32.0′′ | 0.8370 | 3 | X | |
| 9 | GS-2012A-Q-046-08 | 11h36m04.48s | -03∘31′58.9′′ | 0.5370 | 2 | X | |
| 11 | GS-2012A-Q-046-08 | 11h35m58.58s | -03∘29′58.4′′ | 0.2058 | 3 | X | |
| 12 | GS-2012A-Q-046-08 | 11h36m00.27s | -03∘30′31.0′′ | 0.7022 | 3 | X | |
| 13 | GS-2012A-Q-046-08 | 11h36m03.65s | -03∘29′52.4′′ | 0.8328 | 3 | V | |
| 15 | GS-2012A-Q-046-08 | 11h36m02.47s | -03∘29′25.7′′ | 0.6884 | 2 | X | |
| 16 | GS-2012A-Q-046-08 | 11h36m05.41s | -03∘29′38.6′′ | 0.8298 | 3 | X | |
| 17 | GS-2012A-Q-046-08 | 11h36m04.64s | -03∘30′23.3′′ | 0.8242 | 3 | X | |
| 18 | GS-2012A-Q-046-08 | 11h36m06.05s | -03∘30′18.4′′ | 0.8296 | 3 | X | |
| 19 | GS-2012A-Q-046-08 | 11h36m02.55s | -03∘29′58.6′′ | 0.8307 | 3 | X | |
| 20 | GS-2012A-Q-046-08 | 11h36m02.67s | -03∘29′40.5′′ | 0.8274 | 3 | X | |
| 22 | GS-2012A-Q-046-08 | 11h36m03.71s | -03∘29′10.8′′ | 0.4067 | 2 | X | |
| 24 | GS-2012A-Q-046-08 | 11h36m04.25s | -03∘29′18.3′′ | 0.8357 | 3 | X | |
| 30 | GS-2012A-Q-046-08 | 11h36m04.70s | -03∘28′14.5′′ | 0.1869 | 3 | X |
| ID | Mask | RA(J2000) | Dec(J2000) | z | Quality | Identification | Member |
|---|---|---|---|---|---|---|---|
| 4 | GS-2012A-Q-046-10 | 13h42m58.07s | -00∘02′43.9′′ | 0.8343 | 3 | X | |
| 5 | GS-2012A-Q-046-10 | 13h42m59.51s | 00∘00′08.0′′ | 0.6925 | 3 | X | |
| 6 | GS-2012A-Q-046-10 | 13h42m56.97s | -00∘00′47.4′′ | 0.4383 | 3 | X | |
| 7 | GS-2012A-Q-046-10 | 13h42m58.82s | -00∘00′53.6′′ | 0.8342 | 3 | X | |
| 8 | GS-2012A-Q-046-10 | 13h43m02.03s | -00∘01′17.4′′ | 0.6829 | 3 | X | |
| 9 | GS-2012A-Q-046-10 | 13h42m59.93s | -00∘01′20.0′′ | 0.5510 | 3 | X | |
| 10 | GS-2012A-Q-046-10 | 13h43m01.63s | -00∘01′41.7′′ | 0.6833 | 3 | X | |
| 11 | GS-2012A-Q-046-10 | 13h42m59.07s | -00∘01′45.5′′ | 0.4123 | 3 | X | |
| 12 | GS-2012A-Q-046-10 | 13h42m59.26s | -00∘01′33.3′′ | 0.6865 | 3 | X | |
| 13 | GS-2012A-Q-046-10 | 13h43m00.57s | -00∘01′23.8′′ | 0.6962 | 3 | X | |
| 15 | GS-2012A-Q-046-10 | 13h43m02.82s | -00∘00′28.3′′ | 0.6956 | 3 | X | |
| 17 | GS-2012A-Q-046-10 | 13h43m04.11s | -00∘01′50.1′′ | 0.6896 | 3 | X | |
| 18 | GS-2012A-Q-046-10 | 13h43m04.57s | -00∘00′56.4′′ | 0.6912 | 3 | X | |
| 19 | GS-2012A-Q-046-10 | 13h43m02.71s | -00∘01′13.1′′ | 0.6913 | 3 | X | |
| 21 | GS-2012A-Q-046-10 | 13h43m04.00s | -00∘00′55.2′′ | 0.6849 | 3 | X | |
| 23 | GS-2012A-Q-046-10 | 13h43m09.21s | 00∘00′23.1′′ | 0.6152 | 3 | X | |
| 24 | GS-2012A-Q-046-10 | 13h43m06.79s | 00∘00′09.5′′ | 0.3847 | 2 | X | |
| 26 | GS-2012A-Q-046-10 | 13h43m08.82s | -00∘00′04.8′′ | 0.7017 | 2 | X | |
| 27 | GS-2012A-Q-046-10 | 13h43m09.97s | -00∘01′11.0′′ | 0.6906 | 3 | X | |
| 28 | GS-2012A-Q-046-10 | 13h43m07.82s | -00∘00′51.4′′ | 0.6911 | 3 | X | |
| 29 | GS-2012A-Q-046-10 | 13h43m08.21s | -00∘00′30.5′′ | 0.6958 | 3 | X | |
| 30 | GS-2012A-Q-046-10 | 13h43m10.30s | 00∘00′35.0′′ | 0.6847 | 3 | X | |
| 31 | GS-2012A-Q-046-10 | 13h43m09.80s | 00∘00′25.8′′ | 0.5491 | 3 | X | |
| 34 | GS-2012A-Q-046-10 | 13h43m12.93s | 00∘00′20.8′′ | 0.2190 | 2 | X | |
| 35 | GS-2012A-Q-046-10 | 13h43m13.05s | -00∘00′08.6′′ | 0.6865 | 3 | X | |
| 36 | GS-2012A-Q-046-10 | 13h43m13.85s | -00∘01′02.2′′ | 0.7952 | 2 | X | |
| 3 | GS-2012A-Q-046-11 | 13h42m54.94s | -00∘01′04.6′′ | 0.8149 | 3 | X | |
| 8 | GS-2012A-Q-046-11 | 13h43m02.43s | -00∘01′38.7′′ | 0.6902 | 2 | X | |
| 10 | GS-2012A-Q-046-11 | 13h43m00.20s | -00∘02′15.2′′ | 0.6864 | 3 | V | |
| 11 | GS-2012A-Q-046-11 | 13h43m00.10s | -00∘01′12.5′′ | 0.6793 | 2 | X | |
| 13 | GS-2012A-Q-046-11 | 13h42m59.42s | -00∘01′18.7′′ | 0.6018 | 2 | X | |
| 14 | GS-2012A-Q-046-11 | 13h43m02.31s | -00∘00′50.9′′ | 0.6909 | 2 | X | |
| 15 | GS-2012A-Q-046-11 | 13h43m03.97s | -00∘01′25.9′′ | 0.6801 | 3 | X | |
| 16 | GS-2012A-Q-046-11 | 13h43m05.18s | -00∘01′48.0′′ | 0.5474 | 2 | X | |
| 18 | GS-2012A-Q-046-11 | 13h43m04.65s | -00∘00′57.3′′ | 0.6901 | 2 | X | |
| 19 | GS-2012A-Q-046-11 | 13h43m04.77s | -00∘00′44.0′′ | 0.6986 | 2 | X | |
| 21 | GS-2012A-Q-046-11 | 13h43m07.84s | 00∘00′19.6′′ | 0.2707 | 2 | X | |
| 23 | GS-2012A-Q-046-11 | 13h43m08.50s | 00∘00′17.4′′ | 0.7942 | 2 | X | |
| 30 | GS-2012A-Q-046-11 | 13h43m12.41s | 00∘01′23.7′′ | 0.6895 | 2 | X | |
| 32 | GS-2012A-Q-046-11 | 13h43m12.93s | 00∘00′20.8′′ | 0.8020 | 2 | X |
| ID | Mask | RA(J2000) | Dec(J2000) | z | Quality | Identification | Member |
|---|---|---|---|---|---|---|---|
| 1 | Nastasi et al. (2014) | 14h50m09.30s | 09∘04′39.3′′ | 0.6419 | 3 | ||
| 2 | Nastasi et al. (2014) | 14h50m09.20s | 09∘04′45.1′′ | 0.6425 | 3 | ||
| 3 | Nastasi et al. (2014) | 14h50m10.40s | 09∘04′23.5′′ | 0.6418 | 2 | ||
| 4 | Nastasi et al. (2014) | 14h50m09.50s | 09∘04′15.9′′ | 0.6430 | 3 | ||
| 5 | Nastasi et al. (2014) | 14h50m07.40s | 09∘04′28.8′′ | 0.6429 | 3 | ||
| 6 | Nastasi et al. (2014) | 14h50m09.30s | 09∘04′06.5′′ | 0.6377 | 3 | ||
| 7 | Nastasi et al. (2014) | 14h50m10.40s | 09∘03′53.4′′ | 0.6462 | 2 | ||
| 8 | Nastasi et al. (2014) | 14h50m10.61s | 09∘05′32.4′′ | 0.6379 | 3 | ||
| 9 | Nastasi et al. (2014) | 14h50m13.80s | 09∘03′21.9′′ | 0.6407 | 3 | ||
| 10 | Nastasi et al. (2014) | 14h50m16.01s | 09∘02′57.6′′ | 0.6420 | 2 | ||
| 11 | Nastasi et al. (2014) | 14h50m04.91s | 09∘06′55.1′′ | 0.6405 | 3 | ||
| 3 | GN-2012A-Q-070-05 | 14h50m12.84s | 09∘02′45.1′′ | 0.5093 | 3 | X | |
| 6 | GN-2012A-Q-070-05 | 14h50m07.25s | 09∘02′58.0′′ | 0.5064 | 2 | X | |
| 9 | GN-2012A-Q-070-05 | 14h50m10.22s | 09∘02′50.9′′ | 0.5889 | 3 | X | |
| 11 | GN-2012A-Q-070-05 | 14h50m11.80s | 09∘03′56.4′′ | 0.6405 | 3 | X | |
| 12 | GN-2012A-Q-070-05 | 14h50m09.37s | 09∘04′06.5′′ | 0.6367 | 2 | X | |
| 13 | GN-2012A-Q-070-05 | 14h50m09.53s | 09∘04′15.9′′ | 0.6430 | 3 | X | |
| 14 | GN-2012A-Q-070-05 | 14h50m09.97s | 09∘04′36.0′′ | 0.3242 | 3 | X | |
| 15 | GN-2012A-Q-070-05 | 14h50m13.80s | 09∘03′21.9′′ | 0.6403 | 3 | X | |
| 16 | GN-2012A-Q-070-05 | 14h50m09.86s | 09∘04′27.2′′ | 0.6412 | 2 | X | |
| 17 | GN-2012A-Q-070-05 | 14h50m09.29s | 09∘04′39.2′′ | 0.6398 | 3 | X | |
| 22 | GN-2012A-Q-070-05 | 14h50m11.94s | 09∘05′40.3′′ | 0.6455 | 3 | X | |
| 24 | GN-2012A-Q-070-05 | 14h50m01.45s | 09∘05′06.9′′ | 0.6355 | 3 | X | |
| 27 | GN-2012A-Q-070-05 | 14h50m02.90s | 09∘05′45.5′′ | 0.4828 | 3 | X | |
| 31 | GN-2012A-Q-070-05 | 14h50m07.98s | 09∘06′52.6′′ | 0.3705 | 3 | X | |
| 1 | GN-2012A-Q-070-06 | 14h50m09.49s | 09∘01′54.0′′ | 0.8757 | 2 | X | |
| 3 | GN-2012A-Q-070-06 | 14h50m08.46s | 09∘02′24.2′′ | 0.2673 | 2 | X | |
| 4 | GN-2012A-Q-070-06 | 14h50m09.14s | 09∘02′21.3′′ | 0.7059 | 2 | X | |
| 7 | GN-2012A-Q-070-06 | 14h50m09.00s | 09∘03′16.8′′ | 0.6403 | 2 | X | |
| 10 | GN-2012A-Q-070-06 | 14h50m09.73s | 09∘04′11.7′′ | 0.6372 | 3 | X | |
| 12 | GN-2012A-Q-070-06 | 14h50m12.48s | 09∘03′16.6′′ | 0.5840 | 3 | X | |
| 15 | GN-2012A-Q-070-06 | 14h50m09.12s | 09∘04′25.8′′ | 0.8099 | 3 | X | |
| 18 | GN-2012A-Q-070-06 | 14h50m10.65s | 09∘05′32.0′′ | 0.6363 | 3 | X | |
| 21 | GN-2012A-Q-070-06 | 14h50m14.62s | 09∘05′46.7′′ | 0.7252 | 3 | X | |
| 1 | GN-2012A-Q-070-07 | 14h50m15.96s | 09∘02′22.7′′ | 0.5646 | 2 | X | |
| 6 | GN-2012A-Q-070-07 | 14h50m07.24s | 09∘02′45.5′′ | 1.0768 | 3 | X | |
| 11 | GN-2012A-Q-070-07 | 14h50m09.42s | 09∘04′11.9′′ | 0.6457 | 2 | X | |
| 12 | GN-2012A-Q-070-07 | 14h50m13.56s | 09∘03′51.6′′ | 0.2948 | 3 | X | |
| 13 | GN-2012A-Q-070-07 | 14h50m10.59s | 09∘03′54.8′′ | 0.2282 | 3 | X | |
| 14 | GN-2012A-Q-070-07 | 14h50m08.87s | 09∘04′18.6′′ | 0.6444 | 3 | X | |
| 15 | GN-2012A-Q-070-07 | 14h50m08.55s | 09∘04′27.9′′ | 0.7346 | 2 | X | |
| 16 | GN-2012A-Q-070-07 | 14h50m09.51s | 09∘03′59.3′′ | 0.6413 | 2 | X | |
| 19 | GN-2012A-Q-070-07 | 14h50m09.38s | 09∘04′45.0′′ | 0.6455 | 3 | X | |
| 22 | GN-2012A-Q-070-07 | 14h50m01.03s | 09∘04′50.5′′ | 0.6417 | 3 | X | |
| 25 | GN-2012A-Q-070-07 | 14h50m03.59s | 09∘05′33.3′′ | 0.6411 | 2 | X | |
| 26 | GN-2012A-Q-070-07 | 14h50m03.83s | 09∘06′15.5′′ | 0.4833 | 3 | X | |
| 27 | GN-2012A-Q-070-07 | 14h50m04.34s | 09∘06′04.2′′ | 0.6367 | 2 | X | |
| 32 | GN-2012A-Q-070-07 | 14h50m07.98s | 09∘06′52.6′′ | 0.3702 | 3 | X |
| ID | Mask | RA(J2000) | Dec(J2000) | z | Quality | Identification | Member |
|---|---|---|---|---|---|---|---|
| 5 | GS-2010B-Q-046-04 | 21h52m20.26s | -27∘28′46.6′′ | 0.4662 | 2 | X | |
| 8 | GS-2010B-Q-046-04 | 21h52m16.97s | -27∘28′39.8′′ | 0.6330 | 3 | X | |
| 12 | GS-2010B-Q-046-04 | 21h52m23.98s | -27∘30′29.9′′ | 0.8217 | 3 | X | |
| 13 | GS-2010B-Q-046-04 | 21h52m19.74s | -27∘30′32.1′′ | 0.8262 | 2 | X | |
| 14 | GS-2010B-Q-046-04 | 21h52m14.96s | -27∘30′00.0′′ | 0.8293 | 3 | X | |
| 17 | GS-2010B-Q-046-04 | 21h52m17.29s | -27∘29′22.2′′ | 0.8297 | 2 | X | |
| 19 | GS-2010B-Q-046-04 | 21h52m20.19s | -27∘29′52.9′′ | 0.8281 | 2 | X | |
| 20 | GS-2010B-Q-046-04 | 21h52m20.14s | -27∘30′22.7′′ | 0.8203 | 2 | X | |
| 21 | GS-2010B-Q-046-04 | 21h52m16.77s | -27∘29′44.6′′ | 0.5923 | 3 | X | |
| 22 | GS-2010B-Q-046-04 | 21h52m21.69s | -27∘30′05.5′′ | 0.8308 | 2 | X | |
| 26 | GS-2010B-Q-046-04 | 21h52m24.86s | -27∘30′59.8′′ | 0.8076 | 3 | X | |
| 27 | GS-2010B-Q-046-04 | 21h52m25.06s | -27∘31′42.7′′ | 0.4450 | 3 | X | |
| 31 | GS-2010B-Q-046-04 | 21h52m23.85s | -27∘31′20.3′′ | 0.8287 | 2 | X | |
| 32 | GS-2010B-Q-046-04 | 21h52m24.29s | -27∘32′05.7′′ | 0.8240 | 3 | X | |
| 36 | GS-2010B-Q-046-04 | 21h52m22.99s | -27∘32′50.7′′ | 0.7358 | 3 | X | |
| 2 | GS-2011B-Q-050-06 | 21h52m14.59s | -27∘28′22.5′′ | 0.7984 | 2 | X | |
| 6 | GS-2011B-Q-050-06 | 21h52m20.57s | -27∘29′08.9′′ | 0.5914 | 3 | X | |
| 8 | GS-2011B-Q-050-06 | 21h52m16.51s | -27∘28′45.2′′ | 0.6038 | 3 | X | |
| 9 | GS-2011B-Q-050-06 | 21h52m19.78s | -27∘28′45.5′′ | 0.4569 | 3 | X | |
| 11 | GS-2011B-Q-050-06 | 21h52m17.31s | -27∘29′43.8′′ | 0.4667 | 2 | X | |
| 14 | GS-2011B-Q-050-06 | 21h52m19.90s | -27∘29′23.0′′ | 0.8057 | 2 | X | |
| 15 | GS-2011B-Q-050-06 | 21h52m24.86s | -27∘30′54.4′′ | 0.6334 | 3 | X | |
| 17 | GS-2011B-Q-050-06 | 21h52m22.36s | -27∘29′59.0′′ | 0.8292 | 3 | X | |
| 18 | GS-2011B-Q-050-06 | 21h52m20.58s | -27∘30′26.0′′ | 0.8264 | 3 | X | |
| 19 | GS-2011B-Q-050-06 | 21h52m18.98s | -27∘30′50.1′′ | 0.8271 | 2 | X | |
| 25 | GS-2011B-Q-050-06 | 21h52m19.95s | -27∘31′28.2′′ | 0.8251 | 3 | X | |
| 26 | GS-2011B-Q-050-06 | 21h52m20.67s | -27∘30′18.8′′ | 0.8240 | 3 | X | |
| 34 | GS-2011B-Q-050-06 | 21h52m23.51s | -27∘32′34.8′′ | 0.8111 | 2 | X | |
| 12 | GS-2011B-Q-050-07 | 21h52m18.37s | -27∘30′18.4′′ | 0.5314 | 3 | X | |
| 13 | GS-2011B-Q-050-07 | 21h52m21.22s | -27∘30′21.3′′ | 0.8305 | 3 | X | |
| 14 | GS-2011B-Q-050-07 | 21h52m20.05s | -27∘30′34.2′′ | 0.8313 | 3 | X | |
| 15 | GS-2011B-Q-050-07 | 21h52m20.78s | -27∘29′43.1′′ | 0.4419 | 3 | X | |
| 16 | GS-2011B-Q-050-07 | 21h52m15.57s | -27∘29′12.9′′ | 0.7362 | 3 | X | |
| 20 | GS-2011B-Q-050-07 | 21h52m21.11s | -27∘30′37.5′′ | 0.8383 | 3 | X | |
| 26 | GS-2011B-Q-050-07 | 21h52m26.17s | -27∘31′26.5′′ | 0.4950 | 2 | X |
| ID | Mask | RA(J2000) | Dec(J2000) | z | Quality | Identification | Member |
|---|---|---|---|---|---|---|---|
| 1 | GN-2012A-Q-070-10 | 23h02m39.79s | 08∘42′48.1′′ | 0.7148 | 3 | X | |
| 2 | GN-2012A-Q-070-10 | 23h02m38.96s | 08∘42′33.7′′ | 0.7141 | 3 | X | |
| 4 | GN-2012A-Q-070-10 | 23h02m39.70s | 08∘42′25.3′′ | 0.7169 | 3 | X | |
| 9 | GN-2012A-Q-070-10 | 23h02m42.62s | 08∘43′57.4′′ | 0.7235 | 2 | X | |
| 11 | GN-2012A-Q-070-10 | 23h02m43.85s | 08∘43′55.2′′ | 0.7291 | 3 | X | |
| 12 | GN-2012A-Q-070-10 | 23h02m42.24s | 08∘42′57.6′′ | 0.7231 | 3 | X | |
| 14 | GN-2012A-Q-070-10 | 23h02m43.02s | 08∘42′48.4′′ | 0.6239 | 3 | X | |
| 16 | GN-2012A-Q-070-10 | 23h02m47.41s | 08∘44′10.3′′ | 0.7152 | 3 | X | |
| 17 | GN-2012A-Q-070-10 | 23h02m48.36s | 08∘43′54.2′′ | 0.7192 | 3 | X | |
| 18 | GN-2012A-Q-070-10 | 23h02m49.81s | 08∘43′45.2′′ | 0.7181 | 3 | X | |
| 19 | GN-2012A-Q-070-10 | 23h02m47.90s | 08∘43′23.0′′ | 0.7107 | 3 | X | |
| 20 | GN-2012A-Q-070-10 | 23h02m47.40s | 08∘43′13.9′′ | 0.8648 | 3 | X | |
| 22 | GN-2012A-Q-070-10 | 23h02m51.32s | 08∘45′14.6′′ | 0.6157 | 3 | X | |
| 23 | GN-2012A-Q-070-10 | 23h02m52.81s | 08∘45′17.2′′ | 0.4820 | 3 | X | |
| 25 | GN-2012A-Q-070-10 | 23h02m53.25s | 08∘44′37.2′′ | 0.7244 | 3 | X | |
| 27 | GN-2012A-Q-070-10 | 23h02m52.60s | 08∘44′00.3′′ | 0.7261 | 3 | X | |
| 28 | GN-2012A-Q-070-10 | 23h02m51.71s | 08∘43′52.4′′ | 0.7104 | 3 | X | |
| 29 | GN-2012A-Q-070-10 | 23h02m51.41s | 08∘43′38.7′′ | 0.7166 | 3 | X | |
| 31 | GN-2012A-Q-070-10 | 23h02m54.65s | 08∘46′40.9′′ | 0.7212 | 3 | X | |
| 33 | GN-2012A-Q-070-10 | 23h02m56.04s | 08∘45′03.7′′ | 0.4818 | 3 | X | |
| 34 | GN-2012A-Q-070-10 | 23h02m55.68s | 08∘44′52.0′′ | 0.7171 | 2 | X | |
| 11 | GN-2012A-Q-070-11 | 23h02m41.64s | 08∘43′44.2′′ | 0.7157 | 3 | X | |
| 13 | GN-2012A-Q-070-11 | 23h02m47.90s | 08∘44′45.5′′ | 0.7377 | 3 | X | |
| 14 | GN-2012A-Q-070-11 | 23h02m45.49s | 08∘44′30.1′′ | 0.7209 | 3 | X | |
| 18 | GN-2012A-Q-070-11 | 23h02m45.16s | 08∘43′12.6′′ | 0.7113 | 3 | X | |
| 19 | GN-2012A-Q-070-11 | 23h02m47.95s | 08∘43′58.1′′ | 0.7283 | 3 | X | |
| 20 | GN-2012A-Q-070-11 | 23h02m46.70s | 08∘44′00.6′′ | 0.7253 | 3 | X | |
| 21 | GN-2012A-Q-070-11 | 23h02m48.54s | 08∘43′60.0′′ | 0.7253 | 3 | X | |
| 32 | GN-2012A-Q-070-11 | 23h02m55.72s | 08∘45′01.7′′ | 0.4828 | 3 | X | |
| 33 | GN-2012A-Q-070-11 | 23h03m00.05s | 08∘43′00.9′′ | 0.8772 | 2 | X |
Appendix C Velocity Histograms
Velocity histograms of all the clusters in the sample to appear in the online version of the article.