methods: data analysis — stars: activity — binaries: general – stars: black holes — stars: jets
Swift/BAT and MAXI/GSC Broadband Transient Monitor
Abstract
We present the newly developed broadband transient monitor using the Swift Burst Alert Telescope (BAT) and the MAXI Gas Slit Camera (GSC) data. Our broadband transient monitor monitors high energy transient sources from 2 keV to 200 keV in seven energy bands by combining the BAT (15-200 keV) and the GSC (2-20 keV) data. Currently, the daily and the 90-minute (one orbit) averaged light curves are available for 106 high energy transient sources. Our broadband transient monitor is available to the public through our web server, http://yoshidalab.mydns.jp/bat_gsc_trans_mon/, for a wider use by the community. We discuss the daily sensitivity of our monitor and possible future improvements to our pipeline.
1 Introduction
High energy astrophysical sources show a temporal variability in a broad spectral range. The X-ray (1-10 keV) and hard X-ray ranges (10-100 keV) are especially important observing windows to understand the temporal characteristics of high energy sources which involve spectral changes. For instance, a black hole candidate shows state changes in its flux and spectrum; in the quiescent state the X-ray emission is dominated by the hard emission, whereas in outburst the soft emission from the accretion disk becomes dominate. Some low mass X-ray binaries produces bright bursts in X-rays, so called X-ray bursts, which are caused by thermonuclear flashes of accreting material on the surface of the neutron star. An accreting X-ray binary pulsar sometimes shows intense outbursts in X-rays when the neutron star passes the disk or dense stellar wind of its companion. Cyclotron resonance lines, one of the direct observational approaches to measure the magnetic field of a neutron star, are most easily observable in the hard X-ray range from binary pulsar during outburst. An isolated neutron star with a high magnetic field, a so called magnetar, occasionally shows an outburst with multiple short duration bursts in hard X-rays believed originate from a large release of its internal magnetic energy. The time-domain astronomy which has been revolutionized by Swift (Gehrels et al., 2004) has become a frontier field of astronomy.
The Burst Alert Telescope (BAT; Barthelmy et al. (2005)) onboard Swift has been monitoring the hard X-ray sky (14-200 keV) thanks to its wide field of view since 2004. On the other hand, the Gas Slit Camera (GSC; Mihara et al. (2011)) on the MAXI mission (Matsuoka et al., 2009) has been observing the sky in softer energy band (2-30 keV) since 2009. Both instrument teams are providing the light curve data in real-time to the public (Krimm et al., 2013; Sugizaki et al., 2011). However, the Swift/BAT transient monitor111http://swift.gsfc.nasa.gov/results/transients/ (Krimm et al., 2013) is limited to a single energy band of 15-50 keV because the pipeline is using the data extracted in a single 15-50 keV band on-board (the data product called the BAT scaled-map data). Furthermore, there is no realtime transient monitor producing light curves in the full dynamic range of the BAT and the GSC data with the same time axis. By combining the data of the BAT and the GSC, we are able to construct broadband light curves of high energy transient sources with a high scientific merit. For example, the spectral state changes of several black hole candidates are investigated intensively using the BAT and the GSC data (XTE J1752223, e.g., Nakahira et al. (2010); Swift J1753.50127, e.g., Yoshikawa et al. (2015); Swift J1910.20546, e.g., Nakahira et al. (2014); GX 3394, e.g., Shidatsu et al. (2011b)). The state transition of bright low-mass X-ray binaries have also been studied in detail using both BAT and GSC data (e.g., Asai et al. (2015). ). Using both the MAXI and the INTEGRAL data, there is the web page for monitoring X-ray and hard X-ray activities of high-mass X-ray binaries.222http://integral.esac.esa.int/bexrbmonitor/webpage_oneplot.php Therefore there is a great demand to gather broad band light curves of high-energy transient sources from multiple missions and present them in a consistent format along a single time axis.
In this paper, we introduce the broadband transient monitor utilizing the BAT and GSC data. This transient monitor covers the dynamic range from 2 keV to 200 keV, which is ideal to monitor high energy transients in a broad spectral coverage.
The paper is organized as follows. We present the analysis method in §2. In §3, our broadband transient monitor is introduced. We further discuss our broadband transient monitor in §4.
2 Analysis
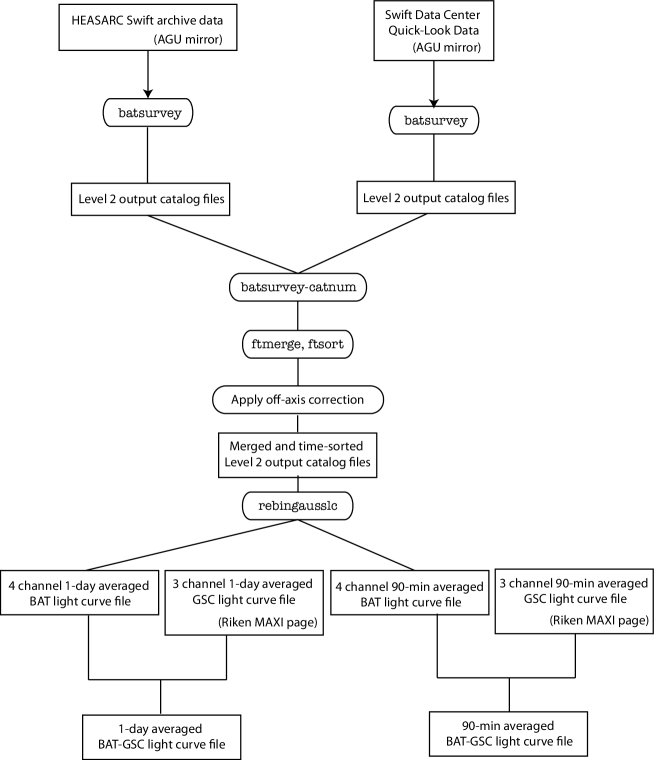
The flowchart of our pipeline is shown in Figure 1. As the initial step to construct the broadband transient monitor, independent pipelines were developed just to mirror the Swift BAT data to our server. This step is rather crucial for the entire process because it takes a significant amount of time to download the BAT data from the Swift data archive center in the U.S. (Swift Data Center (SDC) 333http://swift.gsfc.nasa.gov/cgi-bin/sdc/ql? and HEASARC444http://heasarc.gsfc.nasa.gov/FTP/swift/data/obs/) to Japan. Since the Swift data are initially stored at the SDC, and then, archived to the HEASARC seven days after the observation, two separate pipelines were developed to mirror both SDC and HEASARC data, which are available to the public from our web server (the SDC data mirror555http://yoshidalab.mydns.jp/swift_sdc_ql/ and the HEASARC data mirror666http://yoshidalab.mydns.jp/swift_bat_heasarc/) located in Japan. Note that only the Swift/BAT related data are mirrored from the HEASARC to our server. The script to mirror the SDC data is running once an hour, whereas the script to mirror the HEASARC archive runs once a day.
The basic BAT data analysis is performed using the HEASOFT software package. The batsurvey script is used to process the BAT survey (Detector Plane Histogram (DPH)) data. The default eight energy bands (14-20 keV, 20-24 keV, 24-35 keV, 35-50 keV, 50-75 keV, 75-100 keV, 100-150 keV and 150-195 keV) and the original time resolution of the DPH data (timesep = ”DPH”) were specified in the script. The typical exposure time of the original DPH data is five minutes. Products are made for 146 sources which were flagged as bright hard X-ray sources in the BAT 70 month all-sky hard X-ray survey (Baumgartner et al., 2013). The data after August 2009, when MAXI and Swift operations overlap, were processed. The batsurvey script produces so-called ‘level 2’ catalogs for each source, which contain the extracted count-rate and the incident angle of the source. Once the batsurvey process is completed, all the level 2 catalogs (final outputs of the batsurvey script) are merged using batsurvey-catnum script and time sorted by ftsort for all 146 sources.
The BAT count rates extracted by the batsurvey script must be corrected for the energy dependent vignetting of incoming photons (Tueller et al., 2010). To model this off-axis effect in the count rate at each energy band, we processed the survey data between 2004 and 2005, when the Crab nebula was in the field of view at various incident angles. Figure 2 illustrates the significant energy dependent systematic effect between the Crab count rate and incident angle in the 15-20 keV and the 100-150 keV band, as an example. A quadratic function was used to fit the trend between the count rate and the incident angle for all eight energy bands (Table Swift/BAT and MAXI/GSC Broadband Transient Monitor). In each band, the count rate is corrected by the rate of the on-axis Crab rate to the estimated Crab rate at the given incident angle. Next, the original eight energy bands are binned to four energy bands (14-24 keV, 24-50 keV, 50-100 keV and 100-195 keV). And then, a one day averaged and a 90-minutes (1 orbit) averaged light curves are generated using rebingausslc.
The MAXI GSC one day and 90 minutes light curves are downloaded from the MAXI public web page777www.maxi.riken.jp for the common sources of the BAT 146 bright sources in the input catalog of the BAT data process and the 369 (as of July 2015) sources listed in the MAXI public web page. The number of common sources in the current monitor is 106. This limitation mainly comes from the number of sources in the BAT input catalog. However, since all the created BAT sky images are stored in our computer, only the source extraction tool, batcelldetect, is needed to run through all the archival images to add a new source from the BAT data. We have a plan to add the sources which were detected in outburst in the BAT transient monitor (Krimm et al., 2013) in the past six years to our transient monitor pipeline.
The light curves of the BAT and the GSC are combined and plots are generated using the python matplotlib module.888http://matplotlib.org The BAT light curve data are available in FITS format. The interactive light curve based on the python mpld3 module999http://mpld3.github.io is also available, so that a user can move and zoom-in the light curve interactively.
3 BAT and GSC Broadband Transient Monitor
Our broadband transient monitor is available to the public from the web server at Aoyama Gakuin University: http://yoshidalab.mydns.jp/bat_gsc_trans_mon/. Currently, the broadband light curves of 106 known sources are accessible from the web page. The web page updates 3 times a day depending on the amount of the data which need to be processed. The products of our BAT-GSC broadband transient monitor are summarized in Table Swift/BAT and MAXI/GSC Broadband Transient Monitor.
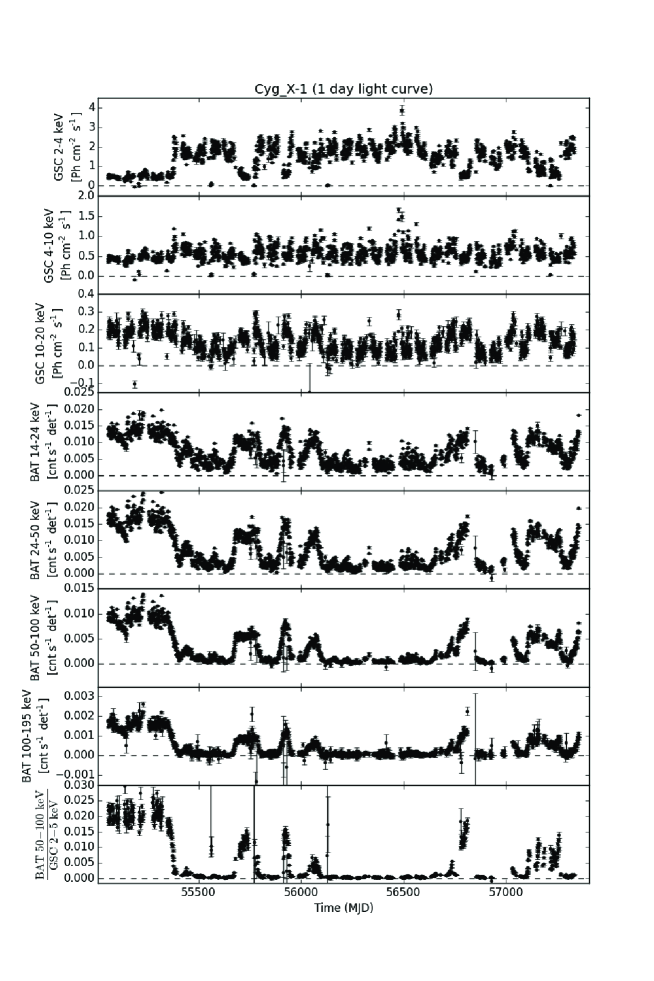
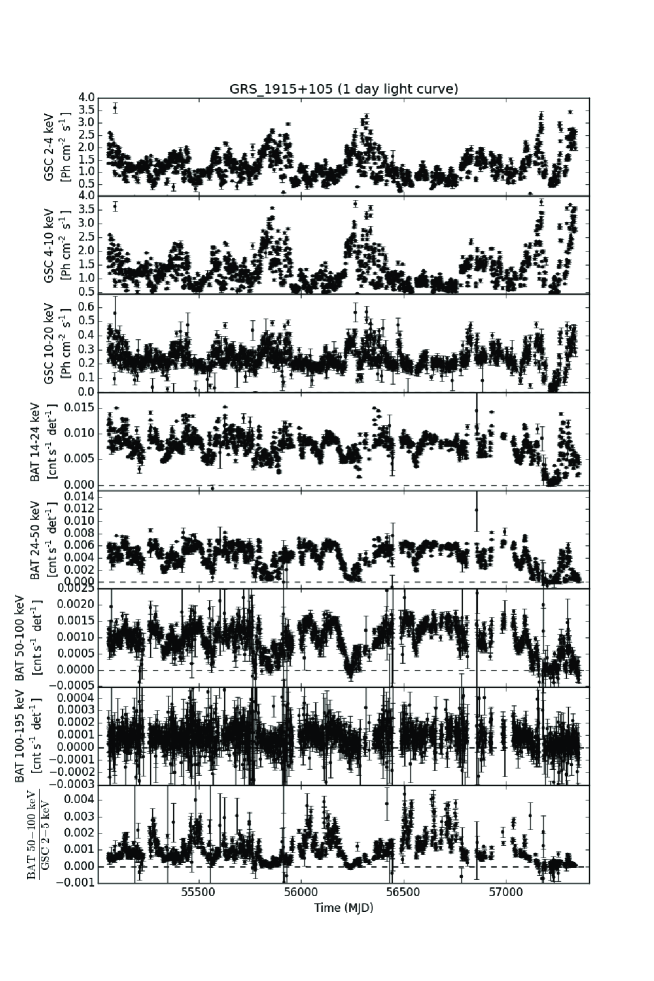
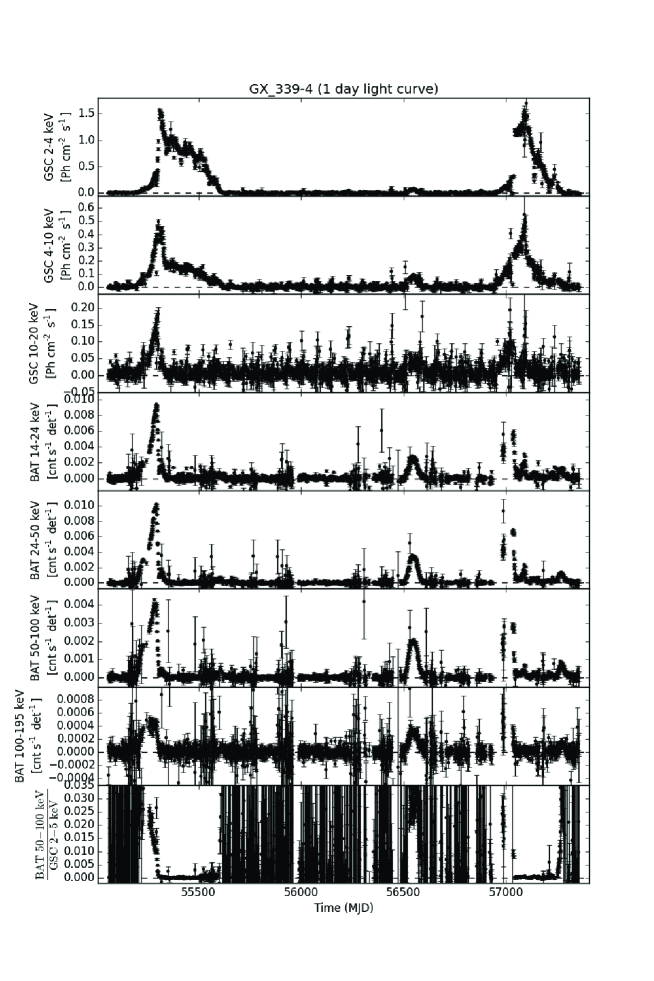
Here, we highlight the products of several sources in our broadband transient monitor. Figure 3 and 4 show our broadband light curves of the black hole binaries Cygnus X-1 and GRS 1915+105. Those light curves clearly show multiple spectral state transitions between “low-hard” and “high-soft” states, which are believed to indicate a change in the geometry of the accretion disk (e.g., Esin et al. (1997)). For example, the last clear state change was happening around MJD 57125 for Cygnus X-1 and around MDJ 56252 for GRS 1915+105. As can be seen in the light curves, the borderline energy which the emission becomes brighter or dimmer when the source is in the high-soft state is around 10 keV for Cygnus X-1 and 15 keV for GRB 1915+105. Figure 5 shows the long-term temporal behavior of GX 339-4, a Galactic transit black hole with a low-mass companion. During the giant outburst in the year 2010 (e.g., MJD 55200-55600), the burst emission showed a strong hard-to-soft evolution. The initial hard emission was visible up to the highest energy band of 100-195 keV. This hard X-ray emission episode is dominated by Comptonized photons from the accretion disk (e.g., Shidatsu et al. (2011a)).
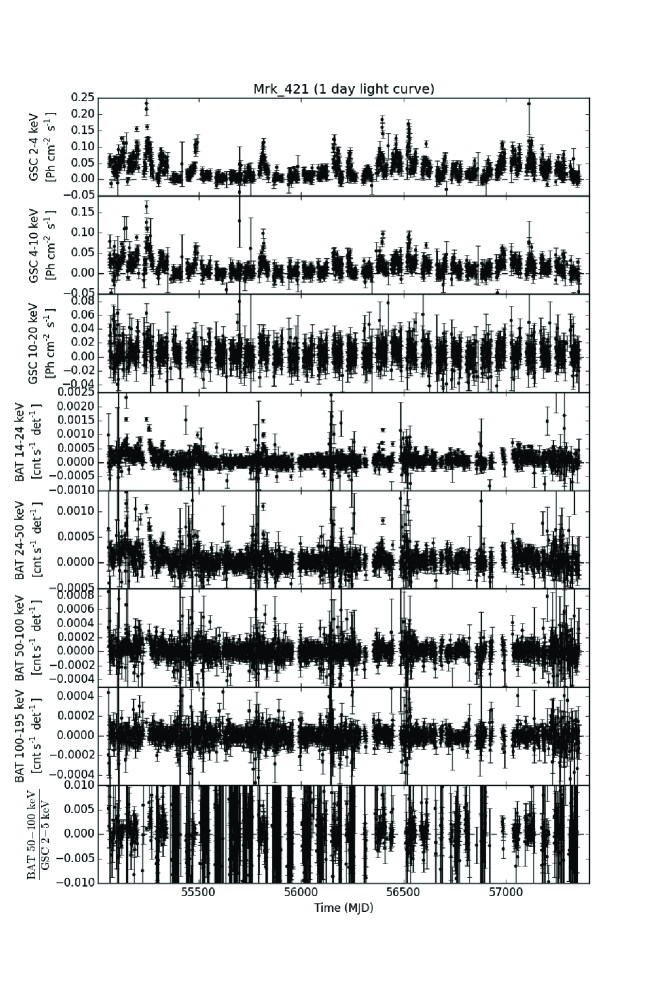
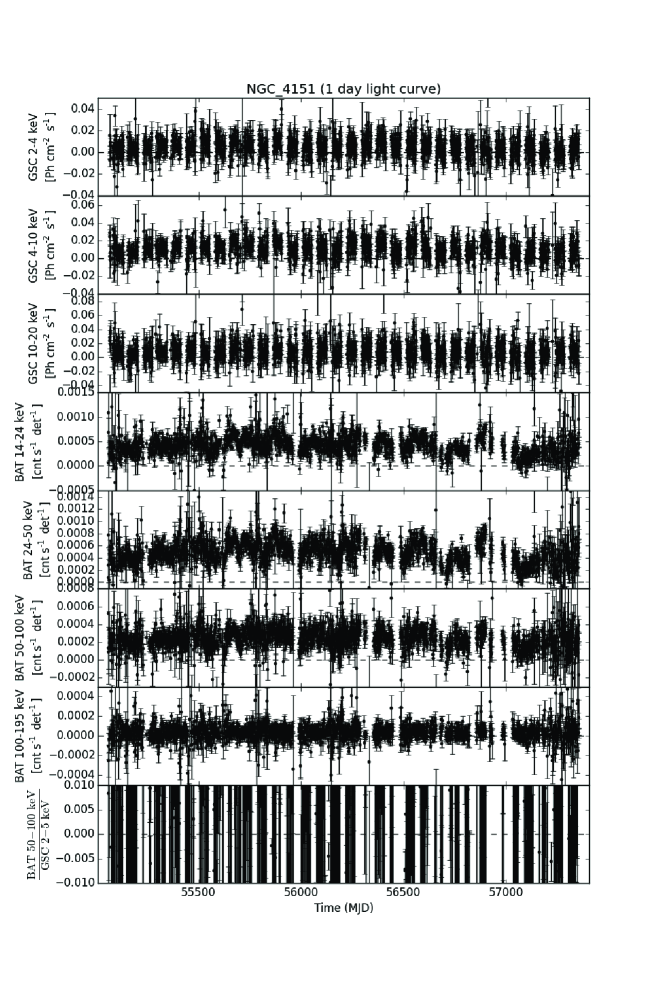
The -ray blazar, Mrk 421, showed several flares visible up to 100 keV (Figure 6). Since the BAT energy range is located at the dip between the two broad peaks in the spectral energy distribution of Mrk 421 (e.g., Abdo et al. (2011)), the BAT hard X-ray emission is not that evident compared to the soft X-ray band of the GSC. However, during the outburst, the hard X-ray emission is clearly visible in the BAT data, and the broad-spectral properties of the source can be investigated using our monitor. Figure 7 shows the light curve of the Seyfert 1.5 galaxy NGC 4151 which has a hard continuum in its spectrum (Keck et al., 2015). Unlike previous examples, its emission and the temporal variability are clearly visible in the BAT data rather than the GSC data.
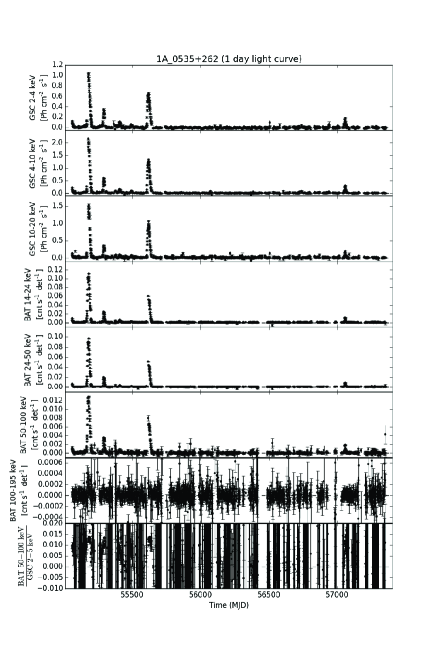
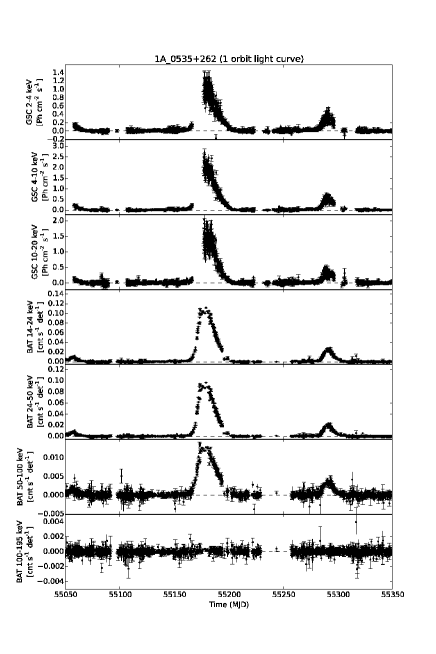
In Figure 8, the several giant outburst episodes are visible in the broadband light curve of a high-mass X-ray pulsar A0535+262. Since the emission during the giant outbursts were so intense, the temporal profile up to 100 keV is clearly visible even in the one orbit light curve (right panel of Figure 8). A recent study showed that the energy of the cyclotron resonance line of A0535+262, which was found typically around 45 keV, increased when the flux was high (Sartore et al., 2015). Thus, it is important to monitor those cyclotron sources in a broad energy band to understand the transient spectral features in various flux levels. As can be seen in those examples, our transient monitor includes various types of sources and can monitor interesting temporal and spectral stages of high energy sources.
4 Future Prospects
We constructed the broadband transient monitor using the Swift BAT and the MAXI GSC data and made it available to the public. This work is the first attempt to analyse the BAT survey data in real-time for constructing multi-band light curves. Although the updating frequency of the light curve is still not ideal, we can now run the pipeline several times a day in real-time.
Although it varies based on the Swift pointing, a typical exposure time of an individual object for the BAT is roughly four hours per day (about eight hours at the highest day). Applying the BAT survey sensitivity equation described in Baumgartner et al. (2013), this typical exposure corresponds to a 5-sigma sensitivity of 10 mCrab (14-195 keV). On the other hand, the daily averaged 5-sigma sensitivity of the GSC is 15 mCrab in the 4-10 keV band (Sugizaki et al., 2011). Therefore, the daily sensitivity of the BAT and the GSC are comparable. Therefore, it is a good match to combine the BAT and the GSC data to monitor high energy transient sources on a daily basis.
All the MAXI GSC light curve data in the current broadband transient monitor is downloaded from the MAXI’s public web page. Since all of the light curves are created using an aperture photometry method (Sugizaki et al., 2011), the count rates in the light curves could be contaminated with bright X-ray sources located near the object. Due to a relatively poor position resolution of the GSC, if other bright X-ray source is located within 2 degrees from the object, there might be an issue in the light curve. For those sources which could be affected by nearby contaminations, we have a future plan to generate the GSC light curves of the source using the point spread function (PSF) fit method which should provide a contamination free light curve (Hiroi et al., 2011; Morii et al., 2015) using the GSC data. At the current stage, the sources which are located within 2 degrees from catalog sources in the ROSAT bright source catalog (Voges et al., 1999) with the count rate greater than 1 count s-1 are flagged as possible contaminated sources at the top page of the monitor (see Table Swift/BAT and MAXI/GSC Broadband Transient Monitor).
The processing time of the current pipeline is limited by the analysis of the BAT survey data. Our pipeline is processing the BAT survey data at the finest time resolution with the eight energy bands. Although we can process the data in the coarser time resolution and the smaller energy bands to speed up the process, the best spectral and temporal information can be extracted in the current setup for the BAT data. For example, the outputs of our pipeline can provide 8 channel spectral data of the sources every five minutes when high energy sources are in the very bright state. We have a plan to process the data with multiple available computers or Graphical Processing Unit (GPU) to speed up the process.
The current broadband transient monitor contains 106 sources. However, it is not a difficult task to add sources to the monitor. We are planning to add sources based on not only the information from various observatories (e.g., the Astronomer’s Telegram101010http://www.astronomerstelegram.org, the Gamma-ray Coordinates Network111111http://gcn.gsfc.nasa.gov/gcn_main.html) but also requests from the community.
We would like to thank the anonymous referee for comments and suggestions that materially improved the paper. This work was supported by JSPS Grant-in-Aid for Scientific Research (C) Grant Number 25400234.
References
- Abdo et al. (2011) Abdo, A. A. et al. 2011, ApJ, 736, 131
- Asai et al. (2015) Asai, K. et al. 2015, PASJ, in press
- Barthelmy et al. (2005) Barthelmy, S. D., et al. 2005, Space Science Reviews, 120, 3
- Baumgartner et al. (2013) Baumgartner, W. H., Tueller, J., Markwardt, C. B., Skinner, G. K., Barthelmy, S., Mushotzky, R. F., Evans, P. A., Gehrels, N. 2013, ApJS, 207, 19
- Esin et al. (1997) Esin, A. A., McClintock, J. E., Narayan, R. 1997, ApJ, 489, 865
- Gehrels et al. (2004) Gehrels, N. et al. 2004, ApJ, 611, 2
- Hiroi et al. (2011) Hiroi, K. et al. 2011, PASJ, 63, 677-689
- Krimm et al. (2013) Krimm, H. A. et al. 2013, ApJS, 209, 14
- Keck et al. (2015) Keck, M.L. et al. 2015, ApJ, 806, 149
- Matsuoka et al. (2009) Matsuoka, M. et al. 2009, PASJ, 61, 999
- Mihara et al. (2011) Mihara, T. et al. 2011, PASJ, 63, 623
- Morii et al. (2015) Morii, M. et al. 2015 in prep.
- Nakahira et al. (2010) Nakahira, S. et al. 2010, PASJ, 62, 27
- Nakahira et al. (2014) Nakahira, S. et al. 2014, PASJ, 64, 84
- Sartore et al. (2015) Sartore, N., Jourdain, E., Roques, J. P. 2015, ApJ, 806, 193
- Shidatsu et al. (2011a) Shidatsu, M. et al. 2011, PASJ, 63, 785
- Shidatsu et al. (2011b) Shidatsu, M. et al. 2011, PASJ, 63, 803
- Sugizaki et al. (2011) Sugizaki, M. et al. 2011, PASJ, 63S, S644
- Tueller et al. (2010) Tueller, J. et al. 2010, ApJS, 186, 378
- Voges et al. (1999) Voges, W. et al. 1999, A&A, 349, 389
- Yoshikawa et al. (2015) Yoshikawa, A. 2015, PASJ, 67, 11
*4c
Ths source list of the broadband transient monitor
\endfirstheadThs source list of the broadband transient monotor
\endheadName R.A. Dec. Possible contaminated source
V709 Cas 7.2036 59.2894
Mrk 348 12.1964 31.9570
Gamma Cas 14.1772 60.7167
SMC X-1 19.2714 -73.4433 T
2S 0114+650 19.5112 65.2916
4U 0115+634 19.6330 63.7400
CC Eri 38.5940 -43.7960
GK Per 52.7993 43.9047
BQ Cam 53.7495 53.1732
X Per 58.8462 31.0458
LSV+44 17 70.2470 44.5300
LMC X-4 83.2075 -66.3705 T
Crab Nebula Pulsar 83.6332 22.0145
1A 0535+262 84.7274 26.3158
LMC X-3 84.7342 -64.0823 T
NGC 2110 88.0474 -7.4562
4U 0614+091 94.2804 9.1369
MXB 0656-072 104.5703 -7.2105
EXO 0748-676 117.1388 -67.7500
Vela Pulsar 128.8361 -45.1764
GS 0834-430 128.9790 -43.1850
Vela X-1 135.5286 -40.5547
MCG -05-23-016 146.9173 -30.9489
GRO J1008-57 152.4417 -58.2917
NGC 3227 155.8774 19.8651 T
Mrk 421 166.1138 38.2088
NGC 3516 166.6979 72.5686
XTE J1118+480 169.5450 48.0370
Cen X-3 170.3158 -60.6230 T
NGC 3783 174.7572 -37.7386
1E 1145.1-6141 176.8692 -61.9539
NGC 4151 182.6357 39.4057
GX 301-2 186.6567 -62.7706
3C 273 187.2779 2.0524
GX 304-1 195.3217 -61.6019
Cen A 201.3651 -43.0191
4U 1323-619 201.6504 -62.1361
IC 4329A 207.3303 -30.3094
NGC 5506 213.3119 -3.2075
PSR B1509-58 228.4813 -59.1358
Cir X-1 230.1703 -57.1667
H 1538-522 235.5971 -52.3861
1E 1547.0-5408 237.7255 -54.3066
H 1553-542 239.4512 -54.4150
4U 1608-522 243.1792 -52.4231 T
Sco X-1 244.9795 -15.6402
SWIFT J1626.6-5156 246.6510 -51.9428 T
4U 1624-490 247.0118 -49.1985
4U 1626-67 248.070 -67.4619
4U 1636-536 250.2313 -53.7514
GX 340+0 251.4488 -45.6111
GRO J1655-40 253.5006 -39.8458 T
Her X-1 254.4576 35.3424 T
OAO 1657-415 255.1996 -41.6731 T
XTE J1701-407 255.4349 -40.8583 T
GX 339-4 255.7063 -48.7897
GX 349+2 256.4354 -36.4231 T
4U 1705-440 257.2270 -44.1020 T
4U 1722-30 261.8883 -30.8019 T
GX 9+9 262.9342 -16.9617
4U 1728-34 262.9892 -33.8347
GX 1+4 263.0090 -24.7456 T
MXB 1730-335 263.3504 -33.3877
SLX 1735-269 264.5667 -27.0044 T
4U 1735-44 264.7429 -44.4500
SGR A Gal center complex 266.4168 -29.0078
2E 1742.9-2929 266.5229 -29.5153
XTE J17464-3213 266.5650 -32.2335 T
GX 3+1 266.9833 -26.5636
SWIFT J1753.5-0127 268.3679 -1.4525
GX 5-1 270.2842 -25.0792 T
GX 9+1 270.3846 -20.5289
SAX J1808.4-3658 272.1150 -36.9790
XTE J1810-189 272.6079 -19.0700
SAX J1810.8-2609 272.6850 -26.1500
GX 13+1 273.6315 -17.1574
GX 17+2 274.0058 -14.0364 T
4U 1820-30 275.9186 -30.3611
4U 1822-371 276.4450 -37.1053
Ginga 1826-24 277.3675 -23.7969
XB 1832-330 278.9338 -32.9914
Ser X-1 279.9896 5.0358
Ginga 1843+00 281.4125 0.8917
4U 1850-086 283.2703 -8.7057
V1223 Sgr 283.7593 -31.1635
XTE J1855-026 283.8804 -2.6067
XTE J1856+053 284.1786 5.3094
HETE J1900.1-2455 285.0360 -24.9205
SWIFT J1910.2-0546 287.5950 -5.7990
Aql X-1 287.8167 0.5850
SS 433 287.9565 4.9827
GRS 1915+105 288.7983 10.9456
4U 1916-053 289.6995 -5.2381
SWIFT J1922.7-1716 290.6542 -17.2842
4U 1954+31 298.9264 32.0970
Cyg X-1 299.5903 35.2016
Cygnus A 299.8682 40.7339
V404 Cyg 306.0159 33.8672
EXO 2030+375 308.0633 37.6375
Cyg X-3 308.1074 40.9578
SAX J2103.5+4545 315.8990 45.751
Ginga 2138+56 324.8780 56.9861
Cyg X-2 326.1717 38.3217
NGC 7172 330.5080 -31.8698 T
4U 2206+54 331.9843 54.5185
II Peg 358.7669 28.6337
Best fit equations between the BAT Crab count rate and the incident angle . Energy band Best fit quadratic equation 14-20 keV Rate 20-24 keV Rate 24-35 keV Rate 35-50 keV Rate 50-75 keV Rate 75-100 keV Rate 100-150 keV Rate 150-195 keV Rate
Products of the broad-band transient monitor
Plots of daily seven channel light curves and the hardness ratio between the BAT 50-100 keV and the GSC 2-5 keV band
Plots of zoom-in daily light curves over the last ten days and the hardness ratio between the BAT 50-100 keV and the GSC 2-5 keV band
Interactive plots of daily seven channel light curves and the hardness ratio between the BAT 50-100 keV and the GSC 2-5 keV band
Plots of 90 minutes seven channel light curves
Plots of zoom-in 90 minutes seven channel light curves over the last 10 days
FITS light curve files of BAT four channel daily light curves
FITS light curve files of BAT four channel 90 minutes light curves