Stable and unstable accretion in the classical T Tauri stars IM Lup and RU Lup as observed by MOST
Abstract
Results of the time variability monitoring of the two classical T Tauri stars, RU Lup and IM Lup, are presented. Three photometric data sets were utilised: (1) simultaneous (same field) MOST satellite observations over four weeks in each of the years 2012 and 2013, (2) multicolour observations at the SAAO in April – May of 2013, (3) archival -filter ASAS data for nine seasons, 2001 – 2009. They were augmented by an analysis of high-resolution, public-domain VLT-UT2 UVES spectra from the years 2000 to 2012. From the MOST observations, we infer that irregular light variations of RU Lup are caused by stochastic variability of hot spots induced by unstable accretion. In contrast, the MOST light curves of IM Lup are fairly regular and modulated with a period of about 7.19 – 7.58 d, which is in accord with ASAS observations showing a well defined d periodicity. We propose that this is the rotational period of IM Lup and is due to the changing visibility of two antipodal hot spots created near the stellar magnetic poles during the stable process of accretion. Re-analysis of RU Lup high-resolution spectra with the Broadening Function approach reveals signs of a large polar cold spot, which is fairly stable over 13 years. As the star rotates, the spot-induced depression of intensity in the Broadening Function profiles changes cyclically with period 3.71058 d, which was previously found by the spectral cross-correlation method.
keywords:
star: individual: RU Lup IM Lup, stars: variables: T Tauri, Herbig Ae/Be, stars: rotation, stars: accretion: accretion discs.1 Introduction
Continuous, high-precision, photometric observations obtained with Microvariability and Oscillation of STars (MOST) and COnvection ROtation and planetary Transits (CoRoT) space telescopes significantly contributed to the knowledge of a variety of mechanisms causing stellar variability of T Tauri stars occurring on time scales of weeks and days. In particular, our first, long, nearly uninterrupted MOST light curves of the classical T Tauri-type star (CTTS) TW Hya (Rucinski et al., 2008; Siwak et al., 2011a) and the CoRoT light curves of several CTTSs - members of the young cluster NGC 2264 (Alencar et al., 2010), permitted the first observational tests of theoretical three-dimensional magneto-hydrodynamical (3D MHD) models of plasma accretion on a magnetised star from the inner accretion discs (Kurosawa & Romanova, 2013). The results of these numerical simulations are presented in detail in the series of papers by Romanova et al. (2004, 2008); Kulkarni & Romanova (2008); Romanova & Kulkarni (2009); Kulkarni & Romanova (2009).
According to the authors of these theoretical investigations, for magnetospheres a few times the stellar radius in size, the accretion from the surrounding disc can occur in a stable, a moderately stable or an unstable regime. The regime of accretion which dominates at a given time is determined by several factors: the magnetic field strength, the star’s rotation rate, the misalignment angle between the stellar rotational axis and the magnetic poles; however, the dominant factor is the mass accretion rate (Kulkarni & Romanova, 2008). For a low value of the accretion rate, stable accretion takes the form of steady plasma flows from the inner disc toward the stellar magnetic poles in two funnels encircling the magnetosphere (Romanova et al., 2004). The funnels produce two antipodal, banana-shaped hot spots which are almost stationary on the star. The resulting light curves of such a CTTS are modulated with the rotational frequency of the star only.
An increased mass-accretion rate may lead to substantial diversification of plasma density in the inner accretion disc and to an onset of Rayleigh-Taylor (RT) instabilities. The instabilities produce a few equatorial tongues, in which the plasma is first transferred directly from the disc toward the star, but ultimately it is wound along stellar magnetic field lines, which form miniature funnel flows. The plasma impacts the star at moderate latitudes (35-65 deg) and produces hot spots which are smaller than those produced by the stable accretion funnels (Romanova et al., 2008; Kulkarni & Romanova, 2008, 2009). The chaotic behaviour of the tongues and the resulting small hot spots lead to progressively more chaotic light curves as more spots are formed: While at the beginning of the RT instabilities the funnel component still produces a single peak at the stellar rotation frequency (though not as steady as for the purely stable case), as time progresses the frequency spectrum of the star brightness starts to show increasingly more additional peaks produced by the complex hot-spot distribution around the star. This stage is called a moderately stable accretion regime.
In the fully unstable regime, for mass accretion rates higher by more than an order of magnitude than in the stable regime, the hot spots are created by only a few unstable tongues rotating around the star with angular velocity of the inner disc. As the shape, intensity, number and position of the hot spots change on the inner-disc dynamical timescale, the resulting phenomena are highly chaotic and no stellar-rotation frequency is detectable in complex light curves or their Fourier or wavelet spectra.
The type of accretion may alternate between the different regimes depending on changes in the mass accretion rate (Romanova et al., 2008). This was likely observed in TW Hya, where the accretion regime was found to switch between a moderately stable and an unstable regime (Siwak et al., 2014). A similar effect was also found in the classical T Tau star 2MASS 06401258+1005404 observed twice by CoRoT; in 2008 the star showed a light-curve modulated with a stable spot, while in 2011 the light curve was irregular and dominated by accretion bursts (Stauffer et al., 2014). Prompted by the most recent results obtained for TW Hya (Siwak et al., 2014), both the probable discovery of the accretion-regime alternation and the discovery of short-term occultations, we used MOST in a continuation of our previous, already cited work, but within a broader context of investigation of young stars (Rucinski et al. 2010; Siwak et al. 2011b, 2013; Cody et al. 2013; Windemuth et al. 2013; Zwintz et al. 2013). For the present analysis, we have chosen two well-known southern stars RU Lup and IM Lup, the brightest among the six known CTTSs in the Lupus 2 Star Forming Region (Comerón, 2008). Both stars could be observed simultaneously in the same MOST field.
We describe previous results obtained for our targets in Section 2. The high-cadence data for RU Lup and IM Lup obtained with the MOST satellite during 4 weeks in 2012 and 2013 are described in Section 3. In the same section, we describe supplementary multicolour observations of these stars obtained in 2013 at the South African Astronomical Observatory (SAAO) and long-term, 2001–2009 All Sky Automated Survey (ASAS) data. The spectroscopic data obtained during 2000, 2002, 2005, 2008 and 2012 in the public-domain at the European Southern Observatory (ESO) using the La Silla 3.6 m and Cerro Paranal VLT-UT2 telescopes are described in Section 4. We summarise and discuss the results obtained in the context of recent theoretical investigations of accretion flow in magnetised stars in Section 5.
2 History and previous observations
2.1 RU Lup
The major peculiarity of the star with the spectrum dominated by strong and broad emission lines was first noticed by Merrill (1941) and Joy (1945). The emission lines of RU Lup belong the broadest among CTTSs: The H emission line equivalent width is always larger than 100 Å, with maximum value as large as 216 Å (Appenzeller et al., 1983). Gahm et al. (1974, 1979) concluded that the emission lines and the severe veiling of the absorption spectrum (first detected by Schwartz & Heuermann 1981) are likely produced by a hot and very bright source.
Large and irregular light variations of RU Lup have been observed over long time scales in Harvard photographic plate data obtained between 1893 and 1912 showing variability in the range of 9–11 mag (Joy, 1945). This was confirmed by numerous observations by amateur astronomers in the twentieth Century, who observed variability in the similar range of 8.6–12.8 mag (Lamzin et al., 1996). Although the first photoelectric observations of Hoffmeister (1958), as analysed by Plagemann (1969), indicated a quasi-periodic oscillation at a period of d, their subsequent analysis of Giovannelli et al. (1991) questioned the statistical significance of this detection. The authors were also unable to find any periodicity in the second data-set of RU Lup observations published by Hoffmeister (1965).
Irregular variability of this star was confirmed with more accurate broad-band observations in the whole optical – IR spectral range of photometric bands between and . As firmly stated by Gahm et al. (1974), Hutchinson et al. (1989) and Giovannelli et al. (1991), the greatest amplitude of light variations is observed in the -filter, its value slowly decreasing towards longer wavelengths, with the star being redder (or better said – less blue) when fainter. In accordance with findings from spectroscopy, the authors proposed that this could be due to rotation of the spotted stellar surface containing a hot source with an estimated temperature of K.
Once the model of magnetically-controlled accretion was formulated for CTTS (Königl, 1991) and successfully applied for interpretation of new multi-wavelength data of RU Lup by Giovannelli et al. (1995) and Errico et al. (1996), Lamzin et al. (1996) proposed that the observed variability and its spectral properties could be produced by a hot, ring-like accretion belt (6500 K) formed around the two magnetic poles on the star. The ring could occupy about 30% of the stellar surface. The hot-spot properties were later substantially modified by Stempels & Piskunov (2002): Based on the veiling factors 111The spectral veiling factor measures changes in depth of absorption lines due to some, frequently unexplained, emission component: , where and are the absorption-line equivalent widths of an unveiled reference spectrum and a veiled T Tauri star, respectively., which decrease monotonically from at 4091 Å to at 6210 Å, the authors proposed a hot spot with K, but with a smaller 3-6% surface filling factor.
Lamzin et al. (1996) found that the majority of the observed luminosity of the star is produced by accretion processes and only 10% by the star itself. This circumstance leads to difficulties in determination of RU Lup’s stellar parameters. The authors estimated the stellar parameters as follows: the effective temperature K (Sp M0.5), the luminosity L⊙ and the radius R⊙. From its position on the Hertzsprung-Russell diagram they estimated the mass to be smaller than a solar mass, the age at about 1 Myr and the mass accretion rate at M⊙ yr-1. Herczeg et al. (2005) proposed a slightly lower rate of M⊙ yr-1. Based on their estimate of the interstellar extinction of , distance 140 pc, and veiling factors given by Stempels & Piskunov (2002), they modified the stellar parameters to L⊙ and R⊙. The age remained similar as before (2–3 Myr), while the mass was lowered to 0.6-0.7 M⊙. Stempels & Piskunov (2002) re-determined some parameters using the spectral region 5905–5965 Å where the spectrum shows no obvious emission components associated with metallic lines, as follows: K, surface gravity , the mean radial velocity km/s, and spectral lines rotational broadening km/s, where is the inclination angle between the stellar rotational axis and the observer line of sight. They concluded that such a small value of the spectral line broadening, as well as the presence of emission lines containing blueshifted signatures of the collimated outflow, indicate that RU Lup is observed at a low inclination angle222This makes the star similar to TW Hya, which shows very strong accretion processes between the inner disc and the star and has been extensively observed by us using MOST..
Although no obvious periodic signal is present in any photometric data, Stempels et al. (2007) found a period of d using the cross-correlation function analysis of the radial velocity variations. The periodicity appeared to be stable over many years. Assuming that this is the rotational period of the star, and that the stellar radius is 1.64 R⊙, the mass 0.65 M⊙ and the observed km/s, they determined the inclination of RU Lup at 24 deg. In order to explain the observed amplitude in radial velocity changes (2.2 km/s), which is anti-correlated with the bi-sector of the absorption lines, the authors concluded that RU Lup must be covered by relatively large, cold spots. One possibility is a single spot with a radius of more than 30 deg, an average temperatures in the range 3000-3600 K and a magnetic field strength of 3kG. The authors did not find any short-term correlation between the measured radial velocities and the simultaneous, moderate-quality photometric ASAS data. In the following sections of the paper it becomes obvious that the expected signal variations from the large cold spot (0.15 mag, at most) is totally suppressed by irregular variations of much larger amplitude due to unstable accretion.


2.2 IM Lup (Sz 82)
In contrast to RU Lup, IM Lup shows a typical absorption-line spectrum free of any obvious peculiarities. In spite of the young age of 1 Myr, 1.8 Myr or 2.5 Myr, as respectively derived by Finkenzeller & Basri (1987), Batalha & Basri (1993) and Martin et al. (1994), lack of any optical veiling and rather weak emission lines prompted the previous investigators to classify IM Lup as a chromospherically active, weak-lined T Tauri-type Star (WTTS). The hydrogen emission is relatively weak, with occasionally as small as 5.2 Å (Batalha & Basri, 1993), 4.7 Å (Reipurth et al., 1996), 4 Å (Wichmann et al., 1999) or even 2.8–5.2 Å (Günther et al., 2010). These values are significantly smaller than the traditional limit of 10 Å defining the borderline between CTTS and WTTS. Yet, there is strong evidence that the above classification is incorrect and the star belongs to the class of classical T Tauri stars. Batalha & Basri (1993) observed the hydrogen line emission of IM Lup at a much higher level with staying for two years at an average level of 17 Å and varying within the range of 7.5–21.5 Å. Considerable asymmetry of the profiles in IM Lup (Reipurth et al., 1996; Günther et al., 2010; Valenti et al., 2003) supports the view of an ongoing accretion and thus its CTTS membership. As stated by Günther et al. (2010), WTTS are generally expected not to show accretion, but for many CTTS the is variable, suggesting a low or variable mass-accretion rate. The authors estimate the mass accretion rate in IM Lup at only M⊙ yr-1.
Other evidence of the CTTS membership of IM Lup came with the discovery of a large (400–700 AU), gas-rich accretion disc (van Kempen et al., 2007). Based on Hubble Space Telescope high-contrast images, Pinte et al. (2008) determined its inclination at deg. They confirmed that the disc is large, 400 AU across, for the Hipparcos’s spacecraft derived distance pc (as given by Wichmann et al. 1998) and massive, 0.1 M⊙. From spectral energy distribution modelling, they estimated the value of the inner disc radius at 0.15 AU. Recent sub-mm observations of Panić et al. (2009) show that the disc is in Keplerian rotation around a central mass of M⊙. The authors discovered a break in the surface density of the disc, which initiated space- and ground-based searches for a Jupiter-like planet around the star (Mawet et al., 2012).
The first set of stellar parameters of IM Lup, as derived by Batalha & Basri (1993), was recently refined by Pinte et al. (2008). With the assumption of a distance of pc (Wichmann et al., 1998) they obtained K (Sp. M0V), , R⊙, L⊙, mag and age of 1 Myr. From the high-resolution HARPS spectra Günther et al. (2010) obtained km/s. Using R⊙ and deg of Pinte et al. (2008) or deg of Panić et al. (2009), and assuming that the accretion disc is coplanar with the stellar equator, one can estimate possible values of the rotational period at and d, respectively. Interestingly Batalha et al. (1998) found the signature of a 7.42 d period in archival photometric data, although the significance of this periodicity was very low and the authors concluded that IM Lup is an irregularly variable star.
3 Photometric observations
3.1 MOST observations
The MOST satellite has been described several times in our previous papers of this series, as listed in Section 1. The pre-launch characteristics of the mission are described by Walker et al. (2003) and the initial post-launch performance by Matthews et al. (2004). The satellite observes in one broad-band filter covering the spectral range of 350 – 700 nm with effective wavelength similar to that of the Johnson -filter.
The MOST observations of RU Lup and IM Lup were done simultaneously, with both stars in the same field of the satellite. The first series of observations, conducted in direct-imaging data-acquisition mode, took place over 28.216 days between 13 April and 12 May, 2012, during 368 satellite orbits. Encouraged by the first results, we re-observed the stars during the next observing season between 13 April and 8 May, 2013, over 25.932 days during 334 satellite orbits. The stars are not in the Continuous Visibility Zone of the satellite so that their observations were interrupted for 40-70 min during each satellite orbit by observations of secondary targets, and occasionally for d by time-critical observations of other targets. As a result, the effective total time coverage for our targets during the 2012 and 2013 runs was 12.043 days (42.7%) and 8.331 days (32.1%), respectively.
The individual exposures were always 60 s long. For photometric reductions, the dark and flat calibration frames were obtained by averaging a dozen empty-field images specifically taken during each run. Aperture photometry was carried out on the dark- and flat- corrected images by means of the DAOPHOT II package (Stetson, 1987). As in our previous investigations, weak correlations between the stellar flux, its position on the chip, and the sky background level within each MOST orbit were removed. We obtained a well-defined light curves expressed in Heliocentric Julian Days and normalized flux units (Figure 1, the left side panels) for almost the whole duration of the observations, with typical error (i.e. the standard deviation) of a single data point of 0.010–0.011 mag (RU Lup) and 0.016–0.017 mag (IM Lup) in the 2012 and 2013 runs, respectively. In addition to the targets, the nearby bright GCS 07838-00926 companion, separated by 20 arcsec from IM Lup was also analysed in the same way. The star remained constant during 2012 and 2013.
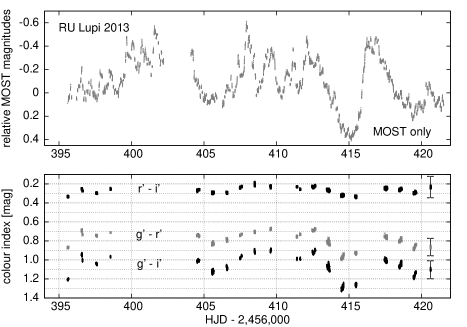
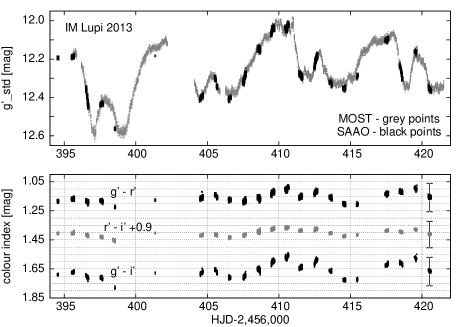
The light variations of RU Lup in the MOST data appear to be irregular with no sign of any periodic features, either in the 2012 or in the 2013 light curves. This behaviour is typical for Type II, irregular and accretion-burst classes, as defined by Herbst et al. (1994), Alencar et al. (2010) and Stauffer et al. (2014), respectively. In contrast, the light curves of IM Lup show a fairly stable 7–8 d periodicity, which is typical for Type IIp or spot-like CTTSs, as defined in Herbst et al. (1994) and Alencar et al. (2010) classification schemes. Only a part of the 2012 light curve of IM Lup is disturbed by small-scale, irregular variations, which disappeared after . Interestingly, while the 2012 light curve shows regularly repeating maxima, the 2013 one shows a sequence of alternating higher and smaller brightness increases whose shape evolves slightly during each double-period sequence. We note that the second light curve is very similar to the synthetic curve obtained for the case of a stable accretion regime by Kurosawa & Romanova (2013) (see in Fig. 5 of their paper). In addition, we also carefully examined the light curves of RU Lup and IM Lup for the presence of short brightness dips like those observed for TW Hya (Siwak et al., 2014), with negative result.
3.1.1 Frequency analysis of the MOST data
We performed frequency analysis of the light curves in a similar way as in our previous papers of this series (see Section 4.2 in Rucinski et al. 2008). The bootstrap sampling technique permitted evaluation of the mean standard errors of the amplitude , where is the frequency (Fig. 1, the right panels).
We used all data points gathered by MOST in the Fourier spectrum calculations for RU Lup. For IM Lup, we removed the first 8 days of the 2012 data due to highly irregular light variations which appear to spoil the primary signal in the Fourier spectrum. Also the long-term ascending trend visible in the 2013 IM Lup light curve was removed by a simple parabolic fit, as it had measurable impact on the amplitude and the period obtained from the frequency spectrum.
The 2012 and 2013 Fourier spectra of RU Lup show dominant flicker-noise characteristics, i.e. the amplitudes scale as , exactly as for TW Hya (Rucinski et al., 2008; Siwak et al., 2011a, 2014), with no single periodicity dominating in the frequency spectra. However, the corresponding spectra of IM Lup clearly show a single, very persistent signal at about 7.5 d and with amplitudes similar in both years (Figure 1, right panels). Measurements of the central positions of the peaks result in c/d ( d) and c/d ( d) for the 2012 and 2013 signals, respectively. These values are in good agreement with the rotation period of the star estimated from analysis of the spectroscopic, high-contrast imaging and interferometric observations (see the last paragraph of Section 2.2).
3.1.2 Wavelet analysis of the MOST data
As demonstrated during TW Hya light-curve analyses by Rucinski et al. (2008) and Siwak et al. (2011a), wavelets are a very useful tool for finding short-lasting regularities in apparently irregular light curves of CTTS. While Fourier spectra of TW Hya’s 2008 and 2009 data taken over whole observing runs showed only flicker-noise characteristics, the wavelets revealed the presence of short oscillatory behaviour with quasi-periods which tended to progressively decrease with time. Thus, wavelets permitted a simple and direct method to follow up the time period progression versus time.
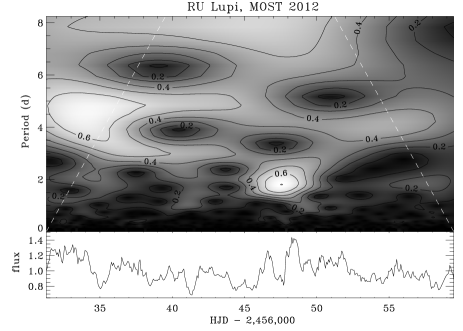
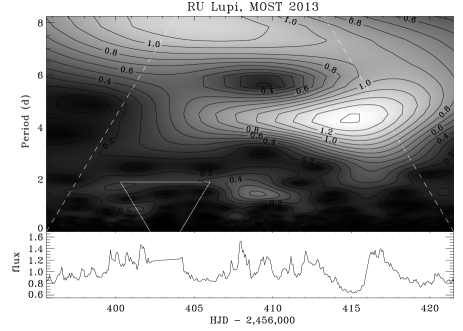
To obtain a uniform data sampling required for the wavelet analysis of RU Lup and to remove a few interruptions in the data acquisition (see Sec. 3.1), we interpolated the 368 (2012) and 334 (2013) satellite-orbit, average data points into a grid of 401 and 369 equally-spaced points at 0.07047 d intervals, for the two seasonal MOST runs, respectively. As in our previous investigations, the Morlet-6 wavelet provided the best match between the time-integrated power spectrum from the wavelet transform and the directly-obtained frequency spectrum of the star, as given in the previous section (Sec. 3.1.1).
The wavelet spectrum of 2012 light curve of RU Lup (Fig. 2, the upper-left panel) shows at least two drifting quasi-periodic features, which are very similar to those found in TW Hya during the phases of unstable accretion (Rucinski et al., 2008; Siwak et al., 2011a). The most pronounced is the feature which shortened its period from to d – the feature can be also visually distinguished and tracked in the light curve from the beginning of the observations until . The second feature is visible through the entire run and appears to shorten its period from to d by the end of the run. We also note a few short-living d features, which appear and disappear on a time-scale of a few days.
Interestingly, the 2013 wavelet spectrum of RU Lup does not show any clear period drifts for the quasi-periodic features. It is dominated by rather stable d features with life-time of a few days. Only the second half of the light curve contains a strong d quasi-periodic signal. We stress, however, that the 1.9 d long break in the data, which happened to take place during the most pronounced short-periodic oscillations has a detrimental influence on the wavelet spectrum; thus the features visible inside and close to the small trapezium region marked by white continuous lines in Fig. 2 represent numerical artifacts only. Thus, we cannot fully exclude the possibility that the period drifts were present also in the 2013 data but were suppressed by the presence of the data-taking gap. We also note that none of the longer time-scale features (around d) visible in both wavelet spectra can be regarded as a real effect due to relatively short duration of the observations; such signals are not visible directly in the light curves.
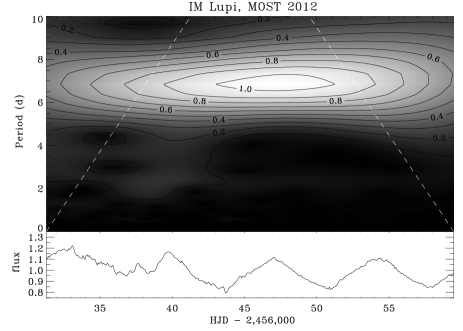
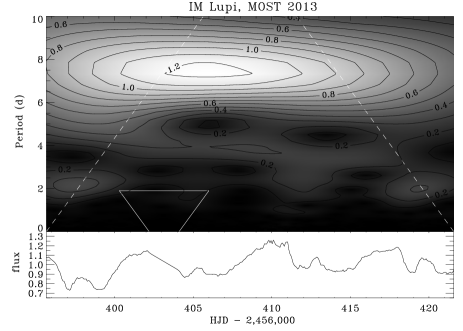
We also analysed IM Lup light curves in the same way as for RU Lup. As expected, the features representing the primary 7.5 d peaks in the Fourier spectra and directly visible in the light curves are also prominent and stable in the wavelet spectra (Fig. 2, bottom panels).
3.2 Multicolour SAAO observations
The MOST satellite is equipped with one broad-band filter. Supplementary multicolour observations allow one to differentiate between effects caused by mechanisms suggested to explain T Tauri star variability: variable extinction, magnetic cold spots or hot spots produced by magnetospheric accretion. This is particularly important for IM Lup, for which no previous multicolour light curves were available and for which contradictory WTTS vs. CTTS classifications were proposed in the past (Sec. 2.2). For this star a WTTS type is suggested by the 2012 MOST light curve, which looks similar to other WTTS targets observed by MOST (Siwak et al., 2011b). For this purpose we obtained multi-colour photometry of both stars at SAAO during 22 nights between 10 April and 7 May 2013. The stars were observed as secondary targets following TW Hya, which was our primary target during the SAAO observations.
We used the 0.75 m telescope equipped with TRIPOL which is a visitor instrument of the Nagoya University donated to SAAO. The observed field of view of arcmin was split by two dichroic mirrors and then directed to three SBIG ST-9XEI cameras through the Sloan filters, resulting in three simultaneous images for each exposure. In addition to three times higher observing cadence, the crucial advantage of this instrument is the possibility to track colour-index variations even during non-photometric conditions which prevailed during our observations. The typical spacing of our observations was 18–23 sec (including 3 sec read-out time), with full range of 13–33 sec, depending on the actual seeing and sky transparency. All frames were dark and flat-field calibrated in the standard way within the ESO-MIDAS package (Warmels, 1991). For photometric reduction we used the C-Munipack programme (Motl, 2011) utilising the DAOPHOT II package.
We were not able to monitor brightness variations of RU Lup due to many non-photometric nights during our run. This star is isolated on the sky (about 15 arcmin from IM Lup), without any suitable comparison star within the instrumental small field of view. Thus, only high-quality measurements of the colour index were feasible (Fig. 3, the left panel). In the case of IM Lup, nearby GCS 07838-00926 served as a convenient comparison star; it was found to be constant in the MOST observations (Sect. 3.1). We derived its approximate Sloan magnitudes on the night of 22/23 April 2013 using standard-star observations of the E600 region (Menzies et al., 1989) and the Johnson-system magnitudes of the standard stars transformed to the Sloan system using the equations given by Fukugita et al. (1996): , and . The light curve of IM Lup in the -band obtained by referencing to this star is shown in Figure 3. During the same night of photometric quality we frequently alternated observations of RU Lup and IM Lup, as used in the past in the era of one-channel photometers. This way we obtained an absolute calibration of RU Lup’s colour indices using the interpolated observations of GCS 07838-00926 as reference points.
A comparison of the RU Lup colour indices to that of a non-reddened Main-Sequence M0V star (, ; Fukugita et al. 1996), shows that the star is permanently bluer. The same situation is observed for IM Lup. At first glance the blue-colour excess is well visible during the maxima and branches. During light minima the colour index are and , and thus are bluer by only mag and mag than in M0V star. Note, that the errors are large but they include all uncertainties related with colour transformation to the Sloan system. However, the blue colour excess in IM Lup was never observed by us to decrease to zero, which may be explained by geometrical circumstances, such that before the hot spot located on the hemisphere directed towards the observer sets completely, the antipodal spot rises at the same time. We note that the colour indexes are significantly bluer in RU Lup than in IM Lup, which can be explained by the difference in the mass accretion rate of some three orders of magnitude between the two stars.
The results are in accordance with the historical results (Sec. 2.1) confirming that accretion and hot spots play major roles in RU Lup’s light variations. The same conclusion can be formulated for IM Lup for the first time based on results obtained in this work.
3.3 ASAS data


While the new MOST and SAAO observations addressed the variability of RU Lup and IM Lup in time scales of hours to about a week, an analysis of the archival ASAS data provided supplementary information on variability in long time-scales of days to years. The left-hand panels in Figure 4 show the ASAS Johnson -filter light curves of RU Lup and IM Lup gathered during nine observing seasons from 2001 to 2009. The observations were obtained at intervals of typically one to seven days. For details of the data collection and reduction, see Pojmanski & Maciejewski (2004). The typical error of a single data point was 0.037 mag for both stars.
The average brightness level of RU Lup was mag. The amplitude of light variations was moderate, mag and constant until , i.e. the 2005 season. Starting in 2006, the light variations were dominated by a long-term quasi-periodic oscillation with amplitude gradually growing with time up to mag. In contrast, IM Lup was fairly constant over the whole period of nine years, with the possibility of small sinewave-like variations. The average brightness level was mag. This value suggests that the visual companion GCS 07838-00926 (used as a comparison star for multi-colour observations, Sec. 3.2) was included in the aperture during photometry extraction. The scatter in magnitude measurements, as measured by their standard deviation was 0.063 mag.
The Fourier spectrum of RU Lup does not show any significant peaks at periods shorter than a month; only the low frequency peaks grouped within c/d are significant (Figure 4, the upper-right-hand panel). In addition to the obvious signal at a period of 1 year ( c/d), the strongest peak is produced by the well-defined quasi-periodic oscillation with mag amplitude which has been present since 2006. The shape and the central frequency of the corresponding peak are thus better defined in the Fourier spectrum for the ASAS data after . The period of the oscillation is d.
In contrast to RU Lup, the Fourier spectrum of IM Lup shows a well defined strong peak at frequency c/d ( d). This value is very similar to the values of 7.19-7.58 d obtained from the MOST data (Section 3.1.1).
4 High-resolution spectroscopic observations
We analysed public-domain spectra of RU Lup and IM Lup in an attempt to broaden the scope of our photometric investigation based on the MOST, SAAO, and ASAS observations. For the spectral analysis of the velocity field, we used the Broadening Function (BF) method (Rucinski, 2002). The goals were: (1) a comparison with the results utilising the cross-correlation function (CCF) analysis which reported possible spectral-line asymmetries in RU Lup, caused by photospheric spots (Stempels & Piskunov, 2002; Stempels et al., 2007) and (2) a new study of the same line-asymmetry in IM Lup.
The BF technique was introduced for the study of close binary stars some time ago (Rucinski, 1992) and since then has been considerably improved. In many details, the BF method is very similar to the least-squares deconvolution (LSD) method introduced by Donati & Collier Cameron (1997); Donati et al. (1997). The BF approach has several advantages over the CCF (Rucinski, 2002), mostly as a strictly linear method. It was extensively used during the David Dunlap Observatory radial velocity (RV) survey of short-period binary stars, as summarised by Rucinski (2010, 2012) proving to be an excellent method for studies of strong line-broadening due to rotation, binarity or spottedness. It has been also applied for studies of matter flows between components of contact and near-contact binary stars (Pribulla & Rucinski, 2008; Siwak et al., 2010; Rucinski, 2015) as well as in an attempt at metallically determination from extremely broadened spectra (Rucinski et al., 2013). In essence, the BF technique determines the Doppler broadening kernel in the convolution equation transforming a sharp-line spectral template into the observed spectrum. This way any radial-velocity-field induced effects are isolated as the kernel of the transformation.
| parameters/star | RU Lup 2000–2005 | RU Lup 2012 | IM Lup blue | IM Lup green | IM Lup yellow | IM Lup red |
|---|---|---|---|---|---|---|
| spectral region [Å] | 5907–6041 | 5660–5948 | 4445–4772 | 4975–5300 | 5400–5728 | 5910–6208 |
| [pix] | 1.5 | 1.5 | 2.0 | 2.0 | 2.0 | 2.0 |
| [km/s/pixel] | 0.84 | 0.76 | 0.65 | 0.58 | 0.54 | 0.50 |
| [km/s] | 2.97 | 2.68 | 3.06 | 2.73 | 2.54 | 2.35 |
| Number of spectra | 46 | 30 | 4 | 4 | 4 | 4 |
| [km/s] | ||||||
| [km/s] | 8.63(29) | 7.33(8) | 15.57 | 15.83 | 16.50 | 16.03 |
4.1 The spectral data and their analysis
We made use of the Phase-3 ESO archival data reduced by dedicated ESO pipelines or by actual observers. For RU Lup we used 76 high-resolution spectra from years 2000 – 2005 (46) and 2012 (30) obtained by the Ultraviolet Visual Echelle Spectrograph UVES (Dekker et al., 2004) during the programs identified as ID 65.I-0404, 69.C-0481, 075.C-0292 and 089.C-0299. For IM Lup, the data sets that we used consisted of four high-resolution spectra obtained with the High Accuracy Radial velocity Planet Searcher HARPS (Mayor et al., 2003) during two nights on 8/9 and 9/10 May, 2008 within the programme ID 081.C-0779.
Metallic absorption lines of RU Lup below Å are seriously contaminated by numerous and strong emission lines. Only the red spectral regions (5907–6041 Å for the 2000–2005 data), the same as previously used by Stempels & Piskunov (2002) and Stempels et al. (2007), are suitable for BF determination. Due to a slightly different setup of the spectrograph during the 2012 run, the BFs were determined from a slightly bluer spectral region ( Å) than in the years 2000–2005 (Table 1). For all series of observations of RU Lup, two fragments containing emission lines (within Å and Å) were omitted from the BF determinations. The condition of absolute absence of emission features in the process of BF determination is very important, as they can lead to false features in the BFs which are similar to those produced by cold-spots (genuine photospheric intensity depressions); we refer interested readers to Section 3 of Rucinski (2015) for more explanations.
During the process of BF determination we used for both stars a single synthetic spectrum calculated with the programme SPECTRUM (Gray, 2010) using Kurucz’s M0V model (Kurucz, 1992) with solar abundances given by Anders & Grevesse (1989), with to match lower gravity of T Tau stars. The original BF’s were smoothed with a Gaussian with a standard deviation pixels to match the spectrograph resolution. This operation changed the original velocity sampling of the BFs (determined by the CCD pixel size) into the instrument-limited effective velocity resolution , as given in Table 1 and shown in Fig. 5, 6 and 7. The exact values of the smoothing parameters turn out to have secondary significance on the details visible of the final BFs. We stress that the noise within individual BFs (measurable at the continuum level, outside the main peak) is significantly smaller than large-scale variations in the BFs reflecting surface heterogeneities, as discussed in the next sections. The observational noise (from noise in the spectra as well as from the BF determination) can be neglected at least to first approximation in the analysis.
Spectra of IM Lup exhibit only moderate and weak Balmer and helium emission lines with absorption lines practically uncontaminated by emissions in their cores. This opens up the possibility of obtaining BF’s from four different spectral regions to check for any wavelength-dependency and the internal consistency of the velocity determinations. The four spectral regions are defined in Table 1.
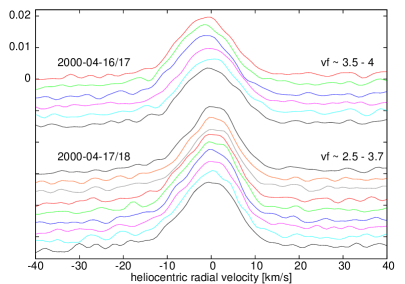
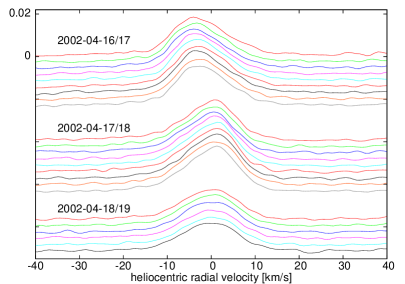
4.2 BF results for RU Lup
We show the BFs for RU Lup in Figure 5. They are ordered in a temporal sequence spanning years 2000 – 2005 on the left side of the figure and for selected, densely-covered, nightly intervals on the right hand side. We measured the BFs to extract essential radial velocity indicators such as the mean velocities or the degree of broadening. It is instructive to compare the results obtained with the BF and CCF methods (Stempels & Piskunov, 2002; Stempels et al., 2007). The mean radial velocities of RU Lup were obtained by fitting a Gaussian function that in parts were judged to be symmetric, almost perfectly matched to the BFs profiles. The mean radial velocities exhibit a jitter of km/s, i.e. smaller than 2.17 km/s found by (Stempels et al., 2007) using the CCF method. The discrepancy can be understood by different sensitivities of both methods to various parts of the velocity-broadened line profile: the CCF method is sensitive to the absorption line centres, which – because of the line asymmetries caused by the spots – exhibit more extreme variations than the entire spectral lines to which the BF method is more sensitive. The mean radial velocity of the star extended over all spectra, , derived from the BF method is km/s, i.e. slightly larger (by 0.3 km/s) than that determined by the CCF. We also find that using the BF method the average rotational line broadening velocity values obtained from the 2000-2005 and 2012 data sets, i.e. 8.63 and 7.33 km/s, respectively (Table 1), are smaller in comparison with km/s determined using the CCF.
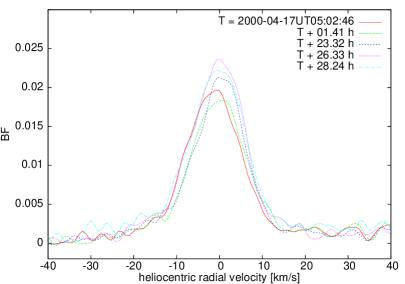
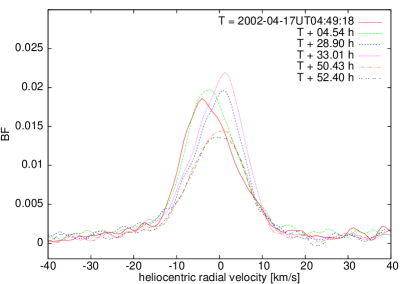
The real advantage of the BF approach over the CCF for determination of the rotational period is visible in the left panels of Figure 5: in spite of the low value of the BFs directly show considerable asymmetries, i.e. intensity depressions that may be caused by the long-persisting, large polar cold spot postulated by Stempels et al. (2007). The overall shape of BF profiles for RU Lup appears to vary in a time-scale of about 4 d. This is particularly well visible during the three consecutive nights of April, 2002, as shown in Figure 5. This leads us to confirmation of the result of Stempels et al. (2007) since the radial velocities derived for the whole time span of 13 years (including the 2012 data) can be perfectly well phased with the single period of 3.71058 d. We show this result in Figure 6, where all the BFs obtained over 13 years are ordered by the rotational phase calculated for this value of the period. The initial epoch was set arbitrarily at 0 UT of 16 Apr, 2000, i.e. the day of the first VLT-UT2 UVES RU Lup spectrum. The depressions caused by the cold spot are marked with vertical dashes. Note that, given the pole-on visibility of RU Lup ( deg), the spot remains visible during the entire stellar rotation. Similar figures obtained with phases calculated with slightly different values of the period look absolutely chaotic with none of the coherent variations in the BFs as clearly defined as in Figure 6. Only the first three BFs obtained during the first night of 16/17 April 2000 show deviations from the overall tendency – they are drawn by dotted lines in this figure for clarity. We claim that either a small reorganization of the cold spot, or appearance of short-term hot spot(s) with effective temperature(s) of 4500-7500 K may produce extra intensity in these BFs at negative radial velocities (see also in Section 4.3).
In addition to the asymmetries caused by the changing visibility of a large cold spot, we observe rapid – lasting only a few hours – variations of BF intensities due to variable spectral veiling which fills all spectral lines with an additional component, reducing their depth. Chaotic accretion bursts directly observable in the RU Lup light curves (Fig. 1) occur on similar time-scales and seem to be the main reason for these variations. The first panel of Figure 5 shows two values of interpolated from the values given in Fig. 3 of Stempels & Piskunov (2002), estimated from adjacent spectral regions to those used for the BF calculation. A very high was also found by Gahm et al. (2013) in the first 2005 spectrum presented in the bottom-left panel of Figure 5. As expected, due to the linear properties of BF, these values correlate with BF intensities in the sense that higher veiling leads to smaller integrated BF intensity. This opens up possibilities to re-determine veiling factors with BF intensity integrals; we will return to this issue in a separate publication, as it is beyond the scope of this paper.

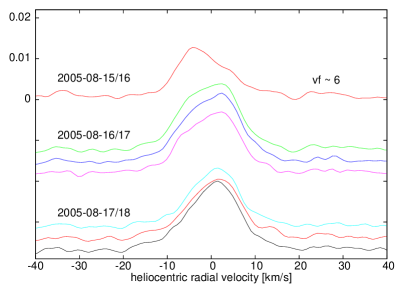
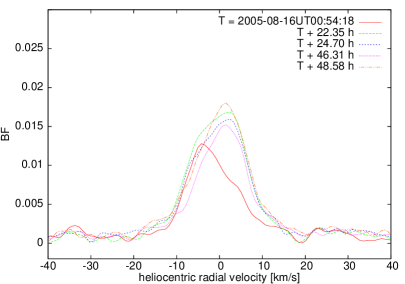
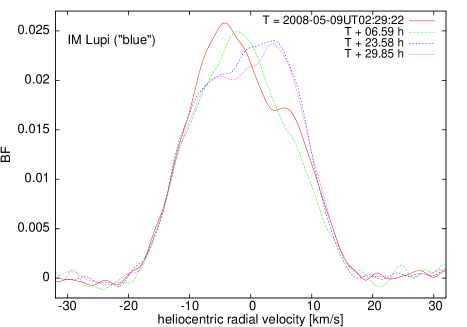
4.3 BF results for IM Lup
Temporal variations of the IM Lup Broadening Functions are shown in Figure 7. The BFs were obtained in the blue region within 30 hours; similar BFs obtained in other spectral bands change in a very similar way. Visual tracking of variations in consecutive BFs (see the legend of the figure to restore the time-line) suggests that the asymmetries are time-coherent and may be due to changing visibility of cold spots on the stellar surface. However, in contrast to RU Lup, the reasons for detailed variations in the BF profiles are probably more complex: IM Lup does not show any obvious veiling (see Sec. 2.2) and in many respects appears to be similar to MN Lup, for which hot spots of 5000–5800 K were detected on Doppler maps by Strassmeier et al. (2005). We claim that photometric variability of IM Lup is due to a hot spot temperature of K, as crudely estimated from the first part of 2013 MOST data () by means of the recent version of the Wilson-Devinney light curve synthesis code (Wilson, 1979)333In this process, we considered a grid of circular spots with 5–10 deg radii localized at latitudes 17 deg below the magnetic poles of the star. We took into account the known inclination, effective temperature of the star and the angle , as estimated in 3rd paragraph of Section 5. Equal temperatures of both polar hot spots were assumed and were searched manually to get the observed amplitude of light variations.. Such hot spots may affect rotationally-broadened stellar absorption lines in a fragmentary way with extra absorption. This would affect the line shapes appearing as a local intensity peak in the BF, which is otherwise fully determined by the colder surface areas.
We measured radial velocities of IM Lup by fitting synthetic rotational profiles to the entire individual BFs. Theoretical profiles were calculated using linear limb-darkening coefficients from tables of Diaz-Cordoves et al. (1995) and Claret et al. (1995), applied separately for each spectral region. Using km/s, the value of the inner-disc inclination of deg, and assuming that it is co-planar with the stellar equator, we obtain practically the same value of the stellar radius R⊙ as Pinte et al. (2008).
5 Discussion and Summary
Although the stars IM Lupi and RU Lupi have been well studied from the ground (see Section 2), the results obtained in this work shed new light on details of accretion properties in these CTTSs. Both stars fit well into the picture inferred from theoretical numerical simulations of magnetised-plasma accretion from the innermost accretion discs of Romanova et al. (2004, 2008); Kulkarni & Romanova (2008); Romanova & Kulkarni (2009); Kulkarni & Romanova (2009).
The two stars analyzed in this paper display accretion phenomena taking place in two different regimes of stable and unstable accretion. IM Lup, having a low mass-accretion rate (Sec. 2.2) and fairly regular light curves modulated by hot spots with a period of 7.19 – 7.58 d, is an excellent example of a CTTS accreting in the stable regime. In this regime, the steady plasma flow takes place from the inner disc toward the stellar magnetic poles in two funnels encircling the magnetosphere, to produce two antipodal arc-like hot spots which co-rotate with the star. Depending on the inclination angle and the misalignment angle between the stellar rotation axis and the magnetic pole axis, either one or both hot spots can be visible to an observer during a single stellar rotation. The lack of optical veiling in IM Lup is in line with the moderate hot spot temperature of K, crudely estimated from the 2013 MOST light curve.
Kulkarni & Romanova (2013) considered shapes, widths and positions of hot spots created by stable accretion funnels. They found that for a broad range of parameters, the arc-like hot spots are formed at stellar latitudes 16–18 deg below the magnetic pole, and their typical polar widths are 7–8 deg. In combination with the finding from the MOST observations of IM Lup, which in 2012 showed a fairly regular light curve likely modulated by a single spot, while in 2013 by two hot spots, the theoretical results can be used to estimate . Assuming that the stellar equator is coplanar with the inner accretion disc, for rotation angle inclination of deg (Pinte et al., 2008), the spot on the opposite hemisphere may occasionally be invisible to the observer if deg, with some likely variations in the hot spot latitudes, their polar widths or maybe even of itself.
The variability phenomena of RU Lup are much more complex than in IM Lup. Due to the chaotic character of light variations and a lack of any single stable periodicity in light curves, we infer that the unstable accretion regime operates in RU Lup. As noted in Section 1, in this regime, which is favoured in CTTS having high mass accretion rates (see Sec. 2.1), the hot spots are formed by a few tongues created by RT instabilities. The number, position and shape of the hot spots change on the inner disc dynamical timescale, sometimes as low as 1–2 d, masking the stellar rotation frequency in the frequency spectra (Romanova et al., 2008; Kulkarni & Romanova, 2008, 2009). Hence, in spite of about 52 days of continuous photometric monitoring of the star with MOST, we were unable to detect any stable periodicity corresponding to the persisting 3.71 d signal in radial velocities discovered by Stempels et al. (2007). This is fully and independently confirmed by our re-analysis of archival spectra using the Broadening Function approach (Sec. 4.2). This 3.71 d signal most likely represents the true rotational period of the star.
During the process of unstable accretion, the 3D MHD numerical models predict
the appearance of quasi-periods distributed around the value of the stellar rotational
period.
Such 4.5–2 d and 5–4 d quasi-periodic features were indeed noticed in the 2012
light curve of RU Lup (Sec. 3.1.2).
The most extreme case, however, is represented by several 2–1 d quasi-periods detected
in 2012 and 2013, which are apparently caused by hot spots moving relative to the photosphere
with a considerably higher inner disc rotational frequency.
In accord with Kulkarni & Romanova (2008); Romanova & Kulkarni (2009); Kulkarni & Romanova (2009) the tongues formed through
the RT instabilities originate at the inner disc radii of about 5.8 R⊙, a value which
is significantly smaller than the disc co-rotation radius of 8.74 R⊙, evaluated from
the stellar rotational period of 3.71 d and the mass of 0.65 M⊙ (Sec. 2.1).
We also note that the 2012 MOST observations of
RU Lup showed drifting quasi-periodic features, similar to TW Hya
observed in 2008 and 2009 (Rucinski et al., 2008; Siwak et al., 2011a).
This can be interpreted in the context of the results presented in
Section 4.3 of Kulkarni & Romanova (2009), which indicate that quasi-periodic
features may show a tendency towards period shortening for the
increasing mass accretion rate within individual tongues.
This leads to the non-linear development of RT instabilities
and a local reduction of the inner-disc radius, what in turn produces a progressive
increase of the rotational frequency of the tongue, and of the resulting hot spot.
Although the quasi-periodic features observed in RU Lup in
2013 did not show any obvious trends in the period length,
the apparent absence may be due to our inability to detect them
through wavelets due to the long break in the data acquisition
(see Sec. 3.1 and in Fig. 2).
Whereas the day time-scale variability appears to have direct explanation in the accretion phenomena between the inner accretion disc and the surface of the star, it is unclear what mechanism produces the long-term d quasi-periodic variation in RU Lup. We saw this over the span of four years in the ASAS observations (Sec. 3.3). The long time-scale suggests that the outer parts of the accretion disc where some density disturbances occur, may indirectly lead to semi-periodic light variations. One possibility is pressure scale-height perturbations or proto-planetary nuclei that can create spiral arms (Juhász et al., 2015). We suggest that perhaps the spiral arms could lead to cyclical (i.e. the d) modulation of the inner disc plasma density and thus of the mass accretion rate, the hot-spot filling factor and associated veiling, which ultimately would affect the mean brightness of the star when averaged over monthly intervals. Unfortunately the UVES spectra were obtained during the first half of the ASAS observations, when the 258 d quasi-periodic oscillation did not seem to be present. Therefore we could not find any possible correlation between the mass accretion rate estimated from the spectra, and the mean stellar brightness from the available photometric data.
The more complex of the two stars, RU Lup, is similar to TW Hya,
which is the best photometrically explored CTTS so far from space.
Both stars have similar spectral type, show vigorous accretion,
are visible in a pole-on orientation, and
long-lasting cold spots near the magnetic poles modulate
their radial velocity variations with similar
periods of 3.71 d (RU Lup) and 3.57 d (TW Hya, Donati et al. 2011).
The four MOST runs of TW Hya provided light
curves showing evidence of a constantly varying
accretion regime (Siwak et al., 2014), in accordance with
the Romanova et al. (2008) prediction of alternating episodes of stable
and unstable accretion, depending on the mass accretion rate.
It is therefore not excluded that at times, perhaps during
the brightness minimum, when drops down to mag
(see Section 2.1 and the previous paragraph),
RU Lup may show accretion running in a moderately stable or even a stable regime.
Such events would allow one to determine the rotational period
of the star from photometry (Kurosawa & Romanova, 2013).
Ideally, future space-based photometric observations should be followed
by spectro-polarimetric observations capable of reproducing the hot spot
distribution in stellar coordinates.
For instance this technique applied to TW Hya in 2008, revealed polar,
mid- and low-latitude brightness excess regions (Donati et al., 2011), indicating
the presence of hot spots created both through a stable polar funnel and unstable tongues.
In spite of this evidence of moderately stable accretion, the light curve simultaneously
obtained by MOST (Rucinski et al., 2008) is dominated by clear signs of unstable accretion.
While long-term, continuous photometric monitoring of CTTSs from space has now become a well established tool (Cody et al., 2014; Stauffer et al., 2014), such observations frequently show very complex superposition of many phenomena, particularly in T Tau stars accreting in the unstable regime, such as RU Lup or TW Hya. For the determination of rotational periods, a much more efficient approach is through the use of high-resolution spectroscopy followed by analysis using linear deconvolution methods, such as for TW Hya by Donati et al. (2011) or for RU Lup analyzed in this paper. Unlike photometry, such methods are sensitive to cold-spot induced line-profile variations permitting rotational period determination even from a moderate number of spectra. The radial velocity variations induced by such spots are not negligible and reach amplitudes that may exceed 2 km/s, a limitation which carries an important ramification for RV planetary searches around CTTSs and may explain the lack of success for the extant searches (Bailey et al., 2012; Crockett et al., 2012; Lagrange et al., 2013), since the required accuracy necessary for discovery of Jupiter-mass planet is of the order of 100 m s-1. Linear deconvolution techniques, such as the Broadening Function technique, and the classical Doppler imaging technique, may permit removal of the star-spot perturbations (Donati et al., 2015), particularly for the “cleaner” CTTSs accreting in a stable regime.
Acknowledgments
This study was based on:
(1) data from the MOST satellite, a Canadian Space Agency
mission jointly operated by Dynacon Inc., the University of Toronto Institute
of Aerospace Studies, and the University of British Columbia, with the assistance
of the University of Vienna,
(2) observations made at the South African Astronomical Observatory,
(3) data obtained from the ESO Science Archive Facility under
request numbers 145841 and 145843, within the pogrammes ID 65.I-0404, 69.C-0481,
075.C-0292, 081.C-0779 and 089.C-0299,
(4) data obtained from the All Sky Automated Survey (ASAS) telescope of
the Warsaw University Astronomical Observatory.
MS and WO are grateful to the Polish National Science Centre
for the grant 2012/05/E/ST9/03915.
The Natural Sciences and Engineering Research
Council of Canada supports the research of DBG,
JMM, AFJM and SMR.
Additional support for AFJM was provided by FRQNT (Québec).
CC was supported by the Canadian Space Agency.
RK and WWW is supported by the Austrian Science Funds (P22691-N16).
MS and WO acknowledge Dr. Hannah Worters and the entire SAAO staff
for their hospitality.
This paper also made use of NASA’s Astrophysics Data System (ADS) Bibliographic
Services.
Special thanks also go to the anonymous referee for useful suggestions
and comments on a previous version of this paper.
References
- Alencar et al. (2010) Alencar, S. H. P., Teixeira P. S., Guimaraes M. M., McGinnis P. T., Gameiro J. F., et al., 2010, A&A, 519, 88
- Anders & Grevesse (1989) Anders E., Grevesse N., 1989, GeCoA, 53, 197
- Appenzeller et al. (1983) Appenzeller I., Jankovics I., Krautter J., 1983, A&AS, 53, 291
- Bailey et al. (2012) Bailey J. I., White R. J., Blake C. H., Charbonneau D., Barman T. S., Tanner A. M., Torres G., 2012, ApJ, 749, 16
- Batalha & Basri (1993) Batalha C. C., Basri G., 1993, ApJ, 412, 363
- Batalha et al. (1998) Batalha C. C., Quast G. R., Torres C. A. O., Pereira P. C. R., Terra M. A. O., et al., 1998, A&A Supl. Ser., 128, 561
- Claret et al. (1995) Claret A., Diaz-Cordoves J., Gimenez A., 1995, A&AS, 114, 247
- Cody et al. (2013) Cody A. M., Tayar J., Hillenbrand L. A., Matthews J. M., Kallinger T., 2013, AJ, 145, 79
- Cody et al. (2014) Cody A. M., Stauffer J., Baglin A., Micela G., Rebull L. M. et al., 2014, AJ, 147, 82
- Comerón (2008) Comerón F., 2008, Handbook of Star Forming Regions Vol. II, Astronomical Society of the Pacific
- Crockett et al. (2012) Crockett C. J., Mahmud N. I., Prato L., Johns-Krull C. M., Jaffe D. T., Hartigan P. M., Beichman C. A., 2012, ApJ, 761, 164
- Dekker et al. (2004) Dekker H., D’Odorico S., Kaufer A., Delabre B., Kotzlowski H., 2004, SPIE, 4008, 534
- Diaz-Cordoves et al. (1995) Diaz-Cordoves J., Claret A., Gimenez A., 1995, A&AS, 110, 329
- Donati & Collier Cameron (1997) Donati, J.-F., & Collier Cameron, A. 1997, MNRAS, 291, 1
- Donati et al. (1997) Donati, J.-F., Semel, M., Carter, B.D., Rees, D.E., Collier Cameron, A. 1997, MNRAS, 291, 658
- Donati et al. (2011) Donati J.-F., Gregory S.G., Alencar S.H.P., Bouvier J., Hussain G., et al., 2011, MNRAS, 417, 472
- Donati et al. (2015) Donati J.-F., Hébrard E., Hussain G. A. J., Moutou C., Malo L., et al., 2015, MNRAS, 453, 3706
- Errico et al. (1996) Errico L., Giovannelli F., Vittone A. A., 1996, MmSAI, 67, 209
- Finkenzeller & Basri (1987) Finkenzeller U., Basri G., 1987, ApJ, 318, 823
- Fukugita et al. (1996) Fukugita M., Ichikawa T., Gunn J. E., Doi M., Shimasaku K., Schneider D. P., 1996, AJ, 111, 1748
- Gahm et al. (1974) Gahm G. F., Nordh H. L., Olofsson S. G., Carlborg N. C. J., 1974, A&A, 33, 399
- Gahm et al. (1979) Gahm G. F., Fredga K., Liseau R., Dravins D., 1979, A&A, 73, L4
- Gahm et al. (2013) Gahm G. F., Stempels H. C., Walter F. M., Petrov P. P., Herczeg G. J., 2013, A&A, 560, 57
- Giovannelli et al. (1991) Giovannelli F., Errico L., Vittone A. A., Rossi C., 1991, A&AS, 87, 89
- Giovannelli et al. (1995) Giovannelli F., Vittone A. A., Rossi C., Errico L., Bisnovatyi-Kogan G. S., et al., 1995, A&ASS, 114, 341
- Günther et al. (2010) Günther H. M., Matt S. P., Schmitt J. H. M. M., Güdel M., Li Z.-Y., Burton D. M., 2010, A&A, 519, 97
- Gray (2010) Gray R. O., 2010, http://www.appstate.edu/ grayro/spec- trum/spectrum276/
- Herbst et al. (1994) Herbst W., Herbst D. K., Grossman E. J., Weinstein D., 1994, AJ, 108, 1906
- Herczeg et al. (2005) Herczeg G. J., Walter F. M., Linsky J. L., Gahm G. F., Ardila D. R., et al., 2005, AJ, 129, 2777
- Hoffmeister (1958) Hoffmeister C., 1958, Veroff. Sternw. Sonnberg, 3, 333
- Hoffmeister (1965) Hoffmeister C., 1965, Veroff. Sternw. Sonnberg, 6, 93
- Hutchinson et al. (1989) Hutchinson M. G., Evans A., Davies J. K., Bode M. F., 1989, MNRAS, 237, 683
- Joy (1945) Joy A. H., 1945, ApJ, 102, 168
- Juhász et al. (2015) Juhász A., Benisty M., Pohl A., Dullemond C. P., Dominik C., Paardekooper S.-J., 2015, MNRAS, 451, 1147
- Königl (1991) Königl A., 1991, ApJ, 370, L39
- Kulkarni & Romanova (2008) Kulkarni A. K., Romanova M. M., 2008, MNRAS, 386, 673
- Kulkarni & Romanova (2009) Kulkarni A. K., Romanova M. M., 2009, MNRAS, 398, 701
- Kulkarni & Romanova (2013) Kulkarni A. K., Romanova M. M., 2013, MNRAS, 433, 3048
- Kurosawa & Romanova (2013) Kurosawa R., Romanova M. M., 2013, MNRAS, 431, 2673
- Kurucz (1992) Kurucz R., 1992, IAUS, 149, 225
- Lagrange et al. (2013) Lagrange A.-M., Meunier N., Chauvin G., Sterzik M., Galland F., Lo Curto G., Rameau J., Sosnowska D., 2013, A&A, 559, A83
- Lamzin et al. (1996) Lamzin S. A., Bisnovatyi-Kogan G.S., Errico L., Giovannelli F., Katysheva N. A., Rossi C., Vittone A. A., 1996, A&A, 306, 877
- Matthews et al. (2004) Matthews J. M., Kusching R., Guenther D. B., Walker G. A. H., Moffat A. F. J., Rucinski S. M., Sasselov D., Weiss W. W., 2004, Nature, 430, 51
- Martin et al. (1994) Martin E. L., Rebolo R., Magazzu A., Pavlenko Y. V., 1994, A&A, 282, 503
- Mawet et al. (2012) Mawet D., Absil O., Riaud P., Surdej J., Montagnier G., et al., 2012, A&A, 544, 131
- Mayor et al. (2003) Mayor M., Pepe F., Queloz D., Bouchy F., Rupprecht G., et al., 2003, The Messenger, 114, 20
- Menzies et al. (1989) Menzies J. W., Cousins A. W. J., Banfield R. M., Laing J. D., 1989, SAAO Circulars, 13, 1-13
- Merrill (1941) Merrill P. W., 1941, PASP, 53, 342
- Motl (2011) Motl D., 2011, http://c-munipack.sourceforge.net
- Panić et al. (2009) Panić O., Hogerheijde M. R., Wilner D., Qi C., 2009, A&A, 501, 269
- Pinte et al. (2008) Pinte C., Padgett D. L., Menard F., Stapelfeldt K. R., Schneider G., et al., 2008, A&A 489, 633
- Pojmanski & Maciejewski (2004) Pojmanski, G., Maciejewski, G., 2004, AcA, 54, 153
- Pribulla & Rucinski (2008) Pribulla T., Rucinski S. M., 2008, MNRAS, 386, 377
- Plagemann (1969) Plagemann S., 1969, Mem. Soc. Roy. Sci. Liege, 5th Series, 19, 331
- Reipurth et al. (1996) Reipurth Bo, Pedrosa A., Lago M. T. V. T., 1996, A&AS, 120, 229
- Romanova et al. (2004) Romanova M. M., Ustyugova G. V., Koldoba A. V., Lovelace R. V. E., 2004, ApJ, 610, 920
- Romanova et al. (2008) Romanova M. M., Kulkarni A. K., Lovelace R. V. E., 2008, ApJ, 673, L171
- Romanova & Kulkarni (2009) Romanova M. M., Kulkarni A. K., 2009, MNRAS, 398, 1105
- Rucinski (1992) Rucinski S. M., 1992, AJ, 104, 1968
- Rucinski (2002) Rucinski S. M., 2002, AJ, 124, 1746
- Rucinski et al. (2008) Rucinski S. M., Matthews J. M., Kuschnig R., Pojmanski G., Rowe J., et al., 2008 MNRAS, 391, 1913
- Rucinski et al. (2010) Rucinski S. M., Zwintz K., Hareter M., Pojmanski G., Kuschnig R., et al., 2010, A&A, 522, 113
- Rucinski (2010) Rucinski, S. M. 2010, ASP Conf., 435, 195
- Rucinski (2012) Rucinski, S. M. 2012, in From Interacting Binaries to Exoplanets: Essential Modeling Tools, IAU Symp. 282, M. Richards and I. Hubeny (eds), p.365
- Rucinski et al. (2013) Rucinski S. M., Pribulla T., Budaj J., 2013, AJ, 146, 70
- Rucinski (2015) Rucinski S. M., 2015, AJ, 149, 49
- Schwartz & Heuermann (1981) Schwartz R. D., Heuermann R.,1981, AJ, 86, 1526
- Siwak et al. (2010) Siwak M., Zola S., Koziel-Wierzbowska D., 2010, AcA, 60, 305
- Siwak et al. (2011a) Siwak M., Rucinski S. M., Matthews J. M., Pojmanski G., Kuschnig R., et al., 2011a, MNRAS, 410, 2725
- Siwak et al. (2011b) Siwak M., Rucinski S. M., Matthews J. M., Kuschnig R., Guenther D. B., et al., 2011b, MNRAS, 415, 1119
- Siwak et al. (2013) Siwak M., Rucinski S. M., Matthews J. M., Kuschnig R., Guenther D. B., et al., 2013, MNRAS, 432, 194
- Siwak et al. (2014) Siwak M., Rucinski S. M., Matthews J. M., Kuschnig R., Guenther D. B., et al., 2014, MNRAS, 444, 327
- Stauffer et al. (2014) Stauffer J., Cody A. M., Baglin A., Alencar S., Rebull L., et al., 2014, AJ, 147, 83
- Stempels & Piskunov (2002) Stempels H. C., Piskunov N., 2002, A&A 391, 595
- Stempels et al. (2007) Stempels H. C., Gahm G. F., Petrov P. P.,2007, A&A 461, 253, 259
- Stetson (1987) Stetson P. B., 1987 PASP, 99, 191
- Strassmeier et al. (2005) Strassmeier K. G., Rice J. B., Ritter A., Küker M., Hussain G. A. J., Hubrig S., Shobbrook R., 2005, A&A, 440, 1105
- Walker et al. (2003) Walker G. A. H., Matthews J. M., Kuschnig R., Johnson R., Rucinski S. M., et al., 2003, PASP, 115, 1023
- Warmels (1991) Warmels R. H., 1991, PASP Conf. Series, 25, 115
- Wichmann et al. (1998) Wichmann R., Bastian U., Krautter J, Jankovics I., Rucinski S. M., 1998, MNRAS, 301, L39
- Wichmann et al. (1999) Wichmann R., Covino E., Alcala J. M., Krautter J. Allain S., Hauschildt P. H., 1999, MNRAS, 307, 909
- Windemuth et al. (2013) Windemuth D., Herbst W., Tingle E., Fuechsl R., Kilgard R., Pinette M., Templeton M., Henden A., 2013, ApJ, 768, 67
- Wilson (1979) Wilson R. E., 1979, ApJ, 234, 1054
- Valenti et al. (2003) Valenti J. A., Fallon A. A., Johns-Krull C. M., 2003, AJSS, 147, 305
- van Kempen et al. (2007) van Kempen T. A., van Dishoeck E. F., Brinch C., Hogerheijde M. R., 2007, A&A 461, 983
- Zwintz et al. (2013) Zwintz K., Fossati L., Guenther D. B., Ryabchikova T., Baglin, A., et al., 2013, A&A, 552A, 68