On the origin of near infrared photoluminescence in Bismuth-doped aluminosilicate glass
Abstract
The near infrared (NIR) photoluminescence (PL) in Bismuth-doped aluminosilicate glasses was reported about of 16 years ago. Although it has since been developed various kinds of fiber lasers and amplifiers based on the Bismuth-doped silica glasses, the main problem, namely the nature of NIR PL, remains unsolved. Here we show that this famous NIR PL in Bismuth-doped aluminosilicate glass originates from the defect, most probably positively charged oxygen vacancy V in the glass network. This defect interacts with Bi+ ion in its environment via the energy transfer.
Interest in Bismuth-doped materials is caused by a multitude of potential applications. Perhaps the most exciting application of Bi-doped materials is in the area of fiber lasers (BFL) and amplifiers (BFA) that cover inaccessible by the rare earths spectral windows Bufetov2009 . Nevertheless, such devices suffer from a number of drawbacks. The very low levels of Bismuth doping and, as a consequence, significant fiber length (typically 80 - 100 m) are necessary to ensure the efficient BFL and BFA operation. Also, the efficiency of the BFL and BFA remains significantly lower in comparison to their rare earth counterparts. Poor understanding of the nature of luminescent centers in Bi-doped glasses does not allow the development of efficient devices. Unfortunately, since the first demonstration of the near infrared (NIR) photoluminescence (PL) in Bi-doped silica glasses Fujimoto2001 and up to now its nature remains a subject of controversies Peng2011a ; Dianov2012a .
Recently Laguta2015b , some of us investigated the magnetic circular polarization of luminescence (MCPL) in Bi-doped pure silica glass with low Bismuth content and without other dopant. It was shown that the lasing excited state (ES) is a magnetic multiplet and the temperature dependence of the degree of MCPL was in excellent agreement with the model of emission from an isolated non-Kramers doublet. The latter implies that the center responsible for the lasing is an even electron system. Furthermore, the spectral features of MCPL allow to assume that the ground state (GS) is also magnetic multiplet that in turn denies Bi+ ions as a possible origin of NIR PL. Unfortunately, the extremely low content of Bismuth in studied samples did not allow to probe the active centers with magnetic circular dichroism (MCD) technique. In contrast to MCPL, MCD technique Stephens1974a ; Riehl1976a probes directly GS of an active center and it could be able to solve definitely this problem. Very recently Laguta2015c we also shown with both MCPL and MCD techniques, that in heavily doped aluminosilicate glass there exist three centers, and all of which can be described as even-electron center. In the present Letter we report the investigation of Bi-doped aluminosilicate system, namely, MgO-Al2O3-SiO2 glass Denker2009 , with a relatively high content of Bismuth. For the first time our experiments unambiguously prove that in Bi-doped aluminosilicate glass there is a system of two interacting centers which consists of Bi+ ion and some defect in the glass network, the latter being induced or modified by the Bismuth doping. This defect is responsible for the strong absorption in the visible range of spectrum (maximum at 500 nm) and intense luminescence in the NIR which was the subject of long debates. Finally, the third center, clearly detected in MCD spectrum, can be put in correspondence to clusters of Bismuth ions.
The glass synthesis was performed in corundum crucibles at 1470 ∘C following the procedure described previously Denker2009 . In the present study the following basic composition of aluminosilicate glass was chosen 22.2 wt.% MgO + 22.2 wt.% Al2O3 and 55.6 wt.% SiO2. To this content 3, 1, 0.5, 0.125 or 0 mol.% of Bi2O3 were added. All results reported in this Letter were obtained with sample containing 0.5 mol.% of Bi2O3.
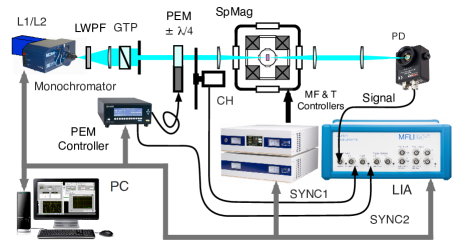
The experimental setup for MCD measurements is shown schematically in Fig. 1. The experiments in the temperature range of 1.4 - 280 K and magnetic fields (MF) in the range of 0 - 6.5 T were performed in the closed cycle magneto-optical cryostat (SpectromagPT, Oxford Instr.). The thermal stability of the samples attached to the holder of the variable temperature insert was about of 0.01 K except the range from 4.2 to 10 K where the thermal stability was 0.05 K. The quartz tungsten or UV enhanced Xenon lamps were used as a source filtered with a single grating monochromator. After the exchangeable long wave pass filter (LWPF) and collimating lens the light beam was polarized with a large aperture Glan-Thompson polarizer (GTP). The central part of the beam selected by diaphragm was modulated first by the photo-elastic modulator (PEM) at quarter-wave peak retardation at the frequency 20.077 kHz (I/FS-20, Hinds Instr.) then chopped at 400 Hz. The beam impinges on the sample located in a magneto-optical cryostat, then focused on the amplified silicon or Ge photodiode (PDA36A or PDA30B, Thorlabs). Two resulting signals at 400 and 20 kHz were demodulated simultaneously by the multi-frequency lock-in amplifier (MFLI, Zurich Instr.). The spectral resolution in the range 320 - 900 nm was 2.2 nm, and 5 nm between 900 and 1550 nm. The signal of MCD measured in our experiments was defined as A = V20kHz/ V400Hz, where and are the signals obtained directly from the lock-in amplifier at corresponding frequency Mason2007 . The excitation and PL spectra were measured following the procedure described previously Laguta2015a .
In Fig. 2(a) and (b) we show the absorption and excitation spectra, respectively, measured at room temperature. It is seen that only two absorption bands with maximums at 488 (D2) and 703 nm (B1) can be detected in the range 400 - 1550 nm. These absorption bands coincide with two bands in the excitation spectrum recorded at 1110 nm that corresponds to the NIR PL band shown in Fig. 2(b). The excitation spectrum reveals an additional band in the NIR spectral region with the maximum at 1030 nm, that corresponds to the Stokes shift for the NIR PL band 700 cm-1.
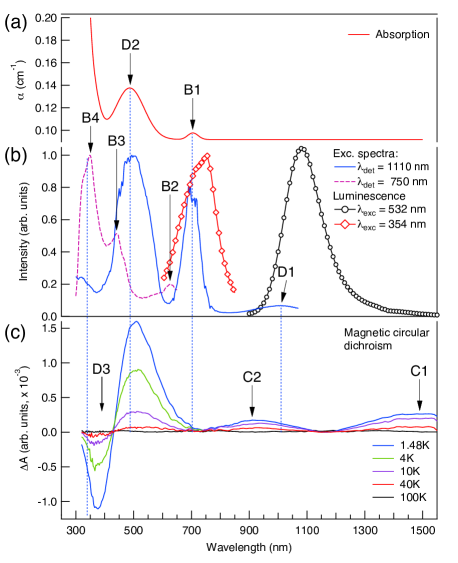
At first glance both D2 and B1 bands belong to the same NIR PL center. Nevertheless, excitation spectrum recorded at 750 nm corresponding to the ”red” PL band, also shown in Fig. 2(b), reveals three bands at 626 (B2), 441 (B3) and 339 nm (B4) that do not coincide with NIR PL excitation spectrum. This discrepancy can be explained by the presence of two centers with the energy transfer between them. This assumption is supported by the MCD spectra shown in Fig. 2(c). First, all the observed bands in the spectrum are temperature dependent that implies magnetic multiplets in the corresponding GS’s. Second, only the strongest MCD band at 510 nm can be put in direct correspondence to the absorption and excitation band D2. Third, there is no MCD bands that could correlate with one of the bands in B series. It follows immediately that D2 band corresponds to the center with the magnetic multiplet in its GS. Thus, band D2 cannot be assigned to Bi+ ion as it has been proposed in many anterior works, for example in Zhou2008a . On the contrary, band B1 can be assigned to the E state (3P1, MJ=1 in C3v local symmetry) of Bi+ ion because its GS is a magnetic singlet and we do not expect to observe the effect of MCD for this ion. Also, this transition can be sufficiently strong Davis1967 ; Bartram1989b . Moreover, it has been shown in Razdobreev2014a that in Ga/Bi co-doped silica glass, which is a counterpart of the studied here Bismuth-doped aluminosilicate glass, the main relaxation channel of the state corresponding to the band B1 is the energy transfer due to the strong quadrupole-quadrupole interaction with another center. This explains the appearance of band B1 in the excitation spectrum recorded at 1110 nm. Returning to Fig. 2(c), one can see that MCD spectrum reveal the additional bands: at 374 nm (D3), 910 nm (C2), and a very large band (C1) from 1200 nm up to the limit of available spectral range. This latter band has a flat maximum between 1420 and 1520 nm and, most probably, it consists of at least two overlapping bands. The bands C1 and C2 cannot be assigned to one of the above series (centers). The details on the origin of MCD bands were obtained investigating their temperature and MF dependences.
In Fig. 3 we show the MF dependences of A plotted as a function of at fixed temperatures, where is the Bohr magneton, and is the Boltzmann constant. It is seen that for MCD band D2 at 505 nm the isotherms corresponding to various temperatures are nearly coincident (Fig. 3(a)). On the contrary, for NIR MCD band C2 the isotherms exhibit pronounced nesting behavior and saturation at low temperatures (Fig. 3(c)). In Fig. 3(b) and (d) the corresponding data from the left panels of the figure were replotted to show the saturation data in terms of temperature dependence at constant field. It is seen that for the band D2 the magnetization does not attain saturation at any field. In contrast, the magnetization easily saturates in the NIR band C2 resulting in distinct values of A. The behavior of bands D3 and C1 was very close to that of D2 and C2, respectively. For this reason we assigned D2 and D3 to the same series, while C1 and C2 belongs to another one. The behavior exhibited by the MCD bands D2, D3, C1, C2 can be explained with the assumption that both centers (D and C) are the even-electron systems (see more detailed discussion in Laguta2015b ). The data in Fig. 3(b) and (d) were fitted together with that for D3 and C1 MCD bands (not shown in Fig. 3) to the following orientation averaging integral Solomon1995a :
| (1) |
where , , is the splitting between two magnetic sub-levels due to the rhombic component of the crystal field and Asat is the saturation constant. The data fit results are reported in Table 1 and the corresponding profiles of A as a function of inverse temperature are shown in Fig. 3. It is seen that MCD bands Ci and Di belong to different centers, as already has been noted above. Given a sufficiently large value of g-factor obtained for Ci bands, we believe that they should be assigned to clusters of Bismuth ions. It is also worth noting that all the values of zero-field splitting (ZFS) are too large to observe the electron spin resonance (ESR) in the most commonly used X- or even Q-band.
| Center | Wavelength | ||
|---|---|---|---|
| (nm) | (cm-1) | ||
| D (defect) | 375, 505 | 1.36 0.13 | 0.9 0.03 |
| C (cluster) | 940, 1500 | 2.77 0.02 | 4.4 0.02 |
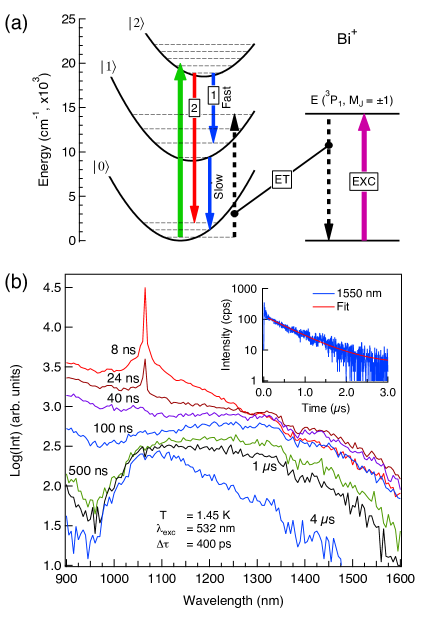
We assign all the Di peaks in the excitation and MCD spectra, as well as the NIR PL at 1110 nm, to the defect in the glass network. In Fig. 4(a) we show schematically the energy levels of this defect interacting with Bi+ ion in its environment. Here we show only two ES’s of defect and the first ES multiplet of Bi+ ion. It is clear from the absorption spectrum shown in Fig. 2(a) that the transition is allowed. At the same time the transition is forbidden, because it does not appear neither in absorption nor in MCD spectra and the lifetime of the NIR PL from the state is very long. On the contrary, we can expect that transition is allowed because of the very strong ES absorption from the state for the wavelengths shorter than 1000 nm Kalita2008a . Thus, it is possible to observe two fast (allowed) transitions in the emission: and , shown with blue (1) and red (2) arrows in Fig. 4(a). The first transition should span only NIR wavelength region, while the second one can be observed also in the visible. In Fig. 4(b) we show the time resolved spectra recorded under sub-nanosecond pulse excitation (micro-chip single longitudinal laser with 1 GHz) in the wavelength range 900 - 1600 nm. At the initial stage of PL, due to the intense monochromatic excitation, one can observe the fluorescence line narrowing in the spectrum, which is dominated by two fast components. The short and long cut-off wavelengths for the forbidden transition are 950 and 1500 nm, respectively. The PL recorded between 1500 and 1600 nm corresponds to the transition and its kinetics at 1550 nm is shown in the inset. The single exponential fit resulted in the lifetime as short as 0.64 0.01 s. Transition appears as a red luminescence with a trailing NIR wing under excitation in the state of the defect. When excited at 354 nm, this luminescence appears as a short-wavelength shoulder of the “red”PL band shown in Fig. 2(b). The experimental proof of this statement, which follows from the analysis of MCPL is out of the scope of this Letter and will be reported elsewhere.
Point defects or localized states caused by the presence of 6 (Bi, Pb) and 5 (Sn, Sb) ions were considered for the first time by Sharonov et al. Sharonov2008 ; Sharonov2009 without emphasis on a particular nature of these centers. They also pointed out that four major bands on excitation-emission plots do not necessarily belong to the same optical center. MCD experiments reported here directly confirm this assumption for aluminosilicate glass. Recently, Dianov et al. Dianov2015a ; Sokolov2015a suggested one more microscopical model of NIR PL centers in Bismuth-doped oxide glasses in which Bi2+ and oxygen vacancy form a single molecular unit. In Laguta2015b some of us have shown that this model fails to explain the NIR PL in Bismuth-doped pure silica. Presented here experiments show that it fails also to explain the NIR PL in Bismuth-doped aluminosilicate glass. First, the system is even electron and, second, Bi+ ion and defect do not form a single center (molecule) preserving their individual properties. In our opinion, the most probable route of the formation of optically active defect is the transfer of two electrons from the oxygen vacancy to Bi3+ ion, thus forming a positively charged oxygen vacancy V, responsible for the NIR PL, and Bi+ ion in its environment. This can explain the low values of -factors in GS and ES’s of the NIR active center.
In conclusion, MCD was investigated in Bismuth-doped MgO-Al2O3-SiO2 glass for the first time. It was shown that Bismuth-doped aluminosilicate glass contains at least three distinct centers. Two centers were identified as Bi+ ion and associated defect that exchange their excitation via ET. The experiments indicate that the defect is an even-electron (or rather even-hole) system with magnetic multiplet in its GS and first ES, most probably positively charged oxygen vacancy V in the glass network . Finally, we identify the third center, which was observed only in MCD spectra, as clusters of Bismuth ions that lead to the quenching of lasing at increasing the concentration of Bismuth.
Funding
O.V.L. and I.M.R. were supported by “Agence Nationale de la Recherche” via ANR grant “BOATS” 12BS04-0019-01,
and “Fonds Européen de Développement Economique des Régions”(FEDER) through the “Contrat de
Projets Etat Région (CPER) 2007-2013”.
B.I.D., B.I.G. and S.E.S. were supported by RFBR (grant 14-02-00296-a) and Russian Academy of Sciences (Presidium program P1).
References
References
- (1) I. A. Bufetov and E. M. Dianov, “Bi-doped fiber lasers,”Laser Phys. Lett. 6, 487–504 (2009).
- (2) K. Murata, Y. Fujimoto, T. Kanabe, H. Fujita, and M. Nakatsuka, “Bi-doped SiO2 as a new laser material for an intense laser,”
- (3) Y. Fujimoto and M. Nakatsuka, “Infrared luminescence from Bismuth-doped silica glass,”Jpn. J. Appl. Phys. 40, L279 – L281 (2001).
- (4) M. Peng, G. Dong, L. Wondraczek, L. Zhang, N. Zhang, and J. Qiu, “Discussion on the origin of NIR emission from Bi-doped materials,”J. Non-Cryst. Solids 357, 2241–2245 (2011).
- (5) E. M. Dianov, “Bismuth-doped optical fibers: a challenging active medium for near-IR lasers and optical amplifiers,”Light: Science & Applications 1, 1–7 (2012).
- (6) O. Laguta, H. El Hamzaoui, M. Bouazaoui, V. B. Arion, and I. Razdobreev, “Magnetic circular polarization of luminescence in bismuth-doped silica glass,”Optica, 2, 663 (2015).
- (7) P. J. Stephens, “Magnetic Circular Dichroism,”Annu. Rev. Phys. Chem. 25, 201–232 (1974).
- (8) J. P. Riehl and F. S. Richardson, “General theory of circularly polarized emission and magnetic circularly polarized emission from molecular systems,”J. Chem. Phys. 65, 1011–1021 (1976).
- (9) O. Laguta, B. Denker, B. Galagan, S. Sverchkov, I. Razdobreev, “Magnetic optical activity in Bi-doped Mg-Al-Si glass,”Presented at the International Conference on Advanced Laser Technologies, Faro, Portugal, 7 - 11 September 2015.
- (10) B. Denker, B. Galagan, V. Osiko, I. Shulman, S. Sverchkov, and E. Dianov, “Absorption and emission properties of Bi-doped Mg–Al–Si oxide glass system,”Appl. Phys. B 49, 801–805 (2009).
- (11) W. R. Mason, A practical guide to magnetic circular dichroism spectroscopy (Wiley, 2007).
- (12) O. Laguta, H. El Hamzaoui, M. Bouazaoui, V. B. Arion, and I. Razdobreev, “Anti-Stokes photoluminescence in Ga/Bi co-doped sol-gel silica glass,”Opt. Lett. 40, 1591–1594 (2015).
- (13) S. Zhou, N. Jiang, B. Zhu, H. Yang, S. Ye, G. Laksshminaranayana, J. Hao, and J. Qiu, J. “Multifunctional Bismuth-doped nanoporous silica glass: From blue-green, orange, red, and white light sources to ultra-broadband infrared amplifiers,”Adv. Func. Mater. 18, 1407–1413 (2008).
- (14) H. L. Davis, N. J. Bjerrum, and G. P. Smith, “Ligand field theory of p2,4 configurations and its application to the spectrum of Bi+ in molten salt media,”Inorg. Chem. 6, 1172–1178 (1967).
- (15) R. H. Bartram, M. Fockele, F. Lohse, and J.-M. Spaeth, “Crystal-field model of the Pb0(2) centre in SrF2,”J. Phys: Condens. Matter, 1989, 1, 27–34 (1989).
- (16) I. Razdobreev, H. El Hamzaoui, V. B. Arion, and M. Bouazaoui, “Photoluminescence in Ga/Bi co-doped silica glass,”Opt. Express 22, 5659–5674 (2014).
- (17) E. I. Solomon, E. G. Pavel, K. E. Loeb, and C. Campochiaro, “Magnetic circular dichroism spectroscopy as a probe of the geometric and electronic structure of non-heme ferrous enzymes,”Coordin. Chem. Rev. 144, 369–460 (1995).
- (18) M. P. Kalita, S. Yoo, and J. Sahu, “Bismuth doped fiber laser and study of unsaturable loss and pump induced absorption in laser performance,”Opt. Express 16, 21032–21038 (2008).
- (19) M. Y. Sharonov, A. B. Bykov, V. Petricevic, and R. R. Alfano, “Spectroscopic study of optical centers formed in Bi-, Pb-, Sb-, Sn-, Te-, and In-doped germanate glasses,”Opt. Lett. 33, 2131–2133 (2008).
- (20) M. Y. Sharonov, A. B. Bykov, R. R. Alfano, “Excitation relaxation pathways in p-element (Bi, Pb, Sb and Sn)-doped germanate glasses,”JOSA B 26, 1435–1441 (2009).
- (21) E. M. Dianov, “Nature of Bi-related near IR active centers in glasses: state of the art and first reliable results,”Laser Phys. Lett. 12, 095106 (2015).
- (22) V. O. Sokolov, V. G. Plotnichenko, and E. M. Dianov, “Origin of near-IR luminescence in Bi2O3 - GeO2 and Bi2O3 - SiO2 glasses: first-principle study,”Opt. Mater. Express, 5, 163–168 (2015).