Strong anisotropy in nearly ideal-tetrahedral superconducting FeS single crystals
Abstract
We report the novel preparation of single crystals of tetragonal iron sulfide, FeS, which exhibits a nearly ideal tetrahedral geometry with S–Fe–S bond angles of 110.2(2) ∘ and 108.1(2) ∘. Grown via hydrothermal de-intercalation of KxFe2-yS2 crystals under basic and reducing conditions, the silver, plate-like crystals of FeS remain stable up to 200 ∘C under air and 250 ∘C under inert conditions, even though the mineral “mackinawite” (FeS) is known to be metastable. FeS single crystals exhibit a superconducting state below K as determined by electrical resistivity, magnetic susceptibility, and heat capacity measurements, confirming the presence of a bulk superconducting state. Normal state measurements yield an electronic specific heat of 5 mJ/mol-K2, and paramagnetic, metallic behavior with a low residual resistivity of 250 cm. Magnetoresistance measurements performed as a function of magnetic field angle tilted toward both transverse and longitudinal orientations with respect to the applied current reveal remarkable two-dimensional behavior. This is paralleled in the superconducting state, which exhibits the largest known upper critical field anisotropy of all iron-based superconductors, with (2.75 T)/(0.275 T)=10. Comparisons to theoretical models for 2D and anisotropic-3D superconductors, however, suggest that FeS is the latter case with a large effective mass anisotropy. We place FeS in context to other closely related iron-based superconductors and discuss the role of structural parameters such as anion height on superconductivity.
I Introduction
While the field of iron-based superconductors has focused primarily on selenides, tellurides, and arsenides,Paglione and Greene (2010); Johnston (2010); Ivanovskii (2011) recent developments show that sulfides are a possible new avenue for high- superconductors. The first iron-sulfide superconductor, BaFe2S3, has been reported to have a superconducting critical temperature () = 14 K at 11 GPa.Takahashi et al. (2015) An even simpler sulfide, H2S, under high pressure (90 GPa), has been found to exhibit superconductivity as high as 203 K, which is the highest reported thus far.Drozdov et al. (2015) Sulfides in general therefore merit closer inspection for exploring high temperature superconductivity, and iron sulfides in particular could point the way towards new superconducting compounds.
Recently, Lai et al. found that the simple binary compound, FeS, in its tetragonal polymorph known as mackinawite is a superconductor with a K.Lai et al. (2015) Similar to the superconducting -form of iron selenide, mackinawite also adopts the anti-PbO structure where FeS4 tetrahedra edge-share to form two-dimensional (2D) layers (Figure 1b inset).Kouvo et al. (1963); Bertaut et al. (1965); Evans Jr et al. (1964) Unlike its heavier analogues, FeSe and FeTe, however, mackinawite is metastable and therefore cannot be synthesized from their respective elements using solid state methods, unless it is alloyed with significant amounts of Co, Ni or Cu.Lennie et al. (1995); Rickard and Luther (2007) Due to the thermodynamic limitations in its preparation, single crystal growth of mackinawite is a challenge. Growing single crystals of FeS is imperative, however, towards understanding its true physical properties.
Before the report by Lai et al. on superconductivity, several studies had found FeS to be a ferrimagnetic semiconductor. Denholme et al. (2014); Sines et al. (2012) The conflicting reports on the properties of polycrystalline FeS by different groups may be due to impurities not observed through powder X-ray diffraction, especially since iron provides a high background from fluorescence with Cu K- radiation. Powder FeS samples prepared through aqueous methods may form small crystallites as indicated by the broad Bragg reflections in the diffraction patterns of past studies.Dutta et al. (2012) The small particle size and polycrystalline nature of these samples impede accurate electrical resistivity and magnetization measurements due to grain boundary effects and the facile oxidation of surfaces of small particles.Denholme et al. (2014); Bertaut et al. (1965) Despite their ground-breaking work on polycrystalline FeS, Lai et al. also called for high quality single crystal data for definitive determination of the physical properties of FeS.
We report a method for the preparation of high quality single crystals of mackinawite FeS. Since FeS is metastable,Lennie et al. (1995); Csakberenyi-Malasics et al. (2012) single crystal growth through slow cooling of a melt is not possible. In the case of FeSe1-yTeyBao et al. (2009); Liu et al. (2010); Bhatia et al. (2011) and Fe1+xTe,Rodriguez et al. (2011); Stock et al. (2011) large single crystals were grown through Bridgeman techniques allowing detailed transport and spectroscopic experiments. For FeSe, which has limited window of phase stability, chemical vapor transport methods at elevated temperatures is the only technique that has been reported.Hara et al. (2010); Böhmer et al. (2015) We present a general technique for the de-intercalation of the ternary phase KxFe2-yS2 Figure 1a inset), which melts congruently and can therefore be prepared in single crystal form.Hu et al. (2011); Luo et al. (2011) We link how studying the materials chemistry of layered iron sulfides is key to discovering the underlying physics in new superconductors such as mackinawite FeS.
II Experimental
II.1 Hydrothermal synthesis of FeS single crystals
In this work, superconducting FeS single crystals were prepared by de-intercalation of potassium cations from KxFe2-yS2 (, ) single crystals under hydrothermal condition. The growth of KxFe2-yS2 single crystals was modified by the method described by Lei et al. Lei et al. (2011) For a typical reaction, 1.00 g (11.4 mmol) of hexagonal FeS powder (Alfa Aesar, 99.9%) was mixed with 0.18 g (4.5 mmol) of potassium metal (Alfa Aesar, 99%) to match the nominal composition of K0.8Fe2S2. The mixture was loaded in a quartz ampoule inside an argon-filled glovebox, and the ampoule was flame sealed under vacuum (10-3 Torr). In order to avoid oxidation of the sample due to the potassium-induced corrosion of quartz, the sample containing ampoule was sealed in a larger ampoule under vacuum (10-3 Torr).
For crystal growth of KxFe2-yS2, the mixture was heated to 1000 ∘C over 10 hours and held at 1000 ∘C for 3 hours to form a homogeneous melt. Subsequently, the melt was slowly cooled at a rate of 6 ∘C/hour to 650 ∘C to allow crystal growth. After cooling to room temperature, KxFe2-yS2 single crystals approximately 3 mm – 8 mm in diameter and approximately 0.1 mm in thickness were recovered.
For the preparation of FeS single crystals, the KxFe2-yS2 precursor (0.2 g - 0.4 g), 0.28 g (5 mmol) Fe powder (Alfa Aesar, 99.9%), 0.84 g (5 mmol) Na2S H2O (dried from Na2S H2O, Sigma-Aldrich, 98%) and 0.20 g (5 mmol) NaOH (Sigma-Aldrich, 98%) were added to 10 mL water. The mixture was placed in a Teflon-lined stainless steel autoclave at 120 ∘C for 3-4 days. Silver colored FeS single crystals were recovered by washing away excess powder with water and drying under vacuum overnight. Samples prepared in the absence of excess iron powder were not superconducting, which could be due to either oxidation of the iron or vacancy formation in the FeS layer. In the crystallographic studies of layered iron selenide analogues such as FeSeMcQueen et al. (2009) and (LixFe1-xOH)FeSe,Sun et al. (2015) iron vacancy formation is implicated in the loss of superconducting properties.
II.2 X-ray diffraction and thermal stability analysis
Initial powder X-ray diffraction (XRD) data were collected using a Bruker D8 X-ray diffractometer with Cu K radiation, = 1.5418 Å (step size = 0.025∘, with 2 ranging from 7∘ - 90∘). Temperature dependent X-ray diffraction on ground single crystals was performed using a Bruker C2 diffractometer with a Vantec500 2D detector, = 1.5418 Å (step size = 0.05∘, with 2 ranging from 11∘ - 80∘). The sample was heated using an Anton Paar DHS 1100 graphite-dome hot stage. Rietveld refinements were carried out using TOPAS software.
Differential scanning calorimetry (DSC) was conducted on a Mettler-Toledo TGA/DSC 3+ thermogravimetric analyzer with high temperature furnace. Samples were heated from room temperature to 800 ∘C.
II.3 Magnetic susceptibility, electrical transport and heat capacity
Magnetic susceptibility measurements were performed using a Quantum Design Magnetic Properties Measurement System (MPMS). Both field-cooled (FC) and zero field-cooled (ZFC) measurements were taken from 2 K to 300 K in direct current mode with an applied magnetic field of 10 Oe – 30 Oe. Hysteresis measurements were carried out at 2 K with 7 T. Magnetic susceptibility measurements under hydrostatic pressure were performed using a BeCu piston-cylinder clamp cell employing n-pentane:isoamyl alcohol as a pressure-transmitting medium. Pressures produced on the single crystal sample at low temperatures were calibrated by measuring the Meissner effect of a small piece of Pb, placed in the pressure cell. The known pressure dependences of the superconducting transition temperature of Pb Smith and Chu (1967) were used for this purpose.
Electrical transport measurements were performed on a 14 T Quantum Design Dynacool Physical Properties Measurement System (PPMS). Single crystal samples were mounted on a rotator AC transport sample board and measured using the electrical transport option, applying currents between 0.1-0.5 mA and frequencies near 10 Hz.
Heat capacity measurements were performed in a 14 T Quantum Design Dynacool PPMS System. The single-crystal sample of mass 2.9 mg was measured using the relaxation method with field applied perpendicular to the basal plane.
III Results: Synthesis, thermal stability and structural characterization
III.1 Single crystal preparation by reductive de-intercalation
Our strategy for preparing single crystals of a metastable phase can be summarized as crystal-to-crystal conversion from a thermodynamically stable phase. During the preparation of our FeS samples, we found that maintaining a reducing and basic hydrothermal environment was crucial to observing superconductivity in FeS. The de-intercalation of potassium cations from KxFe2-yS2 resulted in the shift of alternating planes of FeS along the direction of the unit cell to form the primitive layered FeS (Figure 1). Note that Lei et al. had found KxFe2-yS2 to be non-superconducting,Lei et al. (2011) so our reductive de-intercalation technique tunes this spin glassy material into a superconductor.
A similar structural transformation from a body-centered tetragonal structure to a primitive tetragonal structure has also been previously observed in the selenide analogue, KxFe2-ySe2.Shoemaker et al. (2012) When exposed to air or moisture, oxidation of iron and formation of iron vacancies was suggested to be the driving force for the structural transition. After the structural change induced by oxidation in water, the superconducting KxFe2-ySe2 became non-superconducting.Shoemaker et al. (2012) In contrast, our reductive de-intercalation was driven by preference of potassium cations to solvate into solution under strongly basic conditions, which consequently alters the non-superconducting KxFe2-yS2, Figure S1 in Supplementary Materials (SM), into superconducting FeS. Also, the reducing environment in the autoclave maintained by the presence of Fe metal as a reagent prevented oxidation of Fe2+ to Fe3+ or the formation of iron vacancies.
A more drastic structural change could be possible under stronger oxidizing conditions. Neilson and McQueenNeilson and McQueen (2012) reported that KNi2Se2, a Ni analogue of the KxFe2-ySe2, forms hexagonal NiAs-type, K1-yFe2-zSe2, by oxidative de-intercalation of K+ by CuI2 in acetonitrile. This caused a complete structural reconstruction from edge-sharing layered NiSe4 tetrahedra to corner-sharing NiSe6 octahedra. Such a reconstruction was not seen in our de-intercalation reaction of KxFe2-yS2 since we did not utilize strong oxidizing environment but rather maintained reducing conditions. We similarly found this strategy in achieving the highest ’s for the (Li1-xFexOH)FeSe and (Li1-xFexOD)FeSe single crystals in their single crystal-to-single crystal conversion also utilizing KxFe2-ySe2 as the template.Zhou et al. A similar method was used for ion exchange in the single-crystal conversion of the selenide analogues KxFe2-ySe2 to (LixFe1-xOH)FeSe,Dong et al. (2015) which demonstrates how powerful this technique is for exploring new layered iron chalcogenides.
III.2 X-ray diffraction and crystal structure
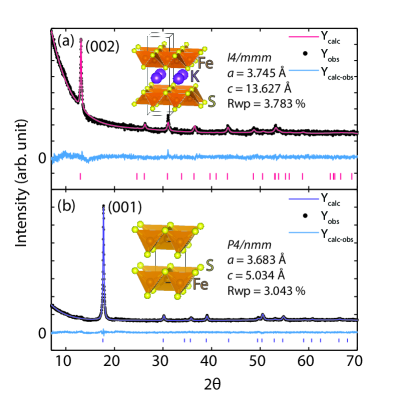
The XRD powder pattern of ground single crystals of KxFe2-yS2, presented in Figure 1a, shows pure crystalline product before the de-intercalation reactions. The pattern for KxFe2-yS2 was fit with a body-centered tetragonal structural model with space group and lattice parameters = 3.745(1) Å and = 13.627(9) Å (Table 1, Figure 1). Full structural parameters from the fits are presented in Table 1 and are in good agreement with those presented in an earlier study.Lei et al. (2011) Recently, Pachmayer et al. found that FeS powders prepared by hydrothermal methods remain tetragonal down to low temperatures;Pachmayr et al. (2016) while the heavier congeners, FeSeMcQueen et al. (2009); Margadonna et al. (2009); Böhmer et al. (2015) and FeTe,Rodriguez et al. (2011, 2013) are known to have a crystallographic phase transitions.
After hydrothermal de-intercalation of potassium cations, the XRD pattern of the newly formed superconducting FeS crystals were fit to a primitive unit cell with space group and lattice parameters = 3.6286(5) Å and = 5.03440(9) Å. These values were consistent with values previously reported for tetragonal FeS.Lennie et al. (1995); Lai et al. (2015); Denholme et al. (2014) Due to the layered nature of the samples, the XRD powder patterns for KxFe2-yS2 and FeS were refined with preferred orientation along the [002] and [001] directions, respectively. Table 1 presents the parameters of our structural refinements for ground single crystals of KxFe2-yS2 and FeS as well as the powder samples of FeS prepared as a side reaction during the single-crystal-to-single-crystal conversion. This powder consisted primarily of the product from the reaction of the iron powder in the presence of sodium sulfide and NaOH during the hydrothermal preparation (Figure S2 in SM). For comparison, we have also prepared a powder sample of FeS through a modified method employed by Lai et al.,Lai et al. (2015) and the results from our diffraction measurements of a powder sample with K are presented in the SM (Figures S3–S5 and Table S1 in SM).
| FeS (298 K, ground single crystal), , | |||||
| (5), (9) | |||||
| atom | Site | x | y | z | (Å2) |
| Fe1 | 2a | 0 | 0 | 0 | 0.016(3) |
| S1 | 2c | 0 | 0.5 | 0.266(2) | 0.029(5) |
| S-Fe-S (∘) | S-Fe-S (∘) | Fe-S (Å) | Fe-Fe (Å) | anion height (Å) | |
| 108.1(2) | 110.2(2) | 2.275(5) | 2.6040(5) | 1.34(1) | |
| FeS (298 K, powder preparation) , , | |||||
| (4), (9) | |||||
| atom | Site | x | y | z | (Å2) |
| Fe1 | 2a | 0 | 0 | 0 | 0.034(3) |
| S1 | 2c | 0 | 0.5 | 0.253(2) | 0.033(4) |
| S-Fe-S (∘) | S-Fe-S (∘) | Fe-S (Å) | Fe-Fe (Å) | anion height (Å) | |
| 110.7(4) | 108.9(2) | 2.239(5) | 2.6051(4) | 1.27(1) | |
| KxFe2-yS2 (298 K, single crystal) , , | |||||
| (1), (9) | |||||
| atom | Site | x | y | z | Å2 |
| K1 | 2a | 0 | 0 | 0 | 0.006(2) |
| Fe1 | 4d | 0 | 0.5 | 0.25 | 0.019(7) |
| S1 | 4e | 0 | 0 | 0.352(2) | 0.006(8) |
| S-Fe-S (∘) | S-Fe-S (∘) | Fe-S (Å) | Fe-Fe (Å) | anion height (Å) | |
| 110.8(3) | 106.8(3) | 2.33(2) | 2.6481(6) | 1.39(3) | |
III.3 Thermal stability of FeS single crystals
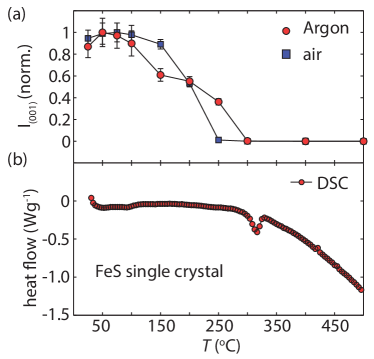
To test the thermal stability of our new FeS single crystals, samples were heated under inert Argon atmosphere in steps ranging from 25 ∘C, 50 ∘C, and 100 ∘C. The 001 peak is visible up to 250 ∘C (Figure S6 in SM), and its integrated intensity versus temperature under an Argon atmosphere is presented in Figure 2a along with a plot of the DSC. The decomposition of mackinawite FeS as determined by the integrated intensity of the (001) peak begin above 100 ∘C and disappeared completely above 250 ∘C. Due to the geometry of the XRD experiment, the (00) reflections in the single crystal sample were observed while other reflections were not. Therefore, it is likely that if greigite were to form above = 100 ∘C, it would not have been detected in our experiment.
DSC measurements of FeS in Argon up to 600 ∘C, shown in Figure 2b, give some clues on the thermal behavior during the decomposition of mackinawite. The dip in the heat flow around 300 ∘C indicates an endothermic reaction that could be associated with the crystallization of a phase such as pyrrhotite not seen in our temperature dependent diffraction studies. The appearance of this transition in the DSC after the disappearance of the (001) reflection in the XRD, indicates that the two are related. XRD analysis on the residue from the DSC experiment indicated formation of hexagonal pyrrhotite (Figure S7 in SM). The higher than expected thermal stability of the mackinawite compared to past studies could be due to the single crystalline nature of our samples, which have larger surface areas and are therefore less reactive than a polycrystalline product with small particle sizes.
From their high-resolution X-ray diffraction study, Lennie et al. reported that mackinawite begins to decompose to greigite (Fe3S4) above 100 ∘C and that all FeS reflections disappear above = 200 ∘C under a He atmosphere.Lennie et al. (1997) Above 260 ∘C, greigite decomposes and hexagonal pyrrhotite begins to emerge.Lennie et al. (1997)
Lennie et al. also reported that mackinawite-FeS rapidly oxidizes under air.Lennie et al. (1995). To test the air stability of our single crystals, we heated samples under ambient atmosphere in steps ranging from 25 ∘C, 50 ∘C, and 100 ∘C. As presented in Fig 2b, the (001) peak is visible up to 200 ∘C. As this level of air stability has not been reported for mackinawite before, it could imply that there may be some alkali metal incorporation that could passivate the surface and prevent oxidation of FeS. EDS mapping on the surface of FeS single crystals shows up to 9% total alkali (K and Na) on the surface of the FeS crystals (Figure S8 in SM). Due to the similarity of the -parameter to those previously reported FeS, it is unlikely that large cations such as sodium or potassium intercalate between layers.
IV Results: Physical properties
IV.1 Magnetic susceptibility
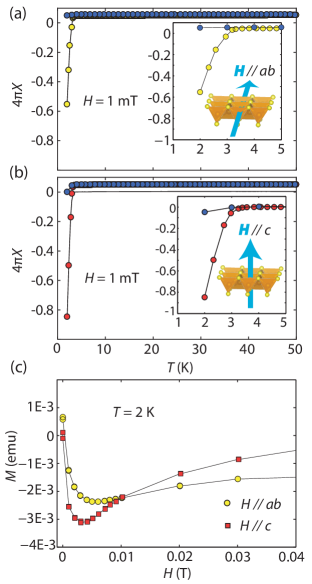
The temperature-dependent FC and ZFC magnetic susceptibilities of FeS crystals measured in a constant field of 1 mT are presented in Figure 3, for fields applied both parallel and perpendicular to the crystallographic -axis. The volume susceptibility under ZFC conditions exhibits an onset superconducting transition at K and a shielding fraction of 60-90% (without geometric factors taken into account). The significant superconducting volume fractions indicate that FeS is a bulk superconductor. In both cases of the field orientation, the ZFC and FC curves in the normal state above are largely temperature independent, indicative of Pauli paramagnetism and therefore metallicity in FeS.
Figure 3c presents magnetization () as a function of applied field () along two different directions for the applied field. The isotherms indicate the values of the lower critical field to be 4 mT and 5 mT at 1.8 K for and , respectively. One difference between our single crystal results and those of Lai et al. is the maximum critical temperature observed. Lai et al. reported the superconducting powder samples of FeS to have a = 4.5 K,Lai et al. (2015) which is approximately 1 K greater than found for our single crystals. Magnetic susceptibility of our own prepared powder samples show = 4 K (Figures S4 and S5 in SM).
IV.2 Heat capacity
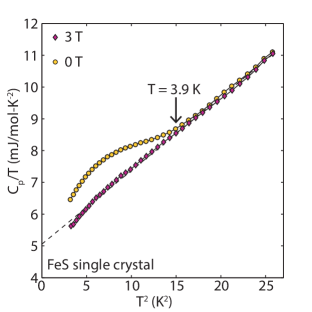
Heat capacity was measured on a large single crystal in both the superconducting (0 T) and normal (3 T) states. As shown in Figure 4, a 3 T field is large enough to suppress the superconducting state in the crystal, making for a good comparison with the 0 T curve.
In zero applied field, a clear signature of the superconducting transition develops at =3.9 K, consistent with magnetic susceptibility and resistivity (below) measurements, confirming bulk superconductivity in single crystal FeS. Fitting the 3 T data to a standard electron and phonon contribution specific heat model, , yields a normal state Sommerfield coefficient to be =5.1 mJ/mol-K2 and phonon term =0.23 mJ/mol-K4, the latter corresponding to a Debye temperature = 257 K. Unlike reports for FeSe where the specific heat was fit to , McQueen et al. (2009), for FeS a plot for vs is linear in the normal state. FeS does share some similarities with FeSe, however, as was estimated to be 5.4(3) mJ/mol-K2,McQueen et al. (2009), which is within error to the value we found for in FeS.
IV.3 Magnetoelectric transport
Temperature dependent electrical resistivity of single-crystal FeS is presented in Figure 5a. The resistivity exhibits metallic character down to the superconducting state with = 3.5 K and = 2.4 K. The residual resistivity of FeS was determined to be cm based on an average of the values measured for several samples (Figure S9 in SM), all of which exhibit a room temperature to residual resistivity ratio (RRR) of approximately 10, indicative of the high quality of our crystalline samples and the low uncertainty in geometric factors that may vary widely due to the micaceous nature of the crystals.
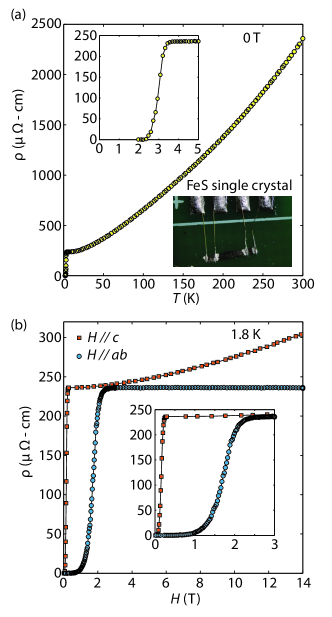
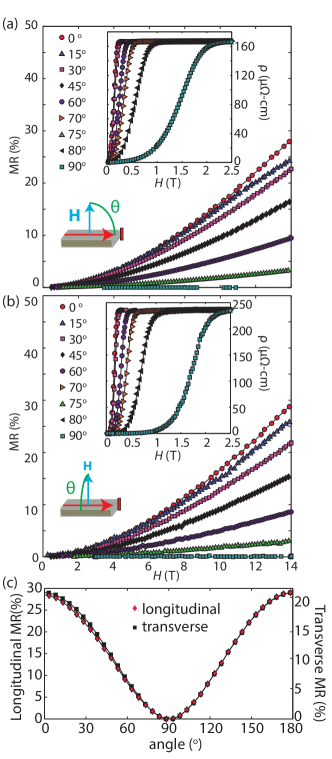
Figure 5b presents the normalized magnetoresistance (MR) as a function of applied magnetic field at 1.8 K. As shown, a significant anisotropy appears in both the normal state high-field MR as well as the transition, with the latter ranging from 0.16 T for to 1.6 T for . The full angular dependence of these features are presented in Figure 6. Panels (a) and (b) present the angular variation of MR for both longitudinal () and transverse () orientations, respectively. Indeed, as shown in Figure 6c, the MR angular variation is well represented by a cosine-like dependence for both longitudinal and transverse orientation angles.
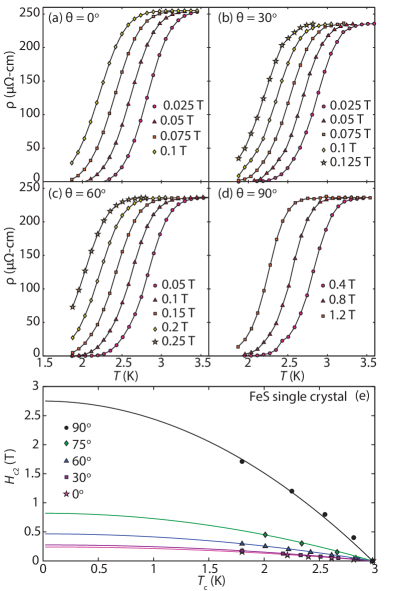
A very large anisotropy is also evident in the upper critical field as the field angle is rotated away from the -axis. In both longitudinal and transverse orientations, is observed to diminish strongly as the field rotates toward the basal plane, as shown in the insets of Figure 6a-b. Taking the two extremes, one can define an anisotropy , which is a value of 10 at 1.8 K. A more complete evaluation of the full dependence allows for an extrapolation of to zero temperature. As shown in Figure 7a-d, extracting the values from the resistive transitions at several angles (all transverse to current direction, with values chosen at the 50% resistance midpoint) leads to a full plot given in Figure 7e. For all field directions, Hc2(0) was estimated using the Werthamer-Helfand-Hohenberg (WHH) formula ().Werthamer et al. (1966) Fitting results give = 2.75 T and T, yielding nearly the same anisotropy value =10 as for 1.8 K. The coherence lengths calculated from the estimated values ( where is the flux quantum) are calculated to be = 343 Å and = 104 Å.
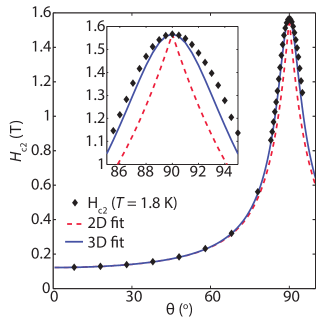
These large changes in with field angle and the concomitant coherence length anisotropy are in line with the strong anisotropy observed in the normal state MR as discussed above. To determine whether the large anisotropy is indicative of a truly two-dimensional and not a strongly anisotropic three-dimensional superconducting system, we performed detailed measurements of the angular dependence of at 1.8 K. Figure 8 presents the angle dependence of (1.8 K) as determined from midpoints of field sweep resistive transitions. (Using different criterion to define results in slight variation in absolute anisotropy, but the shape of the curve remains constant). The shape of the curve, especially near the () orientation, is indicative of the true dimensionality of the superconductor with respect to the coherence length. Tinkham’s model for thin-film superconductors incorporates the effect of reduced dimensionality, Tinkham (1963) yielding an angular dependence given by
| (1) |
whereas Ginzburg Landau (GL) theory Ketterson and Song (1999) can be used to determine the effect of an anisotropic effective mass on the angular dependence as
| (2) |
As shown in the inset of Figure 8, the data is much better represented by the anisotropic GL theory, suggesting a highly anisotropic 3D environment for the superconductivity in FeS. This can be quantified by using the calculated anisotropy for this sample to extract the effective mass ratio ==164. This is believed to be the largest upper critical field anisotropy observed in any Fe based superconductor reported so far.
V Discussion
V.1 Strongly anisotropic electronic properties
The previous report for powder samples of FeS found to be 0.4 T,Lai et al. (2015) which is much lower than that of FeSe and other iron-based superconductors. for FeSe has been reported to be 16.3 T in powder samples.Hsu et al. (2008) This difference between the upper critical fields in FeSe and FeS has significant effects on their coherence lengths as well. Coherence lengths calculated from for FeS powdersLai et al. (2015) and FeSe powdersHsu et al. (2008) are 287 Å and 45.0 Å, respectively. We confirm Lai’s report of a much lower and higher coherence length in FeS compared to other iron-based superconductors, but also demonstrate that these properties are highly anisotropic.
As important as the comparatively smaller critical fields in FeS, the anisotropy also appears to be much larger in this system. We find an anisotropy ratio of , and to our knowledge this is the largest reported yet for an iron-based superconductor. For FeTe1-ySy single crystals, the field dependence on is mostly isotropic with a reported = 18 T / 19 T = 0.95.Hu et al. (2009). Recent studies on Fe(Se1-xSx) single crystals has shown sulfur to increase from 8.5 K for = 0 to 10.7 K for = 0.11, and the anisotropy is also more pronounced in crystals with higher sulfur content as for and 3.5 for .Abdel-Hafiez et al. (2015)
Surprisingly, in our studies of angular dependence of MR, both longitudinal and transverse rotation studies show a diminishment of MR as the field is rotated toward the crystallographic basal plane, irrespective of whether the field direction is rotated parallel or perpendicular to the current direction (Figure 6a,b). This is consistent with either a projection-like orbital MR of a very thin specimen (i.e., with a large MR when is perpendicular to the plane where orbital motion is allowed and zero MR when orbital motion of charge carriers is prohibited by geometric confinement), or with a very strong electronic anisotropy as found in other materials with reduced electronic dimensionality.
Given the micaceous nature of FeS single crystals, the anisotropic behavior of the MR may arise due to a microscopic physical separation of crystalline layers resulting in effectively two-dimensional layers that would act much as in a thin film. Such a description of our sample’s behavior would imply that it contains a slab thickness that is less than the characteristic magnetic length scale. Our studies of anisotropy and its angular variation (Figure 8) suggest that the measured superconducting state of FeS is in fact inhabiting a three-dimensional environment with strong anisotropy, given the lack of a cusp in near the field alignment (Figure 8). The result for our case is in good agreement with GL theory. Therefore, the appropriate length scale to consider is the superconducting coherence length which is 104 Å for . In other words, our single-crystal samples must entail crystalline slabs of at least 104 Å thickness in order to exhibit the GL-type behavior of that follows from Eq. 2. An estimate of the mean free path of quasiparticles Millis et al. (1988) yields Å, which is much smaller than 104 Å, suggesting the scattering length is at least much smaller than the known slab thickness. At the very least, the fact that the effective thickness must be at least 20 unit cells suggests quasiparticles are not artificially confined, and that the the observed two-dimensional behavior in MR may be intrinsic to the electronic structure.
V.2 True ground and normal state properties of FeS
The tetragonal FeS system was originally predicted to be semiconductor in nature by Bertaut et al.Bertaut et al. (1965) This claim was recently supported by resistivity measurements performed by Denholme et al.Denholme et al. (2014), which showed that their samples were non-superconducting with ferrimagnetic-like behavior. Similarly, samples prepared by Sines et al.Sines et al. (2012) were also exhibited semiconducting and ferrimagnetic behavior. Contrary to experimental evidence published before the work of Lai et al.,Lai et al. (2015) several other groups had predicted tetragonal FeS to be metallic.Vaughan and Ridout (1971); Subedi et al. (2008); Kwon et al. (2011); Devey et al. (2008); Brgoch and Miller (2012) Vaughan and RidoutVaughan and Ridout (1971) proposed that the bonding in the tetragonal FeS was metallic in nature due to delocalized d electrons in iron sublattice. Recent density functional theory (DFT) calculations also supported metallicity, in tetragonal FeS.Subedi et al. (2008); Kwon et al. (2011); Devey et al. (2008)
Geochemists studying mackinawite have suggested that the ferrimagnetic-like behavior from earlier magnetization data might have risen from the well-known thiospinel ferrimagnetic impurity, Fe3S4, considering the ease of conversion of mackinawite FeS to Fe3S4.Lennie et al. (1995); Csakberenyi-Malasics et al. (2012) Several of our powder FeS samples prepared through the synthesis detailed by Lennie et al.Lennie et al. (1995) form with an Fe3S4 impurity as revealed by combined magnetization measurements and neutron powder diffraction (Figures S10-12 in SM). Even Denholme et al. acknowledged that the semiconductor behavior of FeS could be attributed to the surface oxide layers of FeS, as suggested by Bertaut et al. Denholme et al. (2014); Bertaut et al. (1965) Indeed, similar oxidation has been observed in the FeSe system, as Greenfield et al.Greenfield et al. (2015) reported that amorphous surface oxide layers of FeSe particles suppressed the superconductivity in FeSe. Our single crystal results definitively support a metallicity in the normal state properties and superconductivity in the ground state.
V.3 Structural trends concerning
Compared to tetragonal FeSe, mackinawite FeS contains more regular tetrahedral –Fe– bond angles where chalcogenide. In FeSe, the Se–Fe–Se out-of-plane bond angle is 112.32(6)∘ and the Se–Fe–Se in-plane bond angle is 103.91(7)∘.McQueen et al. (2009) The respective bond angles for our FeS powder and single crystal samples were calculated to be close to 108.1(3)∘ and 110.2(2)∘ (Table 1). Several studies have suggested that higher could be achieved from more regular bond angles,Denholme et al. (2014) as is with iron pnictide superconductors.Lee et al. (2012); Mizuguchi et al. (2010) However, this structural parameter does not seem to be as important an indicator in the iron chalcogenides since FeSe exhibits a higher (8 K) than FeS ( = 4 K) even though it is comprised of more distorted tetrahedra. This suggests that structural factors controlling in iron pnictides may not be identical to those of the iron chalcogenides.
Anion height has also been implicated as a reliable predictor for in iron-based superconductors.Mizuguchi et al. (2010) For iron pnictides, increases with increasing anion height as FeP-based superconductors have lower anion height and lower than FeAs-based superconductors. However, begins to drop off for anion heights greater than 1.38 Å, which suggests there is an optimal anion height for maximizing . For FeSe with = 8 K, the Se height is 1.45 Å, and upon application of physical pressure, the Se height decreases to 1.425 Å, which leads to an increase in up to 37 K (8 GPa).Imai et al. (2009); Mizuguchi et al. (2010) For larger anions, i.e. FeTe, the anion height is larger than that of FeSe and while FeTe is not superconducting at ambient pressure isovalent anionic substitution as in FeTe0.8S0.2 induces superconductivity (anion height = 1.75 Å, = 10 K).Mizuguchi et al. (2009); Zajdel et al. (2010) From this anion height principle, we should expect the smaller anionic radius of sulfide to lead to a larger . However, the anion height in FeS was found in the range from 1.27(1) to 1.34(1) Å (Table 1), which is below the optimal height of 1.38 Å. This result for FeS could therefore explain why the is remains low and between 3.5 and 5 K despite having more regular tetrahedra than FeSe or FeTe.
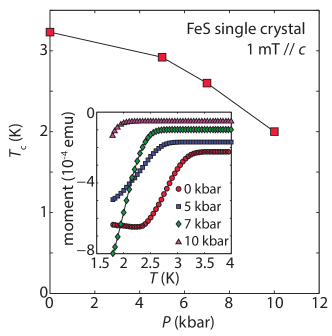
As a preliminary study on modifying the anion height in FeS to affect , we have performed magnetization measurements as a function applied pressure. As shown in Figure 9, measurements of magnetic susceptibility in a clamp-cell setup show that the transition temperature decreases with increasing pressure, at least up to 10 kbar. While it is known that in the related superconductor FeSe undergoes a dramatic enhancement under pressure, the increase in for FeSe occurs at much higher pressures than currently reached in the present experiment for FeS (on the order of 10 GPa). Further work to study the relation between and the crystallographic parameters as a function of applied pressure will shed more light on the relation between structure and superconductivity in FeS.
VI Conclusions
In conclusion, we have synthesized superconducting single crystals of FeS and characterized their thermal, magnetic, and electrical properties. The synthesis of FeS single crystals was accomplished through the novel method of reductive de-intercalation of KxFe2-yS2 single crystals under hydrothermal conditions. The FeS crystals are stable up to 250 ∘C in argon and 200 ∘C in air. At 4 K the FeS crystals transition from a metallic, Pauli paramagnetic state to the superconducting state. In both the normal state and superconducting states, we observe a large anisotropy in the properties of FeS. The upper critical field expresses a large anisotropy with a , the largest reported for any iron-based superconductor thus far. Magnetoresistance measurements for the normal state performed as a function of applied field angle reveal a remarkable two-dimensional behavior in FeS. Overall, the physical property results indicate that the Fermi surface of FeS may be highly two-dimensional, and perhaps even more so than other closely-related iron-based superconductors. Since the metastable system, mackinawite-type FeS, is now confirmed as a superconductor and not a magnetic semiconductor, this system could be a template for the preparation of new sulfide-based superconductors that exhibit strong anisotropic behavior.
VII Acknowledgements
Research at the University of Maryland was supported by the NSF Career DMR-1455118, AFOSR Grant No. FA9550-14-10332, and the Gordon and Betty Moore Foundation Grant No. GBMF4419. We acknowledge the support of the National Institute of Standards and Technology, U. S. Department of Commerce, in providing the neutron research facilities used in this work.
References
- Paglione and Greene (2010) J. Paglione and R. L. Greene, Nat. Phys., 2010, 6, 645–658.
- Johnston (2010) D. C. Johnston, Adv. Phys., 2010, 59, 803–1061.
- Ivanovskii (2011) A. Ivanovskii, Physica C, 2011, 471, 409–427.
- Takahashi et al. (2015) H. Takahashi, A. Sugimoto, Y. Nambu, T. Yamauchi, Y. Hirata, T. Kawakami, M. Avdeev, K. Matsubayashi, F. Du, C. Kawashima, H. Soeda, S. Nakano, Y. Uwatoko, Y. Ueda, T. J. Sato and K. Ohgushi, Nat. Mater., 2015, 14, 1008–1012.
- Drozdov et al. (2015) A. P. Drozdov, M. I. Eremets, I. A. Troyan, V. Ksenofontov and S. I. Shylin, Nature, 2015, 525, 73–76.
- Lai et al. (2015) X. Lai, H. Zhang, Y. Wang, X. Wang, X. Zhang, J. Lin and F. Huang, J. Amer. Chem. Soc., 2015, 137, 10148–10151.
- Kouvo et al. (1963) O. Kouvo, J. Long and Y. Vuorelainen, Am. Mineral., 1963, 48, 511.
- Bertaut et al. (1965) E. Bertaut, P. Burlet and J. Chappert, Solid State Commun., 1965, 3, 335 – 338.
- Evans Jr et al. (1964) H. T. Evans Jr, C. Milton, E. Chao, I. Adler, C. Mead, B. Ingram and R. A. Berner, US Geol. Survey Prof. Paper, 1964, 475, 1312 – 1318.
- Lennie et al. (1995) A. Lennie, S. Redfern, P. Schofield and D. Vaughan, Mineral. Mag., 1995, 59, 677–684.
- Rickard and Luther (2007) D. Rickard and G. W. Luther, Chem. Rev., 2007, 107, 514–562.
- Denholme et al. (2014) S. Denholme, S. Demura, H. Okazaki, H. Hara, K. Deguchi, M. Fujioka, T. Ozaki, T. Yamaguchi, H. Takeya and Y. Takano, Mater. Chem. Phys., 2014, 147, 50 – 56.
- Sines et al. (2012) I. T. Sines, D. D. Vaughn II, R. Misra, E. J. Popczun and R. E. Schaak, J. Solid State Chem., 2012, 196, 17–20.
- Dutta et al. (2012) A. K. Dutta, S. K. Maji, D. N. Srivastava, A. Mondal, P. Biswas, P. Paul and B. Adhikary, ACS Appl. Mater. & Interfaces, 2012, 4, 1919–1927.
- Lennie et al. (1995) A. R. Lennie, K. E. England and D. J. Vaughan, Am. Mineral., 1995, 80, 960–967.
- Csakberenyi-Malasics et al. (2012) D. Csakberenyi-Malasics, J. D. Rodriguez-Blanco, V. K. Kis, A. Recnik, L. G. Benning and M. Posfai, Chem. Geol., 2012, 294 - 295, 249 – 258.
- Bao et al. (2009) W. Bao, Y. Qui, Q. Huang, M. A. G. a. P. Zajdel, M. R. Fitzsimmons, M. Zhernenkov, S. Chang, M. Fang, B. Qian, E. K. Vehstedt, J. Yang, H. M. Pham, L. Spinu and Z. Q. Mao, Phys. Rev. Lett., 2009, 102, 247001.
- Liu et al. (2010) T. J. Liu, J. Hu, B. Qian, D. Fobes, Z. Q. Mao, W. Bao, M. Reehuis, S. A. J. Kimber, K. Prokes, S. Matas, D. N. Argyriou, A. Hiess, A. Rotaru, H. Pham, L. Spinu, Y. Qiu, V. Thampy, A. T. Savici, J. A. Rodriguez and C. Broholm, Nat. Mater., 2010, 9, 716–720.
- Bhatia et al. (2011) V. Bhatia, E. E. Rodriguez, N. P. Butch, J. Paglione and M. A. Green, Chem. Comm., 2011, 47, 11297.
- Rodriguez et al. (2011) E. E. Rodriguez, C. Stock, P. Zajdel, K. L. Krycka, C. F. Majkrzak, P. Zavalij and M. A. Green, Phys. Rev. B, 2011, 84, 064403.
- Stock et al. (2011) C. Stock, E. E. Rodriguez, M. Green, P. Zavalij and J. Rodriguez-Rivera, Phys. Rev. B, 2011, 84, 045124.
- Hara et al. (2010) Y. Hara, K. Takase, A. Yamasaki, H. Sato, N. Miyakawa, N. Umeyama and S. Ikeda, Physica C, 2010, 470, S313 – S314.
- Böhmer et al. (2015) A. E. Böhmer, T. Arai, F. Hardy, T. Hattori, T. Iye, T. Wolf, H. v. Löhneysen, K. Ishida and C. Meingast, Phys. Rev. Lett., 2015, 114, 027001.
- Hu et al. (2011) R. Hu, K. Cho, H. Kim, H. Hodovanets, W. E. Straszheim, M. A. Tanatar, R. Prozorov, S. L. Bud’ko and P. C. Canfield, Supercond. Sci. Tech., 2011, 24, 065006.
- Luo et al. (2011) X. G. Luo, X. F. Wang, J. J. Ying, Y. J. Yan, Z. Y. Li, M. Zhang, A. F. Wang, P. Cheng, Z. J. Xiang, G. J. Ye, R. H. Liu and X. H. Chen, New J. Phys., 2011, 13, 053011.
- Lei et al. (2011) H. Lei, M. Abeykoon, E. S. Bozin and C. Petrovic, Phys. Rev. B, 2011, 83, 180503.
- McQueen et al. (2009) T. M. McQueen, Q. Huang, V. Ksenofontov, C. Felser, Q. Xu, H. Zandbergen, Y. S. Hor, J. Allred, A. J. Williams, D. Qu, J. Checkelsky, N. P. Ong and R. J. Cava, Phys. Rev. B, 2009, 79, 014522.
- Sun et al. (2015) H. Sun, D. N. Woodruff, S. J. Cassidy, G. M. Allcroft, S. J. Sedlmaier, A. L. Thompson, P. A. Bingham, S. D. Forder, S. Cartenet, N. Mary, S. Ramos, F. R. Foronda, B. H. Williams, X. Li, S. J. Blundell and S. J. Clarke, Inorganic Chemistry, 2015, 54, 1958–1964.
- Smith and Chu (1967) T. F. Smith and C. W. Chu, Phys. Rev., 1967, 159, 353–358.
- Lei et al. (2011) H. Lei, M. Abeykoon, E. S. Bozin, K. Wang, J. B. Warren and C. Petrovic, Phys. Rev. Lett., 2011, 107, 137002.
- Shoemaker et al. (2012) D. P. Shoemaker, D. Y. Chung, H. Claus, M. C. Francisco, S. Avci, A. Llobet and M. G. Kanatzidis, Phys. Rev. B, 2012, 86, 184511.
- Neilson and McQueen (2012) J. R. Neilson and T. M. McQueen, J. Amer. Chem. Soc., 2012, 134, 7750–7757.
- (33) X. Zhou, C. K. H. Borg, J. W. Lynn, S. R. Saha, J. Paglione and E. E. Rodriguez, http://arxiv.org/abs/1512.03399.
- Dong et al. (2015) X. Dong, K. Jin, D. Yuan, H. Zhou, J. Yuan, Y. Huang, W. Hua, J. Sun, P. Zheng, W. Hu, Y. Mao, M. Ma, G. Zhang, F. Zhou and Z. Zhao, Phys. Rev. B, 2015, 92, 064515.
- Pachmayr et al. (2016) U. Pachmayr, N. Fehn and D. Johrendt, Chem. Commun., 2016, –.
- Margadonna et al. (2009) S. Margadonna, Y. Takabayashi, Y. Ohishi, Y. Mizuguchi, Y. Takano, T. Kagayama, T. Nakagawa, M. Takata and K. Prassides, Phys. Rev. B, 2009, 80, 064506.
- Rodriguez et al. (2013) E. E. Rodriguez, D. A. Sokolov, C. Stock, M. A. Green, O. Sobolev, J. A. Rodriguez-Rivera, H. Cao and A. Daoud-Aladine, Physical Review B, 2013, 88, 165110.
- Lennie et al. (1997) A. R. Lennie, S. A. T. Redfern, P. E. Champness, C. P. Stoddart, P. F. Schofield and D. J. Vaughan, Am. Mineral., 1997, 82, 302–309.
- Werthamer et al. (1966) N. R. Werthamer, E. Helfand and P. C. Hohenberg, Phys. Rev., 1966, 147, 295–302.
- Tinkham (1963) M. Tinkham, Phys. Rev., 1963, 129, 2413–2422.
- Ketterson and Song (1999) J. Ketterson and S. Song, Superconductivity, Cambridge University Press, 40 West 20th Street, New York, NY 10011-4211, USA, 1999, pp. 45–46.
- Hsu et al. (2008) F.-C. Hsu, J.-Y. Luo, K.-W. Yeh, T.-K. Chen, T.-W. Huang, P. M. Wu, Y.-C. Lee, Y.-L. Huang, Y.-Y. Chu, D.-C. Yan et al., P. Natl. Acad. Sci. USA, 2008, 105, 14262–14264.
- Hu et al. (2009) R. Hu, E. S. Bozin, J. B. Warren and C. Petrovic, Phys. Rev. B, 2009, 80, 214514.
- Abdel-Hafiez et al. (2015) M. Abdel-Hafiez, Y.-Y. Zhang, Z.-Y. Cao, C.-G. Duan, G. Karapetrov, V. M. Pudalov, V. A. Vlasenko, A. V. Sadakov, D. A. Knyazev, T. A. Romanova, D. A. Chareev, O. S. Volkova, A. N. Vasiliev and X.-J. Chen, Phys. Rev. B, 2015, 91, 165109.
- Millis et al. (1988) A. J. Millis, S. Sachdev and C. M. Varma, Phys. Rev. B., 1988, 37, 4795.
- Vaughan and Ridout (1971) D. Vaughan and M. Ridout, J. Inorg. Nucl. Chem., 1971, 33, 741 – 746.
- Subedi et al. (2008) A. Subedi, L. Zhang, D. J. Singh and M. H. Du, Phys. Rev. B, 2008, 78, 134514.
- Kwon et al. (2011) K. D. Kwon, K. Refson, S. Bone, R. Qiao, W.-l. Yang, Z. Liu and G. Sposito, Phys. Rev. B, 2011, 83, 064402.
- Devey et al. (2008) A. J. Devey, R. Grau-Crespo and N. H. de Leeuw, J. Phys. Chem. C, 2008, 112, 10960–10967.
- Brgoch and Miller (2012) J. Brgoch and G. J. Miller, J. Phys. Chem. A, 2012, 116, 2234–2243.
- Greenfield et al. (2015) J. T. Greenfield, S. Kamali, K. Lee and K. Kovnir, Chem. Mater., 2015, 27, 588–596.
- Lee et al. (2012) C. Lee, K. Kihou, A. Iyo, H. Kito, P. Shirage and H. Eisaki, Solid State Commun., 2012, 152, 644 – 648.
- Mizuguchi et al. (2010) Y. Mizuguchi, Y. Hara, K. Deguchi, S. Tsuda, T. Yamaguchi, K. Takeda, H. Kotegawa, H. Tou and Y. Takano, Supercond. Sci. Tech., 2010, 23, 054013.
- Imai et al. (2009) T. Imai, K. Ahilan, F. L. Ning, T. M. McQueen and R. J. Cava, Phys. Rev. Lett., 2009, 102, 177005.
- Mizuguchi et al. (2009) Y. Mizuguchi, F. Tomioka, S. Tsuda, T. Yamaguchi and Y. Takano, Appl. Phys. Lett., 2009, 94, –.
- Zajdel et al. (2010) P. Zajdel, P.-Y. Hsieh, E. E. Rodriguez, N. P. Butch, J. D. Magill, J. Paglione, P. Zavalij, M. R. Suchomel and M. A. Green, J. Amer. Chem. Soc., 2010, 132, 13000–13007.