Discovery of a FR 0 radio galaxy emitting at -ray energies
Abstract
We present supporting evidence for the first association of a Fermi source, 3FGLJ1330.0-3818, with the FR 0 radio galaxy Tol1326-379. FR 0s represent the majority of the local radio loud AGN population but their nature is still unclear. They share the same properties of FR Is from the point of view of the nuclear and host properties, but they show a large deficit of extended radio emission. Here we show that FR 0s can emit photons at very high energies. Tol1326-379 has a GeV luminosity of erg s-1, typical of FR Is, but with a steeper -ray spectrum (). This could be related to the intrinsic jet properties but also to a different viewing angle.
keywords:
galaxies: active-galaxies:radio-galaxies:individual (Tol1326379)-galaxies:jet - -rays:galaxies1 Introduction
Radio Galaxies (RGs) has been historically divided into faint edge-darkened FR I and bright edge-brightened FR II (Fanaroff & Riley, 1974) on the basis of their extended radio morphology with the transition occurring at, approximately, a radio power of P 1025 W Hz-1 sr-1. From the optical point of view, radio galaxies are split into Broad Line Radio Galaxies (BLRGs) and Narrow Line Radio Galaxies (NLRGs). NLRGs can be further classified as High Excitation Galaxies (HEGs) and Low Excitation Galaxies (LEGs) based on their optical emission line ratios (Buttiglione et al., 2010). While HEGs and BLRGs show almost exclusively a FR II morphology, LEGs can assume both radio morphologies. It is believed that in LEGs, the AGN luminosity is sustained by hot gas via advection-dominated flow-like/Bondi accretion (Balmaverde, Baldi & Capetti, 2008), while in BLRGs and HEGs by a cold geometrically–thin, optically–thick disk (Best & Heckman, 2012; Heckman & Best, 2014). Steep Spectrum Radio Quasars (SSRQs) are similar to BLRGs but more distant and luminous. FRIs and FR IIs are considered the parent population of BL LACs (BLs) and Flat Spectrum Radio Quasars (FSRQs), respectively (Urry & Padovani, 1995).
Being observed at large angles , the jets of RGs and SSRQs (collectively named Misaligned AGN: MAGN) do not benefit from the strong Doppler amplification typical of blazars. Although geometrically disfavored (i.e. less amplified), RGs and SSRQs have been detected above 100 MeV. The Fermi satellite found 11 MAGN in only 15 months of Large Area Telescope (LAT) survey (Abdo et al., 2010c) with four of them also detected in the TeV band. Although their number is a tiny fraction of the total Fermi detected sources, their discovery had a strong impact on the study of the high energy process in AGN.
A clear link, in at least two BLRGs, 3C 111 and 3C 120, has been established between the expulsion of bright superluminal knots from the radio core and intense -ray flares (Grandi, Torresi & Stanghellini, 2012; Casadio et al., 2015).
The firm detection of GeV emission from the radio lobes in nearby RG Centaurus A has shown that extranuclear extended regions can be a source of gamma-ray photons, implying the presence of highly energetic particles at large distances from the nucleus (Abdo et al., 2010b). Because their radiative lifetimes ( to 10 million years) approach plausible electron transport time scales across the lobes, their presence is difficult to explain unless successive particle acceleration occurs even at large distances from the black hole.
Spectral Energy Distribution (SED) studies of FR I radio galaxies showed that a pure, one-zone homogeneous, Synchrotron Self-Compton (SSC) emitting region is inadequate in reproducing the radio to TeV data, stimulating the elaboration of more complex models. Stratified jets with different regions interacting with each other (Georganopoulos & Kazanas, 2003; Ghisellini, Tavecchio & Chiaberge, 2005; Böttcher & Dermer, 2010) as well as magnetic reconnection events along the jet (Giannios, Uzdensky & Begelman, 2010) or in the vicinity of the black hole (Khiali, de Gouveia Dal Pino & Sol, 2015) have been suggested as possible sources of -ray photons. Hadronic models based on proton-photon interaction (see for a review Böttcher 2012) have also been explored providing possible connections among AGN, Ultra High Energy Cosmic Rays and neutrinos (Becker & Biermann, 2009)
All these results are based on the study of the brightest MAGN discovered in the first years of the Fermi-LAT activity, i.e. bright radio sources with flux density of 2Jy or more. The recent publication of the new Fermi-LAT point source catalog (3FGL - Acero et al. 2015) and the Fermi-LAT AGN catalogs (3LAC - Ackermann et al. 2015) collecting 4 years of data now allow us to extend the study of GeV radio galaxies to lower fluxes. Although the ’standard’ picture, i.e. the predominance of bright FR Is among MAGN, is confirmed, we can now enter into the unexplored territory of fainter radio AGN. Indeed we propose here the first association between a 3LAC gamma-ray source and a FR 0 galaxy.
The cross-match of radio and optical data favored by the advent of large area surveys has surprisingly revealed that the bulk of the radio-galaxy population lacks prominent extended radio structures. Best & Heckman (2012) built a sample of radio-galaxies by cross-correlating the Sloan Digital Sky Survey (SDSS), the National Radio Astronomy Observatory (NRAO) Very Large Array (VLA) Sky Survey (NVSS), and the the Faint Images of the Radio Sky at Twenty centimetres (FIRST) survey datasets. This sample is selected at mJy and it includes RGs up to 0.3, covering the range W Hz-1. Most of them ( 80 %) are unresolved or barely resolved at the 5′′ FIRST resolution, corresponding to a limit to their size of 10 kpc (Baldi & Capetti, 2009). The lack of extended radio structures, that characterize the morphology of the traditional Fanaroff-Riley classes (FR I and FR II), suggests defining these objects as FR 0s (see Baldi, Capetti & Giovannini 2015b).
FR 0s share the same properties of FR Is from the point of view of the nuclear and host properties. By comparing FR Is and FR 0s of similar AGN power, estimated from the optical line luminosity, FR 0s show the same radio core power but a strong deficit of extended radio emission. Most of them () can be classified as LEGS, the same spectroscopic class to which FR Is belong. Finally, the hosts of these two classes are effectively indistinguishable being in both cases red early-type galaxies with central black hole masses larger than (Baldi & Capetti, 2009, 2010; Sadler et al., 2014; Baldi, Capetti & Giovannini, 2015a).
Although FR 0s represent the majority of the low luminosity RGs in the local Universe, they are a puzzling class of AGN completely unexplored at high energies.
In this paper, we show that the galaxy Tol1326-379, identified as the counterpart of the -ray source 3FGLJ1330.0-3818 and classified in the 3LAC as a Flat Spectrum Radio Quasar, is actually the first FR 0 radio source discovered in the GeV sky.
A cosmology with km s-1 Mpc-1, , and is assumed.
2 3FGLJ1330.0-3818 - Tol1326-379
The -ray source 3FGLJ1330.0-3818 was detected by Fermi with a significance of , a flux above 1 GeV of F phot cm-2 s-1 and a power law index (Acero et al., 2015).
3FGLJ1330.0-3818 is listed in the 3LAC catalog and associated to the early type galaxy Tol1326-379 at z=0.02843 with a Bayesian probability of association of 90%. The Bayesian method calculates the posterior probability that a source from a catalog of candidates is the counterpart of a -ray source detected by the LAT, evaluating the significance of a spatial coincidence between the candidate counterpart and the LAT-detected source. For more details see Abdo et al. (2010a).
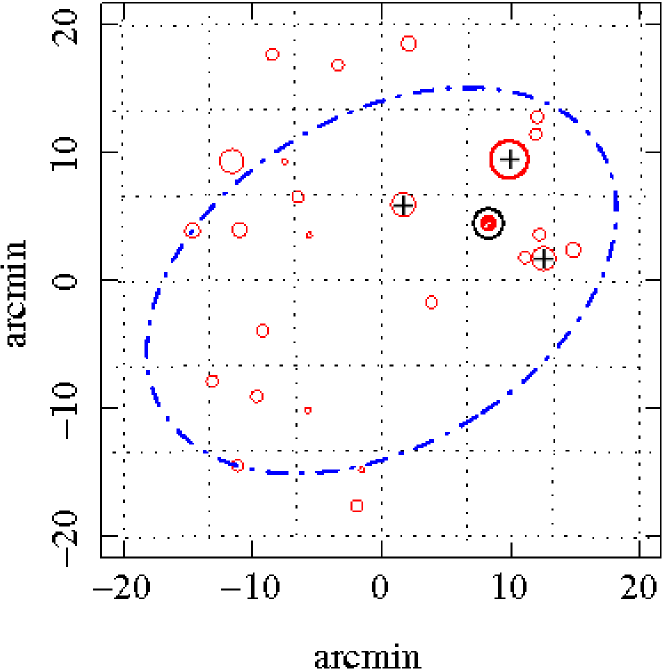
In order to strengthen the association proposed by the 3LAC catalog, we explored the region around 3FGLJ1330.0-3818 within the 95% -ray position error ellipse (20 13) looking for alternative identifications. We considered all radio sources with a NVSS flux density larger than 20 mJy (3 times fainter than Tol1326-379), finding three objects spanning the range 70 to 240 mJy (see Figure 1). Their radio spectral indices, estimated between 0.843 and 1.4 GHz, are steep ( 0.7-0.9) and none of them is detected at 4.8 GHz with the PARKES telescope (Griffith & Wright, 1993), implying that their flux densities are less than 35 mJy, suggesting the dominance of the extended radio emission. Furthermore none of them has a 2MASS counterpart apart from Tol1326-379 which shows an early-type morphology. This confirms that Tol1326-379 is the most likely association.


3 The galaxy Tol1326-379
3.1 Optical properties
The optical spectrum of Tol1326-379 from the 6dF Galaxy Survey (Jones et al., 2004, 2009) is presented in Fig. 2, left panel. It does not show any evidence for broad emission lines, arguing against its identification as FSRQ; on the other hand, the equivalent width (EW) of the emission lines largely exceed the limit of 5Å commonly adopted for BL Lac objects (Stickel et al., 1991). We obtained, in particular, EW(H) 454Å and EW([O III]) 81Å. The diagnostic line ratios (log [O III]/H =0.10, log [N II]/H =-0.03, log [O I]/H =-0.40, and log [S II]/H =0.01) are characteristic of a LEG spectrum (Kewley et al., 2006; Buttiglione et al., 2010). This lends further weight against its association with a FSRQ, because such sources always show a high ionization optical spectrum (Shaw et al., 2012).
Unfortunately the 6dFGS spectrum is not flux calibrated. In order to obtain the emission lines luminosity we need to rely on an indirect estimate. We derived the flux in the J band Two Micron All Sky Survey (2MASS) image from a synthetic aperture of 67, the diameter of the 6dFGS fiber, after having degraded the image resolution to match the seeing reported in the observing log. We then adopted a V-J color of 2.43 (Mannucci et al., 2001), typical of early-type galaxies, and obtained of magnitude V=15.1. From its measured EW we finally obtain an [O III] flux of 3.2 erg cm-2 s-1 and a luminosity of 4 erg s-1.
In order to assess the accuracy of such a procedure, we performed the same analysis on a group of 7 early-type emission line galaxies in common between the 6dFGS and the SDSS survey. Our line measurements agree with those provided by the SDSS database within a factor of 4.
From its 2MASS image, we derived a total K magnitude of 11.22, corresponding to a luminosity of 1.0 solar luminosity. The tight correlation between and the near-infrared bulge luminosity proposed by Marconi & Hunt (2003) allows us to estimate (within a factor 2) the black hole mass of M⊙.
3.2 Radio properties
We collected the radio flux density data from the NASA/ IPAC Infrared Science Archive and Extragalactic Database (NED). To these data we added our own measurement at 20 GHz from the Australian Telescope Compact Array (ATCA); the observations were obtained on Oct 27th 2004 (project C1049, PI Ekers) as part of the AT20G survey (Murphy et al., 2010), centered at 19.9 GHz and with a bandwidth of 256 MHz and with a duration of 3.6 minutes. We used PKS 1934 – 638 for the primary flux calibration, 1036–52 as bandpass calibrator and PKS 1349-439 as phase calibrator. After deconvolution the source appears as unresolved (angular resolution of 10); we perform a Gaussian fit using ’jmfit’ task of AIPS software111The NRAO Astronomical Image Processing System (AIPS) is a package to support the reduction and analysis of data taken with radio telescopes. to estimate its flux density of 23.2 mJy. The available radio data cover the frequency range from 843 MHz to 20 GHz (see Fig. 2, right panel). None of the available radio images shows extended emission and in particular Tol1326-379 is reported by Healey et al. (2007) as a point source in their CRATES catalog at 8.4 GHz with an angular resolution of provided by the ATCA observation. The overall spectral slope is but the data points show a large scatter. This in part due to the source variability; indeed its flux density varied from 53.2 to 71.5 mJy in the NVSS and ATCA observations, respectively, two measurements obtained at the same frequency and with similar spatial resolution. In addition, the observations have rather different spatial resolution, typically for the four lower frequencies and of a few arcsec for the data at 8.4 and 20 GHz. The radio spectrum measured between these two high frequency (and high resolution) measurements is even flatter than the overall value, . The core dominance R parameter defined as the ratio between the 4.85 GHz and 1.4 GHz flux densities is .
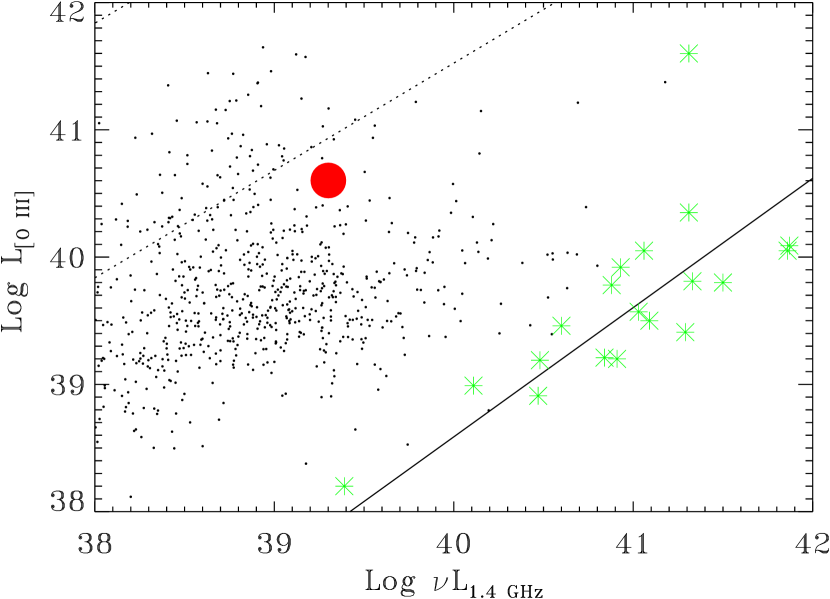
Summarizing, Tol1326-379 fulfills all the spectro-photometric requirements for a FR 0 classification listed by Baldi, Capetti & Giovannini (2015a). It is an early-type galaxy with a black hole mass larger than M⊙, a low excitation optical spectrum, and a high radio core dominance. Furthermore Tol1326-379 , given its radio luminosity at 1.4 GHz of 2 erg s-1 , falls within the region typical of FR 0s in the diagram shown in Fig.3 that compares the total radio and emission line luminosities. It also shows, as characteristic of this class of sources, a large deficit (a factor of 300) of radio emission respect to FR I radio-galaxies with equal emission line power. Tol1326-379 is also consistent, considering the relatively large errors related to the line measurement, with the core-[O III] luminosity relation found for FR Is (Baldi, Capetti & Giovannini, 2015a) another crucial prerogative of FR 0s.
3.3 Gamma-ray properties
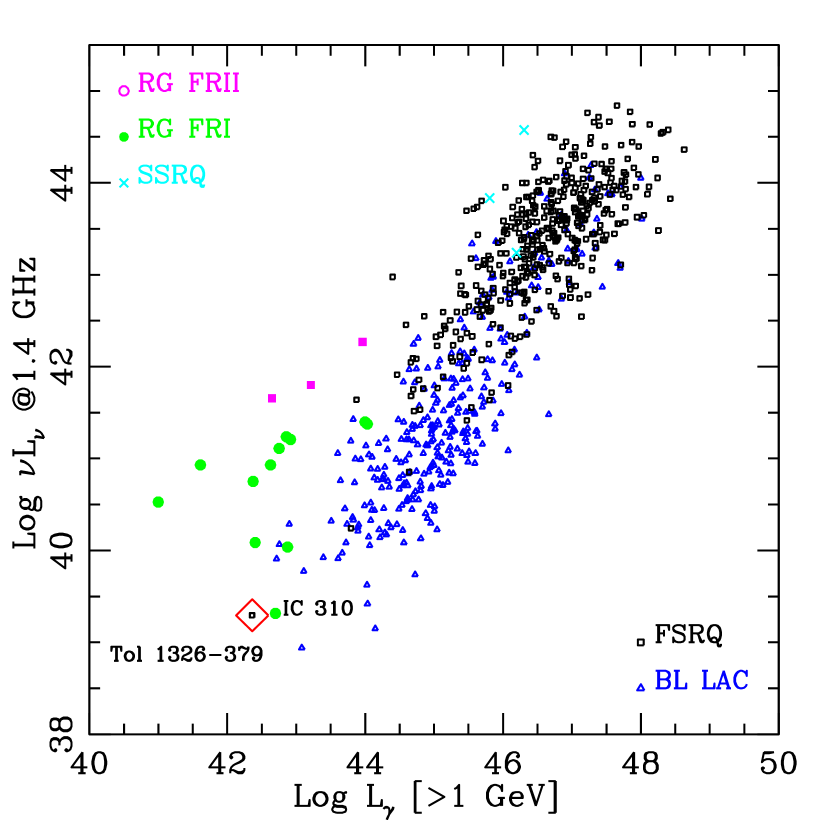
We explored the position of Tol1326-379 in a plot where the radio luminosity at 1.4 GHz of all the blazars and MAGN of the 3LAC clean sample (with known optical classification and redshift) are reported as a function of the gamma-ray luminosities (see Fig. 4, left panel). We also add 3C 111 and Cen B (not found in the clean sample because of their low galactic latitudes) and 3C 120 already reported in the 15 month-sample of MAGN and that has recently undergone strong flares (Casadio et al., 2015). As the origin (jet, lobes) of the FornaxA -ray emission is unclear, we prefer not to include it.
We derived for all sources in the 3LAC catalog the k-corrected 1.4 GHz rest frame flux density by assuming for blazars and 0.8 for MAGN.222In some cases the 3LAC radio flux density was provided at different radio frequencies (for example at 20 GHz or at 843 MHz). The above reported spectral radio slopes were also adopted to convert the listed flux to the 1.4 GHz flux. For Tol1326-379 we assume the observed value of . As expected, different classes lie in different zones of the diagram with FSRQs at higher luminosities than BL Lacs. We recover the well known radio -ray correlation for blazars (Ghirlanda et al., 2010; Ackermann et al., 2011). On average, MAGN are offset from the blazar strip showing a radio excess with respect to BL Lacs and FSRQs with similar -ray luminosities. This is due to the additional contribution from extranuclear radio emission. Tol1326-379 falls into the low luminosity tail of the blazar strip. It is, together with IC 310, the least powerful radio galaxy with -ray detection.
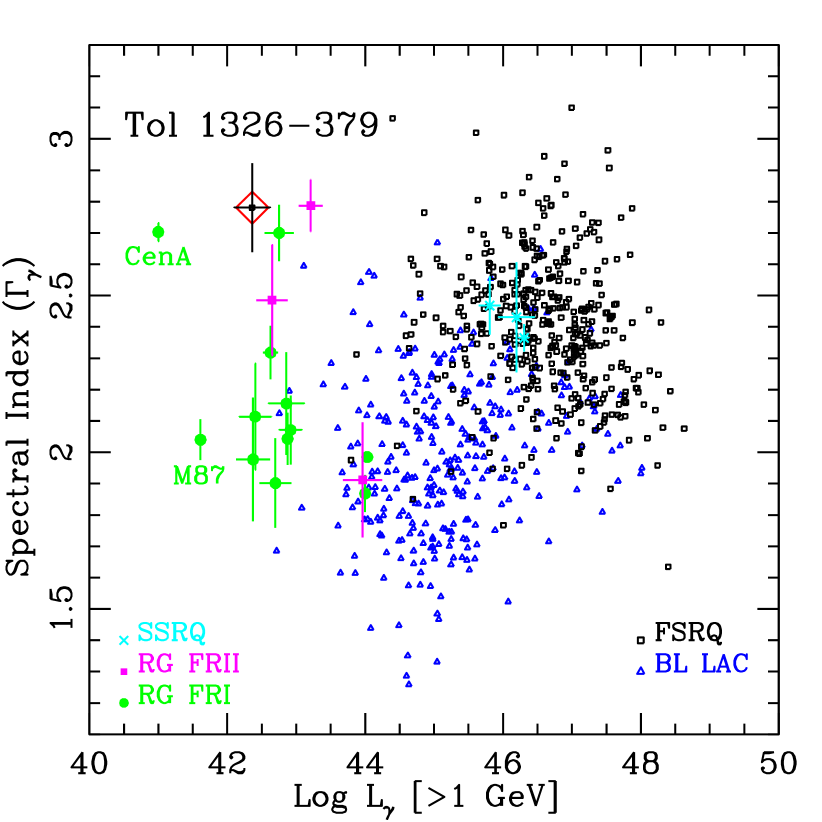
To further explore the nature of our source, the -ray spectral slope () of blazars and MAGN of the clean 3LAC sample was plotted in Fig. 4, right panel, as a function of the rest frame isotropic luminosity above 1 GeV ( in ergs cm-1 s-1). As is well known, different classes of AGN occupy different locations in the - plane (Abdo et al., 2010c). FSRQs and SSRQs are in the upper right part of the diagram (high luminosities and steep spectra), BL Lacs in the bottom right side (low luminosities and flat spectra), while RGs are all at low luminosities, but with a large scatter in spectral indeces. It is evident that Tol1326-379 falls into the general radio-galaxy area and not into the FSRQs region.
4 Discussion
The 3LAC catalog associates the -ray source 3FGLJ1330.0-3818 to the galaxy Tol1326-379.
We confirm that no other flat radio source brighter than Tol1326-379 at 5 GHz is present with the 95% error circle position of 3FGLJ1330.0-3818.
Although flat in the radio, Tol1326-379 is not a FSRQ but a FR 0 radio galaxy, the first source of this new radio class with a -ray counterpart.
Several observations support this conclusion:
-
•
Tol1326-379 is an early-type galaxy at z=0.02843;
-
•
it does not show any evidence for broad emission lines, arguing against its identification as FSRQs;
-
•
the high values of the line equivalent widths exclude the possibility that it is a BL Lac;
-
•
its line ratios are typical of LEGs;
-
•
its estimated black hole mass of M⊙ and accretion rate are characteristic of radio-loud AGN (Chiaberge & Marconi, 2011) associated with low efficiency accretion flows;
-
•
it is unresolved in the radio images, showing a high core dominance and a flat radio spectrum;
-
•
when put in a radio versus [O III] luminosity plot, it falls into the FR 0 region and not in the FR I area.
In Fig. 5, we present the SED of Tol1326-379. Besides the radio and Fermi observations already discussed, we complemented it with the WISE, Galex, and ROSAT data.
Tol1326-379 is detected at high significance by the WISE satellite in all four bands and its colors are W1-W2=0.38 0.03 and W2-W3=2.580.03, respectively. These are significantly different from those typical of elliptical galaxies (Wright et al., 2010). This indicates that the emission seen, at least, in the W3 band is dominated by the AGN component. Indeed, Tol1326-379 lies in a region populated by BL Lac objects (Massaro et al., 2011), although offset from the main blazar strip.
The UV data, from the Galex archive333http://galex.stsci.edu/GR6/, are corrected for galactic extinction assuming E(B-V)=0.0678. In the X-ray band, Tol1326-379 was only detected by the PSPC instrument (0.1-2.4 keV) onboard of the ROSAT satellite. Its count rate reported in the ROSAT All-Sky Survey Faint Source Catalog444http://www.xray.mpe.mpg.de/rosat/survey/rass-fsc/ is 0.029 c/s. This can be converted to an unabsorbed flux of F erg s-1 cm-2 if a power law with spectral slope and Galactic absorption of cm-2 are assumed. Due to the low spatial resolution of the UV and X-ray images, and the lack of any spectral information, the corresponding measurements should be considered as upper limits, as they include the host galaxy emission. In particular, its soft X-ray luminosity is compatible with that expected from the hot corona of an early-type galaxy with the luminosity estimated above for our source (Fabbiano, Kim & Trinchieri, 1992).
The SED of Tol1326-379 is compared to those of Centaurus A and M87, the prototype nearby FR I radio galaxies. Despite of the similar radio luminosity, M 87 is less luminous than Tol1326-379 by a factor of 30 at 1 GeV and has a flat SED in the -ray domain. On the contrary, Centaurus A and Tol1326-379 are quite similar in shape but the former source is about two orders of magnitude fainter.
Balmaverde & Capetti (2006) found that the SEDs of the FR I nuclei differ from those of BL Lacs. This is partly related to the frequency shift in the SED due to the relativistic beaming, but also to differences in the emitting regions. Indeed, due to the presence of a velocity stratification with the relativistic jets (Kovalev et al., 2007; Nagai et al., 2014) in BL Lacs we are seeing the regions of the jet with the highest Doppler factor (the so-called jet spine) while in FR Is the emission could be dominated by the slower jet layers. The SED differences might be witnessing the diverse physical conditions in these two regions (Chiaberge et al., 2000; Ghisellini, Tavecchio & Chiaberge, 2005; Tavecchio & Ghisellini, 2014) leading to a dependence of their shape on the viewing angle.
This effect might account for the SED differences between M 87 and Tol1326-379 and, on the other hand, the similarities with Centaurus A. Indeed, M 87 jet is seen at a rather small angle from the line of sight with (Acciari et al., 2009), while Cen A lies close to the plane of the sky, (Tingay et al., 1998). We argue that the SED shapes are, similarly to what is derived from the comparison between BL Lacs and FR Is, mainly driven by the jet viewing angle. Indeed, by excluding Centaurus A, all the FR Is have flat -ray spectra and are seen at small angles (see Table 1). The only exception is 3C 120, that has a slope comparable to that of Cen A (and Tol1326-379), but smaller inclination angle. 3C 120 is, however, a peculiar radio galaxy. Although classified as FR I, it has optical-UV-X-ray properties typical of FR IIs. It shows broad optical emission lines (Tadhunter et al., 1993), an UV bump, and an Kα iron line in the X-ray spectrum (Zdziarski & Grandi, 2001; Ogle et al., 2005; Kataoka et al., 2007; Chatterjee et al., 2011), all clear signatures of the presence of an efficient accretion disk. Indeed, in Fig. 4 (right panel) 3C 120 falls between 3C 111 (=2.79,Lγ=43.21), and Pictor A (=2.49,Lγ=42.65), two (FR II) BLRGs detected by Fermi.
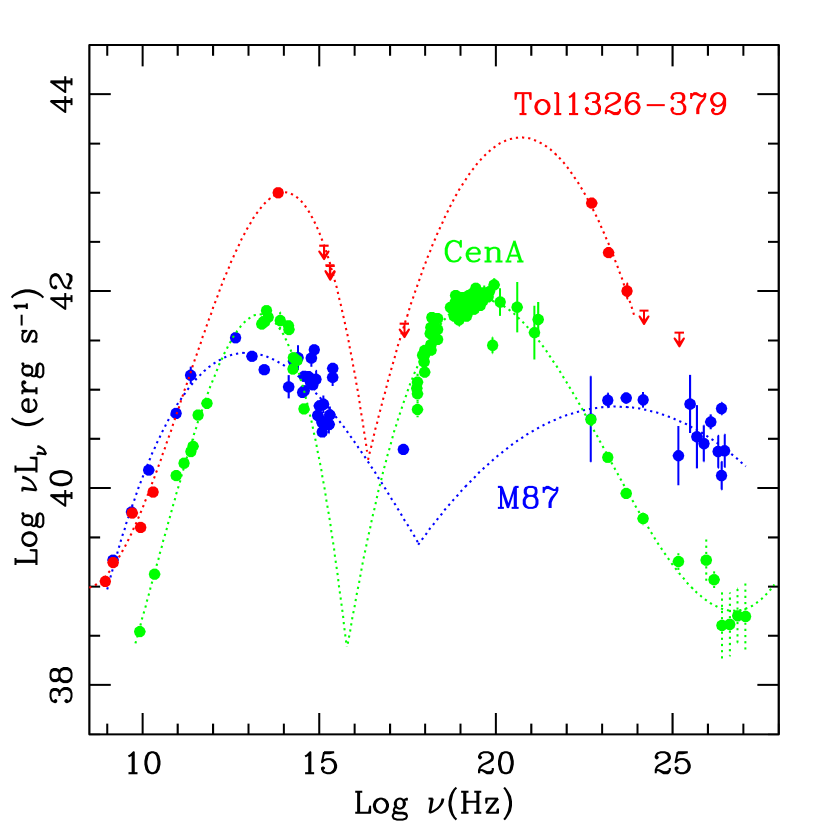
Although we do not have any direct estimate for the orientation of Tol1326-379, we speculate that it is oriented at a large angle and this causes the similarity between its SED and that of Cen A.
Alternatively, if we are seeing the jet of Tol1326-379 at a small angle, its SED would be intrinsically different from those of the FR Is. This would be the first indication of a discrepant property between these two classes (other than the paucity of extended radio emission in FR 0) and might be an important clue to understand their nature. Interesting enough, the Compton peak in Tol1326-379 appears to be more prominent than the Synchrotron one. This generally occurs in FSRQs, where a surplus of seed photons coming from the accretion disk, the broad line region and the torus, contributes to the high energy emission by External Compton (Sikora et al., 2009). Incidentally we note that Tol1326-379 is characterized by a steep -ray spectrum (), more similar to that generally observed in FSRQs (and their misaligned population, i.e BLRGs and SSRQs) than in BL Lacs (and FRIs). It is, however, improbable that an External Compton mechanism is responsible for the cooling of the jet particles of Tol1326-379. Its nuclear environment is poor in photons as indicated by the low accretion rate. It is then more plausible that its -ray luminosity is sustained by different jet components that mutually interact amplifying the IC emission as suggested for FR Is. The excess of -ray radiation could then reflect different physical conditions of the high energy dissipation regions (i.e. of the spine and/or the layers).
Progress in our understanding of the properties of Tol1326-379 can come from a better definition of its SED. In particular, the information in the X-rays can be improved with a firm detection and with a measurement of the spectral slope in this band. This might be used to test the indication that the Compton peak in Tol1326-379 is more prominent than the synchrotron one.
Since a large diversity of spectral behavior among this class of sources, as already observed in blazars, cannot be excluded, other observations of -rays emitting FR 0s are necessary to consolidate the overall picture.
| Source | Lγ | Ref. | ||
|---|---|---|---|---|
| 3C 78 | 2.070.11 | 42.92 | 1 | |
| IC 310 | 20∘ | 1.900.14 | 42.70 | 2 |
| NGC1275 | 30- | 1.950.01 | 44.03 | 3 |
| B2033139 | 45∘ | 2.110.17 | 42.40 | 4 |
| 3C 120a | 2.7 | 42.75 | 5 | |
| PKS 0625-45 | 61∘ | 1.870.05 | 44.00 | 6 |
| 3C 189 | 2.160.16 | 42.86 | 7 | |
| 3C 264 | 50∘ | 1.980.19 | 42.37 | 8 |
| M 87 | 15- | 2.050.06 | 41.61 | 9 |
| Cen A | 50- | 2.700.03 | 41.00 | 10 |
| Cen Ba,b | 2.320.09 | 42.63 | 11 | |
| NGC 6251 | 10- | 2.040.08 | 42.87 | 12 |
a – Cen B and 3C 120 are not in the clean 3LAC sample.
b – Cen B: Jet inclination upper limit estimated using the jet/counterjet flux ratio at 4.8 GHz provided by Jones, Lloyd & McAdam (2001). Possible -ray contribution from the lobes (Katsuta et al., 2013).
(1) Kharb et al. (2009), (2) Schulz et al. (2015), (3) Walker, Romney & Benson (1994), (4) Giovannini et al. (2001), (5) Jorstad et al. (2005), (6) Venturi et al. (2000), (7) Bondi et al. (2000), (8) Lara et al. (2004), (9) Acciari et al. (2009), (10) Tingay et al. (1998), (11) Jones, Lloyd & McAdam (2001), (12) Migliori et al. (2011).
Acknowledgments
We are grateful to F. Paresce for carefully reading the paper and useful comments which improved the final version. We thank the referee for constructive comments/suggestions on the manuscript. This research made use of the NASA/ IPAC Infrared Science Archive and Extragalactic Database (NED), which are operated by the Jet Propulsion Laboratory, California Institute of Technology, under contract with the National Aeronautics and Space Administration. Part of this work is based on archival data, software or online services provided by the Italian Space Agency (ASI) Scientific Data Center (ASDC).
References
- Abdo et al. (2010a) Abdo A. A. et al., 2010a, ApJS, 188, 405
- Abdo et al. (2010b) Abdo A. A. et al., 2010b, Science, 328, 725
- Abdo et al. (2010c) Abdo A. A. et al., 2010c, ApJ, 720, 912
- Acciari et al. (2009) Acciari V. A. et al., 2009, Science, 325, 444
- Acero et al. (2015) Acero F. et al., 2015, ApJS, 218, 23
- Ackermann et al. (2011) Ackermann M. et al., 2011, ApJ, 741, 30
- Ackermann et al. (2015) Ackermann M. et al., 2015, ApJ, 810, 14
- Aharonian et al. (2009) Aharonian F. et al., 2009, ApJ, 695, L40
- Aharonian et al. (2006) Aharonian F. et al., 2006, Science, 314, 1424
- Aliu et al. (2012) Aliu E. et al., 2012, ApJ, 746, 141
- Baldi & Capetti (2009) Baldi R. D., Capetti A., 2009, A&A, 508, 603
- Baldi & Capetti (2010) Baldi R. D., Capetti A., 2010, A&A, 519, A48+
- Baldi, Capetti & Giovannini (2015a) Baldi R. D., Capetti A., Giovannini G., 2015a, A&A, 576, A38
- Baldi, Capetti & Giovannini (2015b) Baldi R. D., Capetti A., Giovannini G., 2015b, 5th Workshop on CSS and GPS radio sources, arXiv:1510.04272
- Balmaverde, Baldi & Capetti (2008) Balmaverde B., Baldi R. D., Capetti A., 2008, A&A, 486, 119
- Balmaverde & Capetti (2006) Balmaverde B., Capetti A., 2006, A&A, 447, 97
- Balmaverde, Capetti & Grandi (2006) Balmaverde B., Capetti A., Grandi P., 2006, A&A, 451, 35
- Becker & Biermann (2009) Becker J. K., Biermann P. L., 2009, Astroparticle Physics, 31, 138
- Best & Heckman (2012) Best P. N., Heckman T. M., 2012, MNRAS, 421, 1569
- Biretta, Stern & Harris (1991) Biretta J. A., Stern C. P., Harris D. E., 1991, AJ, 101, 1632
- Bondi et al. (2000) Bondi M., Parma P., de Ruiter H., Fanti R., Laing R. A., Fomalont E. B., 2000, MNRAS, 314, 11
- Böttcher (2012) Böttcher M., 2012, Fermi & Jansky Proceedings - eConf C1111101 - arXiv:1205.0539
- Böttcher & Dermer (2010) Böttcher M., Dermer C. D., 2010, ApJ, 711, 445
- Broderick et al. (2015) Broderick A. E., Narayan R., Kormendy J., Perlman E. S., Rieke M. J., Doeleman S. S., 2015, ApJ, 805, 179
- Buttiglione et al. (2010) Buttiglione S., Capetti A., Celotti A., Axon D. J., Chiaberge M., Macchetto F. D., Sparks W. B., 2010, A&A, 509, A6
- Casadio et al. (2015) Casadio C. et al., 2015, ApJ, 808, 162
- Chatterjee et al. (2011) Chatterjee R. et al., 2011, ApJ, 734, 43
- Chiaberge et al. (2000) Chiaberge M., Celotti A., Capetti A., Ghisellini G., 2000, A&A, 358, 104
- Chiaberge & Marconi (2011) Chiaberge M., Marconi A., 2011, MNRAS, 416, 917
- Condon et al. (1998) Condon J. J., Cotton W. D., Greisen E. W., Yin Q. F., Perley R. A., Taylor G. B., Broderick J. J., 1998, AJ, 115, 1693
- Despringre, Fraix-Burnet & Davoust (1996) Despringre V., Fraix-Burnet D., Davoust E., 1996, A&A, 309, 375
- Fabbiano, Kim & Trinchieri (1992) Fabbiano G., Kim D.-W., Trinchieri G., 1992, ApJS, 80, 531
- Fanaroff & Riley (1974) Fanaroff B. L., Riley J. M., 1974, MNRAS, 167, 31P
- Feain et al. (2009) Feain I. J. et al., 2009, ApJ, 707, 114
- Georganopoulos & Kazanas (2003) Georganopoulos M., Kazanas D., 2003, ApJL, 589, L5
- Ghirlanda et al. (2010) Ghirlanda G., Ghisellini G., Tavecchio F., Foschini L., 2010, MNRAS, 407, 791
- Ghisellini, Tavecchio & Chiaberge (2005) Ghisellini G., Tavecchio F., Chiaberge M., 2005, A&A, 432, 401
- Giannios, Uzdensky & Begelman (2010) Giannios D., Uzdensky D. A., Begelman M. C., 2010, MNRAS, 402, 1649
- Giovannini et al. (2001) Giovannini G., Cotton W. D., Feretti L., Lara L., Venturi T., 2001, ApJ, 552, 508
- Grandi et al. (2003) Grandi P. et al., 2003, ApJ, 593, 160
- Grandi, Torresi & Stanghellini (2012) Grandi P., Torresi E., Stanghellini C., 2012, ApJL, 751, L3
- Griffith & Wright (1993) Griffith M. R., Wright A. E., 1993, AJ, 105, 1666
- Harmon et al. (2004) Harmon B. A. et al., 2004, ApJS, 154, 585
- Healey et al. (2007) Healey S. E., Romani R. W., Taylor G. B., Sadler E. M., Ricci R., Murphy T., Ulvestad J. S., Winn J. N., 2007, ApJS, 171, 61
- Heckman & Best (2014) Heckman T. M., Best P. N., 2014, ARAA, 52, 589
- Heckman et al. (2004) Heckman T. M., Kauffmann G., Brinchmann J., Charlot S., Tremonti C., White S. D. M., 2004, ApJ, 613, 109
- Jones et al. (2009) Jones D. H. et al., 2009, MNRAS, 399, 683
- Jones et al. (2004) Jones D. H. et al., 2004, MNRAS, 355, 747
- Jones, Lloyd & McAdam (2001) Jones P. A., Lloyd B. D., McAdam W. B., 2001, MNRAS, 325, 817
- Jorstad et al. (2005) Jorstad S. G. et al., 2005, AJ, 130, 1418
- Kataoka et al. (2007) Kataoka J. et al., 2007, PASJ, 59, 279
- Katsuta et al. (2013) Katsuta J. et al., 2013, A&A, 550, A66
- Kewley et al. (2006) Kewley L. J., Groves B., Kauffmann G., Heckman T., 2006, MNRAS, 372, 961
- Kharb et al. (2009) Kharb P., Gabuzda D. C., O’Dea C. P., Shastri P., Baum S. A., 2009, ApJ, 694, 1485
- Khiali, de Gouveia Dal Pino & Sol (2015) Khiali B., de Gouveia Dal Pino E. M., Sol H., 2015, arXiv:1504.07592K
- Kovalev et al. (2007) Kovalev Y. Y., Lister M. L., Homan D. C., Kellermann K. I., 2007, ApJ, 668, L27
- Lara et al. (2004) Lara L., Giovannini G., Cotton W. D., Feretti L., Venturi T., 2004, A&A, 415, 905
- Mannucci et al. (2001) Mannucci F., Basile F., Poggianti B. M., Cimatti A., Daddi E., Pozzetti L., Vanzi L., 2001, MNRAS, 326, 745
- Marconi & Hunt (2003) Marconi A., Hunt L. K., 2003, ApJL, 589, L21
- Massaro et al. (2011) Massaro F., D’Abrusco R., Ajello M., Grindlay J. E., Smith H. A., 2011, ApJL, 740, L48
- Mauch et al. (2003) Mauch T., Murphy T., Buttery H. J., Curran J., Hunstead R. W., Piestrzynski B., Robertson J. G., Sadler E. M., 2003, MNRAS, 342, 1117
- Meisenheimer et al. (2007) Meisenheimer K. et al., 2007, A&A, 471, 453
- Migliori et al. (2011) Migliori G. et al., 2011, A&A, 533, A72
- Murphy et al. (2010) Murphy T. et al., 2010, MNRAS, 402, 2403
- Nagai et al. (2014) Nagai H. et al., 2014, ApJ, 785, 53
- Ogle et al. (2005) Ogle P. M., Davis S. W., Antonucci R. R. J., Colbert J. W., Malkan M. A., Page M. J., Sasseen T. P., Tornikoski M., 2005, ApJ, 618, 139
- Perlman et al. (2001) Perlman E. S., Sparks W. B., Radomski J., Packham C., Fisher R. S., Piña R., Biretta J. A., 2001, ApJ, 561, L51
- Sadler et al. (2014) Sadler E. M., Ekers R. D., Mahony E. K., Mauch T., Murphy T., 2014, MNRAS, 438, 796
- Schulz et al. (2015) Schulz R. et al., 2015, 12th European VLBI Network Symposium and Users Meeting - EVN 2014, 7-10 October 2014, Cagliari, Italy, arXiv:1502.03559
- Shaw et al. (2012) Shaw M. S. et al., 2012, ApJ, 748, 49
- Sikora et al. (2009) Sikora M., Stawarz Ł., Moderski R., Nalewajko K., Madejski G. M., 2009, ApJ, 704, 38
- Stickel et al. (1991) Stickel M., Fried J. W., Kuehr H., Padovani P., Urry C. M., 1991, ApJ, 374, 431
- Tadhunter et al. (1993) Tadhunter C. N., Morganti R., di Serego-Alighieri S., Fosbury R. A. E., Danziger I. J., 1993, MNRAS, 263, 999
- Tan et al. (2008) Tan J. C., Beuther H., Walter F., Blackman E. G., 2008, ApJ, 689, 775
- Tavecchio & Ghisellini (2014) Tavecchio F., Ghisellini G., 2014, MNRAS, 443, 1224
- Tingay et al. (1998) Tingay S. J. et al., 1998, AJ, 115, 960
- Urry & Padovani (1995) Urry C. M., Padovani P., 1995, PASP, 107, 803
- Venturi et al. (2000) Venturi T., Morganti R., Tzioumis T., Reynolds J., 2000, A&A, 363, 84
- Walker, Romney & Benson (1994) Walker R. C., Romney J. D., Benson J. M., 1994, ApJ, 430, L45
- Whittle (1985) Whittle M., 1985, MNRAS, 213, 33
- Wright et al. (1994) Wright A. E., Griffith M. R., Burke B. F., Ekers R. D., 1994, ApJS, 91, 111
- Wright et al. (2010) Wright E. L. et al., 2010, AJ, 140, 1868
- Zdziarski & Grandi (2001) Zdziarski A. A., Grandi P., 2001, ApJ, 551, 186