Rotational instability of the electric polarization and divergence of the shear elastic compliance
Abstract
The rotational instability of the electric polarization during phase transformations between ferroelectric phases is of great practical interest, since it may be accompanied by extremely large values of the piezoelectric coefficient, and a divergence of the coupled shear compliance contributes to such enhancements. In the literature, this had been explicitly calculated in the framework of the Landau theory and discussed with specific numerical simulations involving tetragonal, orthorhombic and rhombohedral ferroelectric phases. When monoclinic phases are involved, such an approach is practically impossible, and an approximated treatment had been proposed, based on the observation that in those cases there are shear strains almost linearly coupled to the transverse component of , implying a divergence of the Curie-Weiss type in the associated compliances. Here the argument is extended to the general case of transitions whose major effect is a rotation of the polarization, and the limits of its validity are discussed. As experimental verification, the elastic response of BaTiO3 is measured and analyzed, together with those of other ferroelectric perovskites available in the literature, like KNN.
pacs:
77.80.B-, 77.84.Cg, 62.40.+i, 77.65.-jI Introduction
Considerable attention in the field of piezoelectric materials is devoted to the rotational or transverse instability of the polarization Fu and Cohen (2000); Iwata et al. (2001, 2002); Kutnjak et al. (2006); Damjanovic (2009); Zhou et al. (2012); Schneider et al. (2014) and, since the piezoelectric response is made up of dielectric and elastic contributions Nowick and Heller (1965); Damjanovic (2006); Cordero (2015), the elastic response contains important information,Salje et al. (2013); Cordero et al. (2014) that is similar and complementary to the piezoelectric constants. In addition, the elastic properties can be measured also in non-ferroelectric phases and are practically insensitive to the presence of free charge carriers from ionized defects, when measured on unpoled ceramic samples.not On the other hand, the elastic response at transitions between ferroelectric (FE) phases cannot be expressed in a simple and general manner, and only in few instances explicit expressions of the elastic anomalies have been provided,Devonshire (1951); Ishibashi and Iwata (1999); Iwata and Ishibashi (2005) and discussed on the basis of numerical examples. In fact, while these expressions can be written in reasonably transparent forms in terms of the spontaneous polarization , they become quite complicated when explicitly written as a function of temperature. In addition, although the derivation of these expressions in the framework of the Landau theory of phase transitions is not conceptually difficult, the tedious algebra does not help in gaining an intuitive physical picture. Therefore, the numerical curves of the compliances exhibit divergences where one intuitively expects them, for example and of BaTiO3 increase rapidly when the orthorhombic (O) phase is approached from the tetragonal (T) phase,Devonshire (1951) in accordance with the shear deformation of the cell transforming from the T to the O structure,Devonshire (1951) and similar enhancements are found when the anisotropy of the free energy versus the direction of vanishes in solid solutions of the PbZr1-xTixO3 (PZT) type.Ishibashi and Iwata (1999); Iwata and Ishibashi (2005) Yet, the notion that the shear compliance must become large does not provide information on the functional dependence on temperature, while the exact knowledge of that dependence from a numerical example is hardly generalizable to other cases.
An intermediate level of analysis has been provided in an attempt to cope with the transition from T to monoclinic (M) structure occurring at the morphotropic phase boundary (MPB, namely a nearly vertical boundary in the composition-temperature phase diagram) of PZT and other PbTiO3-based ferroelectrics.Cordero et al. (2007, 2011) These transitions are almost intractable from the elastic point of view with the required free energy expansion, that must include at least up to the 8th order of powers of . Here it is shown that the same approach can be applied to any case of transition essentially consisting of a rotation of the direction of the spontaneous polarization, with little change of its magnitude, and as experimental verification the classical case of BaTiO3 is revisited.
Previous studies of the elastic properties of BaTiO3 have been focused on selected elastic constants, without reference to the rotational instability at the FE/FE transitions,Berlincourt and Jaffe (1958) on the precursor FE fluctuations and softening in the paraelectric phase,Kashida et al. (1973); Courdille et al. (1978); Ko et al. (2011); Salje et al. (2013); Carpenter (2015) and on the motion of domain walls (DW) and defects within the FE phases.Cheng et al. (1994); Chen et al. (2014)
II Experimental
Two samples from different preparations by conventional mixed-oxide power techniques were tested. For sample #1 the starting nominal composition was BaTiO3 TiO2. After mixing (distilled H2O), calcining (1100 ∘C, 2h) and fine-milling (distilled H2O), the powder was densified to rectangular bars (about 3 g/cm3) and then sintered in air (1400 , 1h). The powder X-ray diffraction did not reveal any trace of impurity phases. The samples had densities of about 92% of the theoretical value (6.02 g/cm3) and a mean grain size of about 50 . Sample #1 was cut as a bar of dimensions mm3.
Sample #2 was prepared from stoichiometric amounts of BaCO3 (Aldrich, 99%) and TiO2 (Aldrich, 99.9%) powders wet-mixed in water using zirconia media and adding ammonium polyacrylate as dispersant. After freeze-drying, the mixture was calcined in air for 4 h at 1100 ∘C. The resulting powder was sieved, compacted in bars by means of isostatic cold pressing and sintered for 2 h at 1450 ∘C. The final relative density of the ceramics was 97% of the theoretical density. X-ray diffraction did not reveal any trace of secondary phases within the detection limit of the technique (1-2 wt%). The final shape of sample #2 was mm3, but since not all the sides were cut after sintering, some irregularities in the shape made the measurement of the higher frequencies noisy.
The dynamic Young’s modulus was measured by suspending the sample on two thin thermocouple wires in correspondence with the nodal lines of the first free flexural resonance mode, almost coinciding with a pair of the nodes of the fifth mode. Silver paint was applied at the center of one of the faces and the edge, in order to make electrical contact between the region facing an electrode and the thermocouple, also acting as ground. The vibration at frequency is electrostatically excited by application of an alternate voltage with frequency to the electrode. The same electrode is part of a resonating circuit whose high frequency ( MHz) is modulated by the distance from the sample, so that the vibration is monitored with a frequency modulation technique.Cordero et al. (2009) From the fundamental resonance frequency of the sample it is possible to deduce the Young’s modulusNowick and Berry (1972) . During a same run also the next odd flexural vibrations may be excited, whose frequencies ratios with are and . The data are presented as compliance , normalized to its minimum value , as , neglecting the changes in cell size with temperature. The elastic energy loss coefficient is measured from the decay of the free oscillations, if longer than 0.1 s, or from the width of the resonance peak.
III Results
Figure 1 displays the real part of the compliance and the losses measured at 6 kHz during heating and cooling of sample BT #1. All three phase transitions are clearly visible, similarly to previous measurements on ceramic samples.Cheng et al. (1994, 2003); Chen et al. (2014); Carpenter (2015) The temperatures of the extrema of are K during cooling, with a shift of K during heating, K with K and K with K. Therefore, they are all first order, particularly the R/O transition, but outside the temperature range of the O phase the curves are well reproducible between heating and cooling.
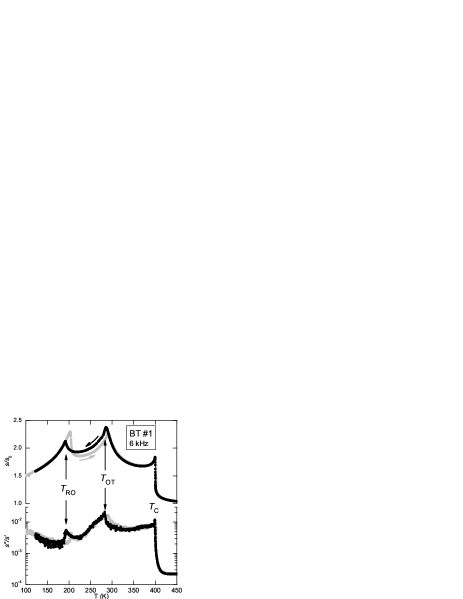
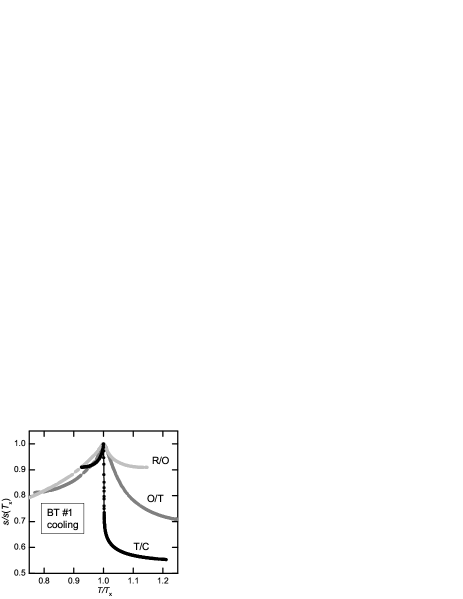
The most important feature for the present purposes is the fact that has a step at but peaks at and . The step at is rounded by some precursor softening in the C-PE phase, that has been amply studied in terms of fluctuations of the polarization.Kashida et al. (1973); Courdille et al. (1978); Ko et al. (2011); Salje et al. (2013) In addition, the stiffening just below is mainly related to domain wall (DW) relaxation, as shown later. On the other hand, the two anomalies at and completely lack the step and exhibit progressive softening on approaching the transitions from both high and low temperature. Actually, makes a jump during heating through the R/O transition, but this is due to large thermal hysteresis: the R phase remains metastable well into the stability region of the O phase and the transition appears more abrupt. The different behaviors at the three transitions are better put in evidence by normalizing the three anomalies as vs in Fig. 2.
In order to verify a possible dependence of the shapes of the elastic anomalies on DW relaxation, the measure has been repeated on the longer and thinner BT #2, where it was possible to excite also the 3rd and 5th free flexural modes.
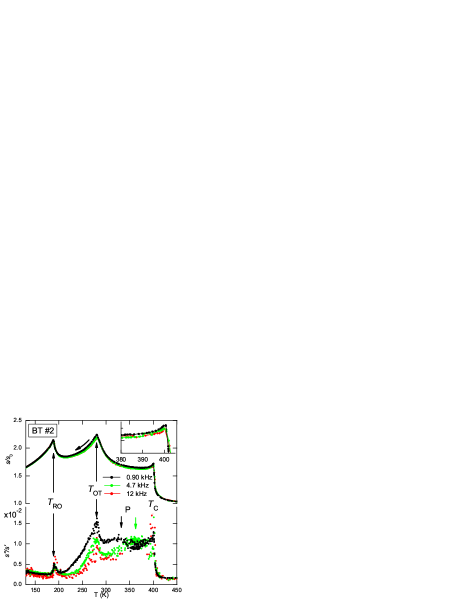
The dependence on frequency is much more evident in the losses than in the real part, because they are totally due to relaxation of DW, defects and to fluctuations, while has a prevalent elastic intrinsic contribution from the phase transformations. The frequency dispersion of is more evident below and , in correspondence with the highest values of the losses, and can therefore be attributed to DW relaxation. The inset shows that at higher frequencies the upturn of just below shifts to higher temperature and also decreases, suggesting that it is totally due to DW relaxation. A similar feature has been observed more clearly in PZT.Cordero et al. (2007); Cordero (2015) Instead, the rise of below cannot be attributed to DW relaxation, because passing from 0.9 to 12 kHz the amplitude of the losses, and hence of DW relaxation, is halved, while is almost unchanged.
IV Discussion
IV.1 Elastic anomaly at a 2nd order phase transition from Landau theory
We remind the main results that can be obtained from the Landau theory of the phase transitions regarding the elastic anomalies at ferroelectric transitions, referring to the simplest case of 2nd order transition with one-dimensional order parameter . In this case the Gibb’s free energy is written asStrukov and Levanyuk (1998); Cordero (2015)
| (1) | |||||
where all the coefficients of the expansion in powers of and stress are independent of temperature except that of , which decreases linearly and becomes negative below . The elastic energy of the symmetric PE phase is expressed in terms of where are in Voigt notation ( ) and there is summation over repeated indexes. The first coupling term, linear in both and is forbidden by symmetry, because it must be symmetric under inversion, like the cubic symmetric phase that it also describes. Since an inversion causes and (stress and strain are centrosymmetric 2nd rank tensors), the bilinear term changes sign and is forbidden: it must be . Then the first allowed coupling term is the electrostrictive . The resulting anomalies in the compliance , taking into account the variation of the equilibrium due to the application of , have been calculated also for more complicatedIshibashi and Iwata (1999); Iwata and Ishibashi (2005) and generalSlonczewski and Thomas (1970); Strukov and Levanyuk (1998) cases. Even though we have just shown that it must be in the free energy Eq. (1) of a cubic PE phase, in the following discussion it will be useful to see the effect of the bilinear coupling term on the elastic anomaly, which in the general case can be written asStrukov and Levanyuk (1998); Cordero (2015)
| (2) |
| (3) | |||
Normally, and the only effect of the ferroelectric transition is a steplike softening below of magnitude , as observed at in BaTiO3 and Ti-rich PZT.Cordero et al. (2007) Instead, the bilinear coupling alone causes a divergence exactly of the Curie-Weiss type both above and below , of magnitude . This type of behavior is indeed observed when the PE phase is piezoelectric; for example, a much studied case is the elastic constant of KDP.Litov and Garland (1970) Notice also that, already in the simple case of a one-dimensional order parameter, the two types of anomalies are not simply additive below , since there is a mixed term, but above only the Curie-Weiss term from bilinear coupling is present.
IV.2 Relationship between dielectric, elastic and piezoelectric responses
Before discussing further the nature of the softenings at the FE transitions, we would like to stress that they participate to the enhancement of the piezoelectric effect. A particularly simple relationship in this respect can be obtained starting from the original modelMason and Matthias (1948) of ferroelectricity in terms of thermodynamic equilibrium of the possible orientations of the spontaneous polarization in each cell, producing a high frequency dielectric relaxation with amplitude , and also considering the anelastic relaxation with amplitude (enhancement of the compliance) from the associated anisotropic strain (e.g. tetragonality in a T-FE phase).Cordero (2015) Then, the amplitude of the piezoelectric effect can be expressed asCordero (2015) (see Refs. Nowick and Heller, 1965; Damjanovic, 2006 for an analogous expression for the relaxation of non interacting point defects)
| (4) |
where the magnitude of the dielectric constant can be almost completely associated with the FE phase, while the compliance in the paraelectric phase in general cannot be neglected with respect to the enhancement in the FE phase. The above formula expresses the fact that the piezoelectric effect is made on an equal basis of a change in polarization and in strain, the first producing an enhancement of the dielectric susceptibility and the latter of the elastic compliance.
IV.3 Nearly linear coupling between polarization rotation and shear strain
At the middle of the MPB of PZT a large softening reminiscent of the Curie-Weiss term is observed, that has been associated with the T/M transition, with the M phase intermediate between T and R.Cordero et al. (2007, 2011) In order to explain the peaked softening, anomalously large and extended in temperature, it has been observed that the main effect of the T/M transition is a rotation of away from and the shear strains and are almost linearly coupled to the rotation angle, so that the elastic compliances and are expected to diverge as Eqs. (2,3) with .Cordero et al. (2007, 2011)
We reproduce here the argument for the case of the T/O transition of BaTiO3 and observe that it is more general than the case of the T/M transition with little change of the orientation of , in fact it applies to any transition where the main result is a rotation of .
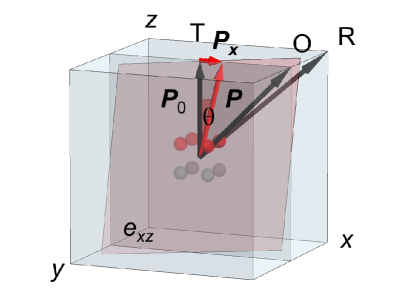
Looking at Fig. 4, we express in terms of in the T phase and of the transverse components , , where and are the rotation angles of away from the T direction in the and planes. Then, the electrostrictive coupling term permitted by symmetry, , becomes
where the Voigt notation is used also for the last pair of indexes of . Until we disregard the variation of compared to that of the transverse components , the latter behave as the order parameters of the T/O transition. In addition, as long as , we also neglect the terms quadratic in , consider as constants, or producing steplike elastic anomalies those quadratic in , and focus on
| (6) |
that is linear both in the shear stresses and and in the order parameters and . We are exactly in the situation of Eqs. (1-2) with yielding
| (7) |
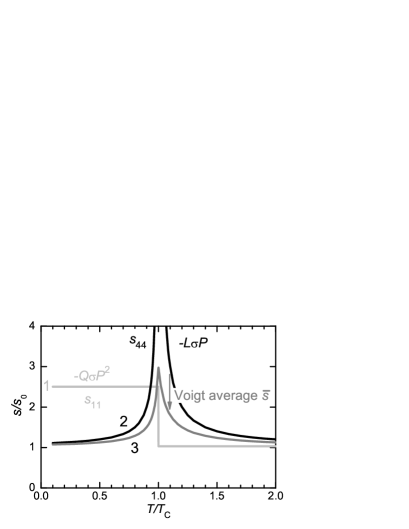
where for the O/T transition. Apart from the approximations done, including that of a 2nd order transition, the divergence in ceramic samples is trimmed down by the fact that one measures a combination of elastic constants, of which only and vanish at , while the others keep the effective modulus finite. The appearance of this type of elastic anomaly is demonstrated in Fig. 5 for the two main types of elastic responses. Curve (1) is Eq. (3) with , , corresponding for example to at ; curve (2) is Eq. (7) with , ; curve (3) is a polycrystalline average of the latter response with other constant compliances, the Voigt type average of of curve (2) with another constant compliance : .
Notice that the condition for nearly isotropic free energy, that is not applicable in the simple free energy Eq. (1) but has been amply discussed,Ishibashi and Iwata (1999); Iwata and Ishibashi (2005); Khachaturyan (2010) makes it possible the rotational instability of the polarization, and hence the T/O transition, but the above expression of the diverging compliance contains additional information related to the piezoelectric response. In fact, the magnitude of the effect is proportional to: i) the square of the electrostrictive coupling involved in the transition; ii) the square of the magnitude of the polarization, and iii) the reciprocal curvature or flatness of the free energy minimum near the transition. This means that the magnitude of the maximum of the compliance is closely correlated to that of the piezoelectric effect, and, considering that the elastic measurements on unpoled ceramics at kHz and lower frequencies are insensitive to free charges, make this type of measurement a valid tool for investigating solid solutions where large piezoelectric responses from the rotation of the polarization are expected.
The assumption leading to Eq. (7) of a transition with continuous rotations of the polarization and no change of its magnitude is akin to the introduction of a reduced free energy depending only on the polarization direction in order to study the equilibrium ranges of the possible FE phases, including the monoclinic ones.Vanderbilt and Cohen (2001) In another approach to the same problem, HudakHudak (2008) redefined the order parameter as , as above. The present approach is to neglect the variation of and focus on that of , since the analysis of the possible phases has already been done in various approximations,Haun et al. (1989); Vanderbilt and Cohen (2001); Hudak (2008) and we are only interested in the effect of the polarization rotation, hence of , on the elastic response. The presence of additional components of the order parameter will introduce additional features to the elastic anomaly, like a jump.
IV.4 The case of BaTiO3
In the Results it has been shown that the peaks in the reciprocal Young’s modulus of ceramic BaTiO3 are intrinsic and not a result of DW relaxation. To the same conclusion lead the measurements made with the torsional pendulum over a broad range of lower frequenciesCheng et al. (2003) ( Hz): the peaked softenings are independent of frequency, even though the losses contain large relaxational contributions. We do not attempt fits of the curves in terms of Eq. (7) because they would be of limited significance, considering the polycrystalline average, the overlapping of the effects of two rotational transitions of the polarization, the approximation of 2nd order transition leading to Eq. (7), and its limited validity below the rotational transition, when becomes comparable to . Nonetheless, it is clear that the peaked softenings at and also are of the type of Eq. (7).
In BaTiO3 the schematization of the spontaneous polarization changing direction but not magnitude at the FE/FE transition is not strictly valid. In fact, the transitions can also be schematized in terms of progressive localization of the Ti ions in the off-center positions belonging to a same cube face (T), edge (O) and a single off-center site (R). The experimental evidence supporting such an order-disorder character comes for example from EXAFS experiments Ravel et al. (1998) and from the observation of non null electric field gradient at the Ti site also in the cubic phase.Blinc (2004) In the model of progressive localization of Ti over the eight off-center sites, the magnitude of the polarization should increase of a factor of in the O phase with respect to the T phase, and of in the R phase. In practice, the change in the magnitude of during the various transitions is smaller and nearly continuous,Kwei et al. (1993) and appears as a consequence of the FE/PE transition; only the projection on the axis has jumps at the first order FE/FE transitions, validating the approximation of their order parameter as the rotation angle or transverse component of . In addition, the transitions in BaTiO3 are generally treated as displaciveBlinc (2004) or at least the displacive and order-disorder characters are seen to coexist.Bussmann-Holder et al. (2009) Therefore, the assumption that the FE/FE transitions in BaTiO3 consist mainly of rotations of the polarization is correct. The assumption of the smallness of the transverse components of producing its rotation is certainly valid and explains the rise of the compliance when approaching and from above, where these components only fluctuate with null mean value. The strong first order nature of the FE-FE transitions may invalidate the approximation of small magnitude of the order parameter below their temperatures and , but this does not exclude the enhancement of the elastic compliance of the Curie-Weiss type, as experiments show; simply, in these temperature regions one cannot exploit the approximation of nearly bilinear stress-polarization coupling and has to carry out the full calculations.
IV.5 Generality of the shear softening at the rotational transition of the polarization
As also shown in a recent review,Cordero (2015) PZT at the MPB is an outstanding case of maximum of the compliance associated with a rotational instability of the polarization, but there are other perovskite solid solutions that conform to the present analysis: that of PbTiO3 with the relaxor ferroelectric PbMg1/3Nb2/3O3,Algueró et al. (2005) the pseudobinary Ba(Ti0.8Zr0.2)O(Ba0.7Ca0.3)TiO3 with 0.5,Xue et al. (2011); Damjanovic et al. (2012); Cordero et al. (2014) that can be seen as a tuning close to room temperature of the sequence of transitions of BaTiO3, of K1-xNaxNbO3 (KNN) and some KNN-based compoundsGao et al. (2015) and possibly (Na1/2Bi1/2)1-xBaxTiO3 (NBT-BT).Cordero et al. (2010) The case of NBT-BT is uncertain; indeed a broad peak in the elastic compliance develops on approaching the MPB composition separating R and T phases, but there is scarcity of elastic data at higher Ba content, and it seems that the softening is connected to a strain-glass transition, involving short range ordering of strain rather than polarization rotation.Yao et al. (2013)
Instead, the K1-xNaxNbO3 system with is particularly interesting in the present context. It exhibits a C-PE/T-FE transition at K, followed by a transition to O or M phase with rotation of at K, and below there is a vertical MPB in the phase diagram between O and M phases differing in octahedral tilting rather than in the direction of .Baker et al. (2009) The piezoelectric coupling presents a sharp maximum right at , the temperature of the rotational instability, and at the MPB is lower then within the T phase,Ge et al. (2011) confirming the essential role of the rotational instability of compared to the presence of lattice disorder and MPBs.Maurya et al. (2013) The latter enhance in as much as they favor the rotational instability and extend its temperature range. Accordingly, Resonant Ultrasound Spectroscopy measurements reveal that the bulk modulus of KNN undergoes minor changes at , while the shear modulus behaves similarly to the Young’s modulus of PZT close to the MPB and of the other systems just mentioned: step at and minimum of the type of Eq. (7) at .Yi et al. (2011) Evidently, while the bulk modulus has no contributions from the volume-conserving shears, the shear modulus has an important contribution from the step of at and from the Curie-Weiss-type softening of and at . The latter must be responsible for the peak in the piezoelectric coupling.Ge et al. (2011)
We emphasize that the approximation of quasi-bilinear coupling between shear and rotation of the polarization does not depend on the fact that the rotational instability is obtained by changing only temperature, as in undoped BaTiO3, or also the composition, as in the PbTiO3-based solid solutions. The approximation holds until the order parameter is close to a rotation of the polarization and its mean value is small. The condition of smallness of the order parameter is certainly satisfied above the temperature of the transition, where its mean value is null, and possibly also in a temperature range below the transition temperature, unless a strong jump in the direction of the polarization occurs due to a marked first order character of the transition. In the latter cases one cannot avoid working out the full calculations.
V Conclusion
The relationship between enhancement of the piezoelectric coupling and rotational instability of the polarization with consequent enhancement of the shear elastic compliance has been discussed. The previous analysis of the tetragonal/monoclininc transition at the morphotropic phase boundary of PZTCordero et al. (2007, 2011) has been extended to the general case of transitions with rotation of the electric polarization, and as experimental verification the elastic response of BaTiO3 has been revisited. The important point is that the rotation of the polarization is almost linearly coupled to the corresponding shear strain, leading to an enhancement of the shear compliance of the type , whereas normally ferroelectric transitions cause steps in the elastic constants. Particularly the enhancement at , is obtained within the usual Landau theory without introducing the fluctuations. Therefore, this divergence is an intrinsic robust feature to be found whenever there is a rotational instability of the polarization, and it substantially contributes to the enhancement of the piezoelectric coefficient.
It follows that the measurement of the elastic properties is very informative in the study of the phase diagrams of solid solutions designed for obtaining giant piezoelectricity, particularly in possible cases where extrinsic defects and the associated free charges obscure the ferroelectric and piezoelectric responses.
Acknowledgements.
F.C. thanks P.M. Latino (CNR-ISC) for his technical assistance and improvements in the electronics for detecting the sample vibration.References
- Fu and Cohen (2000) H. Fu and R. E. Cohen, Nature 403, 281 (2000).
- Iwata et al. (2001) M. Iwata, H. Orihara, and Y. Ishibashi, Jpn. J. Appl. Phys. 40, 703 (2001).
- Iwata et al. (2002) M. Iwata, H. Orihara, and Y. Ishibashi, Ferroelectrics 266, 57 (2002).
- Kutnjak et al. (2006) Z. Kutnjak, J. Petzelt, and R. Blinc, Nature 441, 956 (2006).
- Damjanovic (2009) D. Damjanovic, IEEE Trans. Ultrason. Ferroelectr. Freq. Control 56, 1574 (2009).
- Zhou et al. (2012) C. Zhou, W. Liu, D. Xue, X. Ren, H. Bao, J. Gao, and L. Zhang, Appl. Phys. Lett. 100, 222910 (2012).
- Schneider et al. (2014) D. Schneider, W. Jo, J. Rödel, D. Rytz, and T. Granzow, J. Appl. Phys. 116, 044111 (2014).
- Nowick and Heller (1965) A. S. Nowick and W. R. Heller, Adv. Phys. 14, 101 (1965).
- Damjanovic (2006) D. Damjanovic, “Hysteresis in Piezoelectric and Ferroelectric Materials,” in The Science of Hysteresis: Hysteresis in materials, Volume 3, edited by G. Bertotti and I. D. Mayergoyz (Academic Press, 2006) pp. 337–465.
- Cordero (2015) F. Cordero, Materials 8, 8195 (2015).
- Salje et al. (2013) E. K. H. Salje, M. A. Carpenter, G. F. Nataf, G. Picht, K. Webber, J. Weerasinghe, S. Lisenkov, and L. Bellaiche, Phys. Rev. B 87, 014106 (2013).
- Cordero et al. (2014) F. Cordero, F. Craciun, M. Dinescu, N. Scarisoreanu, C. Galassi, W. Schranz, and V. Soprunyuk, Appl. Phys. Lett. 105, 232904 (2014).
- (13) The electrical conduction affects the elastic and anelastic response by modulating the so-called piezoelectric stiffening, when it occurs. The piezoelectric stiffening is due to the depolarization fields from the piezoelectric charges associated with the vibration, and is negligible in unpoled ceramics, unless probed with acoustic waves with wavelength smaller than the domain sizes, as with Brillouin scattering. A more complete discussion is provided in F. Cordero, F. Craciun, F. Trequattrini, C. Galassi, arXiv:1602.02799 .
- Devonshire (1951) A. F. Devonshire, Philos. Mag. 42, 333 (1951).
- Ishibashi and Iwata (1999) Y. Ishibashi and M. Iwata, Jpn. J. Appl. Phys. 38, 1454 (1999).
- Iwata and Ishibashi (2005) M. Iwata and Y. Ishibashi, “Analysis of ferroelectricity and enhanced piezoelectricity near the morphotropic phase boundary,” in Ferroelectric Thin Films, edited by M. Okuyama and Y. Ishibashi (Springer, 2005) pp. 127–148.
- Cordero et al. (2007) F. Cordero, F. Craciun, and C. Galassi, Phys. Rev. Lett. 98, 255701 (2007).
- Cordero et al. (2011) F. Cordero, F. Trequattrini, F. Craciun, and C. Galassi, J. Phys.: Condens. Matter 23, 415901 (2011).
- Berlincourt and Jaffe (1958) D. Berlincourt and H. Jaffe, Phys. Rev. 111, 143 (1958).
- Kashida et al. (1973) S. Kashida, I. Hatta, A. Ikushima, and Y. Yamada, J. Phys. Soc. Japan 34, 997 (1973).
- Courdille et al. (1978) J. M. Courdille, J. Dumas, and J. Servais, J. Physique Lett. 39, 227 (1978).
- Ko et al. (2011) J. H. Ko, T. H. Kim, K. Roleder, D. Rytz, and S. Kojima, Phys. Rev. B 84, 094123 (2011).
- Carpenter (2015) M. A. Carpenter, J. Phys.: Condens. Matter 27, 263201 (2015).
- Cheng et al. (1994) B. L. Cheng, M. Gabbay, G. Fantozzi, and W. D. Jr., J. Alloys and Compounds 211/212, 352 (1994).
- Chen et al. (2014) L. Chen, H. Wang, X. Xiong, H. Meng, and J. Zhang, Ceram. Int. 40, 6241 (2014).
- Cordero et al. (2009) F. Cordero, L. D. Bella, F. Corvasce, P. M. Latino, and A. Morbidini, Meas. Sci. Technol. 20, 015702 (2009).
- Nowick and Berry (1972) A. S. Nowick and B. S. Berry, Anelastic Relaxation in Crystalline Solids (Academic Press, 1972).
- Cheng et al. (2003) B. L. Cheng, M. Gabbay, M. Maglione, and G. Fantozzi, J. Electroceram. 10, 5 (2003).
- Strukov and Levanyuk (1998) B. A. Strukov and A. P. Levanyuk, Ferroelectric Phenomena in Crystals (Springer, 1998).
- Slonczewski and Thomas (1970) J. C. Slonczewski and H. Thomas, Phys. Rev. B 1, 3599 (1970).
- Litov and Garland (1970) E. Litov and C. W. Garland, Phys. Rev. B 2, 4597 (1970).
- Mason and Matthias (1948) W. P. Mason and B. T. Matthias, Phys. Rev. 74, 1622 (1948).
- Khachaturyan (2010) A. G. Khachaturyan, Phil. Mag. 90, 37 (2010).
- Vanderbilt and Cohen (2001) D. Vanderbilt and M. H. Cohen, Phys. Rev. B 63, 094108 (2001).
- Hudak (2008) O. Hudak, Phase Transitions 81, 1073 (2008).
- Haun et al. (1989) M. J. Haun, E. Furman, A. McKinstry, and L. E. Cross, Ferroelectrics 99, 27 (1989).
- Ravel et al. (1998) B. Ravel, E. A. Stern, R. I. Vedrinskii, and V. Kraizman, Ferroelectrics 206, 407 (1998).
- Blinc (2004) R. Blinc, Ferroelectrics 301, 3 (2004).
- Kwei et al. (1993) G. H. Kwei, A. C. Lawson, S. J. L. Billinge, and S. W. Cheong, J. Phys. Chem. 97, 2368 (1993).
- Bussmann-Holder et al. (2009) A. Bussmann-Holder, H. Beige, and G. Völkel, Phys. Rev. B 79, 184111 (2009).
- Algueró et al. (2005) M. Algueró, B. Jiménez, and L. Pardo, Appl. Phys. Lett. 87, 082910 (2005).
- Xue et al. (2011) D. Xue, Y. Zhou, H. Bao, C. Zhou, J. Gao, and X. Ren, J. Appl. Phys. 109, 054110 (2011).
- Damjanovic et al. (2012) D. Damjanovic, A. Biancoli, L. Batooli, A. Vahabzadeh, and J. Trodahl, Appl. Phys. Lett. 100, 192907 (2012).
- Gao et al. (2015) J. Gao, S. Ren, L. Zhang, Y. Hao, M. Fang, M. Zhang, Y. Dai, X. Hu, D. Wang, L. Zhong, S. Li, and X. Ren, Appl. Phys. Lett. 107, 032902 (2015).
- Cordero et al. (2010) F. Cordero, F. Craciun, F. Trequattrini, E. Mercadelli, and C. Galassi, Phys. Rev. B 81, 144124 (2010).
- Yao et al. (2013) Y. Yao, Z. Sun, Y. Ji, Y. Yang, X. Tan, and X. Ren, Sci. Technol. Adv. Mater. 14, 035008 (2013).
- Baker et al. (2009) D. W. Baker, P. A. Thomas, N. Zhang, and A. M. Glazer, Appl. Phys. Lett. 95, 091903 (2009).
- Ge et al. (2011) W. Ge, J. Li, D. Viehland, Y. Chang, and G. L. Messing, Phys. Rev. B 83, 224110 (2011).
- Maurya et al. (2013) D. Maurya, M. Murayama, A. Pramanick, W. T. Reynolds, Jr., K. An, and S. Priya, J. Appl. Phys. 113, 114101 (2013).
- Yi et al. (2011) Z. Yi, Y. Liu, M. A. Carpenter, J. Schiemer, and R. L. Withers, Dalton Trans. 40, 5066 (2011).