Does the intermediate mass black hole in LEDA 87300 (RGG 118) follow the near-quadratic – relation?
Abstract
The mass scaling relation between supermassive black holes and their host spheroids has previously been described by a quadratic or steeper relation at low masses (). How this extends into the realm of intermediate mass black holes () is not yet clear, although for the barred Sm galaxy LEDA 87300, Baldassare et al. have recently reported a nominal virial mass residing in a ‘spheroid’ of stellar mass equal to . We point out, for the first time, that LEDA 87300 therefore appears to reside on the near-quadratic – relation. However, Baldassare et al. modelled the bulge and bar as the single spheroidal component of this galaxy. Here we perform a 3-component bulgebardisk decomposition and find a bulge luminosity which is 7.7 times fainter than the published ‘bulge’ luminosity. After correcting for dust, we find that and — which is now in accord with ratios typically found in Scd–Sm galaxies. We go on to discuss slight revisions to the stellar velocity dispersion ( km s-1) and black hole mass () and show that LEDA 87300 remains consistent with the – relation, and also the near-quadratic – relation when using the reduced bulge mass. LEDA 87300 therefore offers the first support for the rapid but regulated (near-quadratic) growth of black holes, relative to their host bulge/spheroid, extending into the domain of intermediate mass black holes.
Subject headings:
galaxies: elliptical and lenticular, cD — black hole physics — galaxies: individual (LEDA 87300) — galaxies: nuclei — galaxies: photometry — galaxies: structure1. Introduction
Although stellar mass black holes (, e.g., Belczynski et al. 2010) and supermassive black holes () are now known entities (as reviewed in Kormendy & Ho 2013 and Graham 2015a), there remains a paucity of intermediate mass black holes (IMBHs). While there are well over 100 galaxies believed to contain black holes with masses in the range (e.g., Greene & Ho 2004; Jiang et al. 2011; Xiao et al. 2011; Graham & Scott 2015)111We use the notation to denote that a virial factor has been adopted. If the actual virial factor is greater or smaller than 3, then the black hole masses need to be multiplied by . The notation indicates that a virial factor was used to derive the black hole mass., few IMBH candidates are currently known222They tend to be referred to as ‘candidates’ because our scientific instruments typically do not have the ability to spatially resolve the Keplerian orbits of the gas and stars under the gravitational dominance of such black holes in other galaxies. There also remains uncertainty as to the nature and mass of many of the ultraluminous X-ray sources which might (not) be IMBHs (e.g., Feng & Soria 2011; Liu et al. 2013; Ekşi et al. 2015; Fabrika et al. 2015; Lasota et al. 2015; Zhou 2015).. However, a battery of indirect methods have been used to imply their existence. For example, perhaps the best such candidate is the hyperluminous X-ray source HLX-1 (–), situated off-center in the lenticular galaxy ESO 243-49 (Farrell et al. 2009, 2014; Soria et al. 2010; Webb et al. 2010, 2012, 2014; Davis et al. 2011; Cseh et al. 2015).
There are three groups of sources touted as IMBH candidates, namely: (i) some highly-luminous, off-center, accreting sources in galaxies, such as HLX-1 in ESO 243-49 (these hyperluminous X-ray sources are special cases among the so called ultraluminous X-ray sources)333Ultraluminous X-ray sources have ergs, while hyperluminous X-ray sources have ergs (Gao et al. 2003).; (ii) centrally-located black holes in dwarf and late-type spiral galaxies (such as LEDA 87300), and (iii) (quiescent) black hole candidates in massive globular clusters which have been proposed from dynamical modelling (Wyller 1970; Lutzgendorf et al. 2013, and references therein) but not yet convincingly detected (e.g., Lanzoni 2015 and references therein). The three groups may or may not have a distinct physical origin. For example, a source that appears as an off-center hyperluminous X-ray source today may have been the nucleus of an accreted and stripped dwarf satellite galaxy (e.g., Drinkwater et al. 2003; Seth et al. 2014), or perhaps an ejected nucleus (e.g., Gualandris & Merritt 2008; Komossa & Merritt 2008; Merritt et al. 2009). NGC 2276-3c is one such off-center X-ray source and probable IMBH, with a reported mass of (Mezcua et al. 2015a). Another off-center example can be found in the bulgeless disk galaxy NGC 4178, with a reported black hole mass of ; and the center of this galaxy may harbour another black hole, in the mass range – (Secrest et al. 2012). The non-central, ultraluminous X-ray sources in NGC 1313 (X-2, Liu et al. 2012 and Pasham et al. 2014; and X-1, Colbert & Mushotzky 1999, Miller et al. 2013, and Pasham et al. 2015), and in Zwicky 18 (Kaaret & Feng 2013) may also signal IMBHs, wih further examples given in Sutton et al. (2012). If such IMBHs (see also Oka et al. 2015) migrate to the centers of bulges through dynamical friction, it stands to reason that they may contribute to the apparent bulge-(black hole) connection if the inward bound IMBH is of significant mass compared to any black hole mass currently at the center of the galaxy in question. Thus, it is thought that the centrally-located, intermediate and supermassive black holes may not necessarily originate from a single seed, but rather many.
While a few IMBH candidates are known, as noted above, the galaxy LEDA 87300 (referred to as “RGG 118” by Baldassare et al. 2015; hereafter BRGG15)444These authors renamed LEDA 87300 after the initials of their previous paper which had included this galaxy in their sample: Reines, Greene & Geha (2013)., hosts a particularly interesting IMBH candidate because it is centrally located in this galaxy’s bulge. This galaxy can therefore be used to probe the low-mass end of the (black hole mass)-(host bulge) diagrams and scaling relations. These include (i) the – relation (Ferrarese & Merritt 2000; Gebhardt et al. 2000; Park et al. 2012; Kormendy & Ho 2013; McConnell & Ma 2013; Sabra et al. 2015; Savorgnan & Graham 2015c) and the offset nature of barred galaxies (Graham 2008; Hu 2008; Graham et al. 2011), (ii) the near-linear – relation555The host spheroid’s stellar mass, , and dynamical mass, , have been used in different studies. (Magorrian et al. 1998; McLure & Dunlop 2002; Marconi & Hunt 2003; Häring & Rix 2004; Sani et al. 2011; Vika et al. 2012; Beifiori et al. 2012; Läsker et al. 2014b) and importantly the steeper – relation at low masses (Graham & Scott 2013, 2015; Savorgnan et al. 2015; see also Laor 1998, 2001), and (iii) the – relation (Graham et al. 2001; Savorgnan et al. 2013) involving the Sérsic (1963) index of the host spheroid, i.e. the radial distribution of stars.
The nature of these black hole scaling relations at low masses is not only of interest for probing into the realm of the largely ‘missing’ population of IMBHs, but is expected to provide insight into the seed black holes that grew into supermassive black holes (e.g., Madau & Rees 2001; Miller & Hamilton 2002; Portegies Zwart & McMillan 2002; Johnson et al. 2013; Latif et al. 2013). For example, Alexander & Natarajan (2014), Madau et al. (2014) and Lupi et al. (2015) illustrate how stellar mass black holes can rapidly grow into black holes via radiatively inefficient super-critical accretion, bypassing studies which start with initial seed black holes with masses . While Kormendy & Ho (2013) advocate that black holes in low-mass (pseudo)bulges are randomly offset to the lower right of the – relations defined by high mass “classical” bulges — an idea introduced by Graham (2008) and Hu (2008) — Graham (2012, 2015a) has since shown that a steeper than linear relation exists for pseudobulges and low-mass classical bulges alike. In particular, a near-quadratic relation was found for the Sérsic spheroids () while a near-linear relation was found for the core-Sérsic spheroids (). Savorgnan et al. (2015) have since revealed that an alternative division may be between the early-type (red sequence) galaxies (with ) and the late-type (blue sequence) galaxies which define a relation . Using virial black hole masses, the bend in the – relation can now be seen all the way down to (Graham & Scott 2015). Spheroids with IMBH candidates are needed to test if this steep relation continues to yet lower masses.
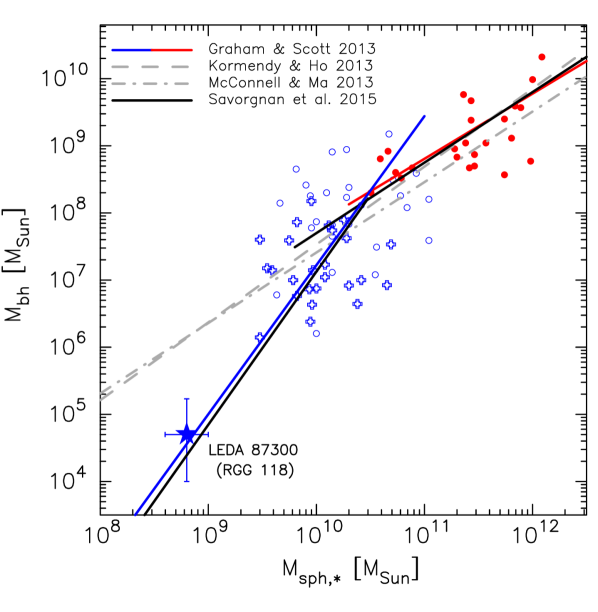
BRGG15 did not explore whether the black hole in LEDA 87300 agrees (or not) with the steep – relation. Figure 1 shows the location of LEDA 87300 in the – diagram according to the masses derived by BRGG15 for LEDA 87300. Importantly, it additionally shows, for the first time, where this IMBH resides relative to the extrapolation to low masses of the near-quadratic scaling relation constructed at higher masses. The agreement is striking. This is important because, if confirmed, it suggests that we can predict the masses of (at least the more massive) IMBHs.
It is obviously important to perform a correct decomposition of a galaxy’s light if we are to obtain the physical properties of the spheroidal component and properly explore the (black hole)-(host spheroid) connection. This is true at both ends of the mass spectrum. For example, isolating the spheroid light from that of the galaxy has recently resulted in the discovery of the missing population of compact, massive spheroids observed at high-redshifts (referred to as red nuggets by Damjanov et al. 2009) but previously thought to be absent in the nearby Universe (Graham, Dullo & Savorgnan 2015). At the same time, other studies which fit large-scale disks to some of these nearby galaxies which actually contain intermediate-scale disks has resulted in the under-estimation of the spheroid mass and thus the erroneous claims of overly high ratios, as explained in Savorgnan & Graham (2015b).
Here we provide an independent decomposition for the barred galaxy LEDA 87300, to check if its low-mass spheroidal component follows the near-quadratic – relation as seen in Figure 1. Although BRGG15 performed a bulge/disk decomposition, they reported a bulge-to-disk ratio of 0.3. This is unusually high for an Sm galaxy (see Graham & Worley 2008), and appears to have arisen because they lumped the bar plus bulge light together, fitting for what we call the “barge”. This also means that the Sérsic index for the bulge component of this galaxy is yet to be measured.
In Section 2 we present the imaging data and our decomposition analysis, refitting for both the “barge”+disk and the bar+bulge+disk. To be thorough, in Section 3 we additionally revisit the derived black hole mass, the spheroid velocity dispersion, and the X-ray data which suggested the presence of an active galactic nucleus (AGN). Specifically, in subsection 3.1 we revise the nominal black hole mass using the optimal virial -factor for barred galaxies. In subsection 3.2 we provide an estimate of the stellar rather than the gas velocity dispersion, and in subsection 3.3 we report on our confirmation of the X-ray detection made by BRGG15. In Section 4 we present our revised location of LEDA 87300 in the –, –, and – diagrams. We provide a brief discussion of its location in these diagrams and comment on potential future targets.
BRGG15 did not identify “RGG118” with any pre-existing galaxy, and we therefore provide some additional references and information here. LEDA 87300 is located at R.A. = 15 23 05.0, Dec = +11 45 53 (J2000: Paturel et al. 2000) and is also known as PGC 87300; Paturel et al. 1989)666The Catalogue of Principal Galaxies.. BRGG15 have reported a virial mass of , with a (1-sigma) range from (1–17), for the black hole located at the center of this catalogued low surface brightness777“Low surface brightness galaxies” have a central disk surface brightness more than 1 mag arcsec-2 fainter than the canonical Freeman (1970) value of 21.65 B mag arcsec-2., Sm galaxy (LSBC F725-V01; Schombert et al. 1992). It is also a known HI radio source: AGC 258125 (Haynes et al. 2011)888The “Arecibo General Catalog” is a private database maintained by Martha P. Haynes and Riccardo Giovanelli. from the Arecibo Legacy Fast Arecibo L-band Feed Array (ALFALFA) survey. LEDA 87300 has a reported heliocentric velocity of 7278 km s-1 in Schombert et al. (1992), which was confirmed by Haynes et al. (2011) who report a value of 728371 km s-1. Correcting for (Virgo + Great-Attractor + Shapley)-infall (Mould et al. 2000, via NED999http://ned.ipac.caltech.edu/), this heliocentric velocity equates to a recessional velocity of 793677 km s-1, or a Hubble expansion redshift of 0.02647. Using km s-1 Mpc-1, and , this gives a (comoving radial) distance of 112.7 Mpc and a physical scale of 532 parsec per arcsecond (Wright 2006).
2. Optical Image Analysis
2.1. Data

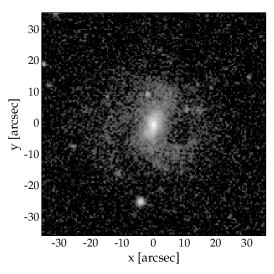
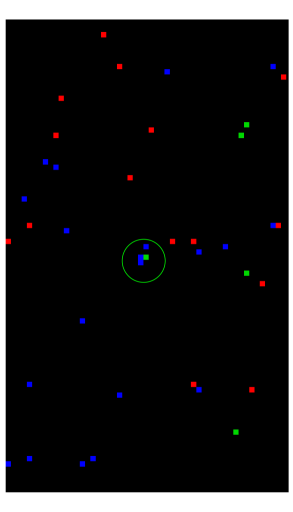
While there is a 2008 Canada France Hawaii Telescope (CFHT)/MegaCam image of the field containing LEDA 87300 (Yee et al. Proposal ID 07AC22), unfortunately LEDA 87300 falls right in the middle of the CCD mosaic gap (which we mention to spare some readers from looking for it there). We have therefore obtained images available from the Sloan Digital Sky Survey (SDSS) Data Release Nine (Ahn et al. 2012)101010http://www.sdss3.org/dr9. Figure 2 displays an image of LEDA 087300 created by us using data from two Sloan runs in the DR9 Science Archive111111http://dr9.sdss3.org/fields/, identified by the Run, Camcol, and Field numbers (005322, 2, 0142) and (003996, 6, 0175).

We aligned the -, -, and -band images from these two runs by rotating and shifting the images, and then we stacked the images from all three filters to increase the signal-to-noise. It is apparent from Figure 2 that LEDA 87300 is a barred spiral galaxy. The morphology of LEDA 87300 is not unusual, and there are plenty of other nearby ( Mpc), relatively face-on, late-type barred spiral galaxies which resemble LEDA 87300, such as NGC 3319, NGC 4519, NGC 7741 and UGC 6983 (Tully 1988). In Figure 3 we show the color map for LEDA 87300. This was created after convolving the images with the better ‘seeing’ with a Gaussian function in order to degrade them to the spatial resolution (1.27) of the poorest image. While the color map is noisy in the outer regions of this pixel-by-pixel representation, without binning, the inner regions already hint at a somewhat blue bar upon which a small, relatively redder spheroid may be superimposed.
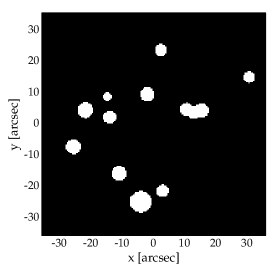
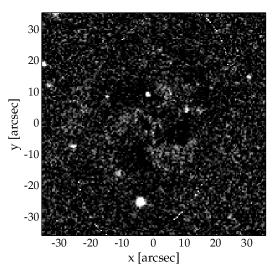
For our analysis, we used the two available datasets to generate a single image for each of the two bands that we modelled. We did this for the - and -band images, but not the -band image because it is too faint. Galaxy images are not always well approximated by 2-dimensional models whose components have fixed ellipticity () and position angle (P.A.). Instead, we have used 1-dimensional ‘light profiles’ and the associated geometrical profiles which track a galaxy’s variation in , P.A., and isophotal deviation from ellipses — as quantified using Fourier harmonics. Collectively, this suite of 1-dimensional profiles describe and recreate the symmetrical elements of a 2D image. The Isofit task (Ciambur 2015) was used to obtain both the major-axis and the geometric-mean-axis (equivalent to a circularized) light profile, and its accompaniments at each radius (i.e. position angle, ellipticity, Fourier terms). As can be seen in the right hand panel of Figure 4, the 1D profiles perform well at representing the galaxy and reveal three spiral arms in the residual map. To avoid redundancy, we do not show the similar set of -band image, mask and residual map, although we do note that the -band profiles could only be reliably extracted to half the radial extent of the -band profile.
2.2. Modelling
Having extracted the - and -band light profiles (shown in Figures 5 and 6), they have then been decomposed into model components (point-source, bar, bulge, disk) using the Profiler software (Ciambur 2016, in preparation). ‘Profiler’ finds the optimal decomposition of a light profile through an iterative minimization process using the Levenberg-Marquardt algorithm (Marquardt 1963). At each iteration step, the components are summed together and then convolved with the point spread function (PSF) — using a hybrid (Fast Fourier Transform)-based and numerical convolution scheme — to generate a model profile. Profiler can use a Gaussian, Moffat, or any user-supplied vector to describe the PSF. The best-fit values for the galaxy model parameters are then found by minimizing the root mean square scatter , where is the number of fitted data points in the light profile and is the number of model parameters.
It should be remembered that reflects the quality of the global fit. It can therefore be beneficial to also watch the behavior of the residual profile over specific regions of interest. While a (signal-to-noise)-weighted fitting scheme can be used, it is generally preferable not to do so due to the myriad of potential biases (above the Poissonian noise expected from the galaxy) affecting the inner light profiles of galaxies where the signal is highest. Sources of bias can include central dust, a faint AGN, additional components such as a nuclear star cluster or a nuclear disk, and errors in the PSF, all of which become more important when using a (signal-to-noise)-weighted scheme. While this danger is considerably reduced through the use , one is more susceptible to biases from an incorrect sky-background subtraction when using this statistic. In the case of LEDA 87300, it has a non-exponential disk which we avoided by restricting the radial range used, and thus we are not using data that could be overly susceptible to errors from the sky-background subtraction process. In passing we note that even if we had modelled the disk with a broken, inner and outer, exponential function (e.g., Pohlen et al. 2002; Pohlen & Trujillo 2005), it would not have affected our results for the spheroid.
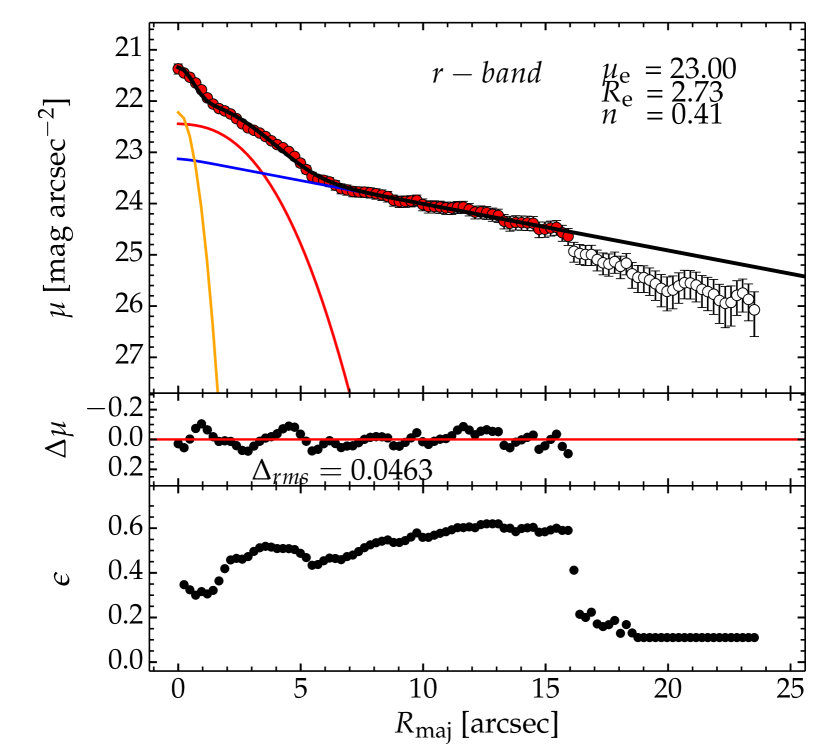
The imexamine task in IRAF was used to fit Gaussian profiles to a dozen stars in each of the final - and -band images, and the mean Full Width Half Maximum (FWHM) used to characterize our Gaussian PSF. Initially we fit the same model components as BRGG15, namely a point-source, an exponential disk, plus a single Sérsic (1963) function121212 A review of the Sérsic function, which was popularized by Caon et al. (1993) and reproduces an exponential and Gaussian profile when equals 1.0 and 0.5, respectively, can be found in Graham & Driver (2005). for the combined bar+bulge (“barge”), as shown in Figure 5.
We obtained a notably smaller -band Sérsic index for the barge than BRGG15 (0.41 compared to 1.13), and a barge luminosity which is less than two times as bright. Our uncorrected -band barge magnitude of 19.29 mag and disk magnitude of 16.82 mag give a barge-to-disk flux ratio of 0.10. Given that the bulge-to-disk flux ratio is typically just a few percent for Scd–Sm galaxies (e.g., Graham & Worley 2008), this is additional evidence (beyond simply looking at the 2D image and the 1D profile) that the bar is likely contributing to the barge light131313We obtained a disk color of 0.410.03 and a bluer barge color of 0.37, albeit with an uncertainty of 0.05.. While at some stage bars become bulges within the regime of secular disk evolution (e.g., Hohl 1975; Combes & Sanders 1981; Combes et al. 1990), and thus one could perhaps argue for the use of barge light rather than bulge light, in the following section we have proceeded by performing a bulgebardisk decomposition, as done for the galaxies with supermassive black holes (e.g., Läsker et al. 2014a; Savorgnan & Graham 2015a, and references therein).
2.2.1 A barbulgedisk decomposition
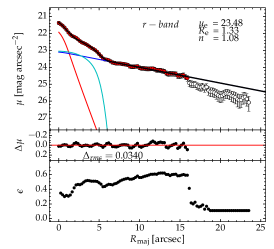
We used a modified Ferrers profile to describe the bar (Ferrers 1877; Peng et al. 2010). The best-fitting bulgebardisk model parameters are provided in Table 1. Of immediate note is the improved quality of the fit, evinced by the smaller residuals around the inner 5 and the reduced rms scatter (Figure 6). With a major-axis, -band half light radius equal to two-thirds of a kpc, the central component is neither an AGN point source nor a star cluster but instead the bulge component of this galaxy. Its size is typical for late-type spiral galaxies (e.g., Graham & Worley 2008), further suggesting that there is nothing unusual with LEDA 87300.
BRGG15 included a central point source in their model (see their Figure 3 and our Figure 5), but we do not see evidence of a possible fourth component after our new model has described the three major components of this galaxy. Future Hubble Space Telescope images would be valuable for assessing the contribution/existence of any optical AGN point source. A nuclear star cluster may also be expected, and the prescription in Graham (2015b) suggests that it would be a few million solar masses if associated with the black hole in LEDA 87300, and thus it would have an -band magnitude prior to dust extinction of mag (assuming a stellar mass-to-light ratio of unity). This is too faint for us to detect in the SDSS image. A nuclear disk is yet another option, but again, our attempts to fit a fourth component did not detect anything.
| Component | or | or | Magcorr1 | Magcorr2 | ||||||
| [mag arcsec-2] | [arcsec / kpc] | [arcsec / kpc] | [mag] | [mag] | [mag] | [mag] | [mag] | |||
| (1) | (2) | (3) | (4) | (5) | (6) | (7) | (8) | (9) | (10) | (11) |
| SDSS -band major-axis | ||||||||||
| Spheroid | 23.48 | 1.33 / 0.71 | … | … | 1.08 | … | … | … | … | … |
| Disk | 23.06 | … | 11.57 / 6.16 | … | 1.00 | … | … | … | … | … |
| Bar | 23.05 | … | 5.32 / 2.83 | (1.94, 0.01) | … | … | … | … | … | … |
| SDSS -band equivalent-axis | ||||||||||
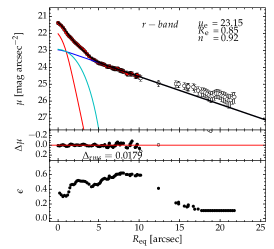
| Spheroid | 23.15 | 0.85 / 0.45 | … | … | 0.92 | 20.85 | 20.71 | 20.05 | ||
| Disk | 22.91 | … | 6.49 / 3.45 | … | 1.00 | 16.85 | 16.71 | 16.54 | ||
| Bar | 22.90 | … | 5.82 / 3.10 | (9.99, 0.01) | … | 20.44 | 20.30 | 20.13 | ||
| Galaxy | … | … | … | … | … | 16.78 | 16.64 | 16.46 | ||
| SDSS -band equivalent-axis | ||||||||||
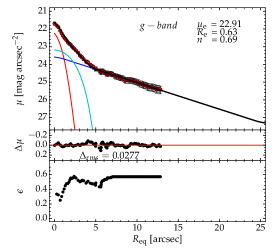
| Spheroid | 22.91 | 0.63 / 0.34 | … | … | 0.69 | 21.39 | 21.21 | 20.35 | ||
| Disk | 23.53 | … | 7.23 / 3.85 | … | 1.00 | 17.24 | 17.06 | 16.84 | ||
| Bar | 23.15 | … | 4.61 / 2.45 | (5.79, 0.01) | … | 20.68 | 20.50 | 20.28 | ||
| Galaxy | … | … | … | … | … | 17.17 | 16.99 | 16.75 | ||
Column 1: Model components fit to the galaxy light-profile. Column 2: Effective surface brightness of the spheroid, or central surface brightness of the disk or bar. Column 3: Effective half light radius. Column 4: Disk or bar scale-length. Column 5: Shape parameters of the Ferrers profile. Column 6: Sérsic index. Column 7: Total observed, i.e. uncorrected, apparent magnitude (AB mag). Column 8: Galactic-extinction and redshift-dimming corrected apparent magnitude. Column 9: Absolute magnitude associated with column 8. Column 10: Apparent magnitude from column 8 now further corrected for dust internal to the galaxy and the galaxy’s inclination (Driver et al. 2008). Column 11: Fully corrected absolute magnitude associated with column 10. The magnitudes correspond to the fitted components integrated to infinity.
Integrating the surface brightness profiles (to ) of the individual model components that were fit to the equivalent-axis light profile (Figure 6) has the advantage that it can be done using spherical symmetry (see the Appendix in Ciambur 2015 to understand how this recovers the total galaxy light). The resultant luminosity of each component is included in Table 1, and collectively gave a total, uncorrected -band magnitude of 17.17 mag for the galaxy. For reference, Garnier et al. (1996) reported mag (RC3 system, de Vaucouleurs et al. 1991) while the ‘SDSS Model’ magnitude from Data Release 6 (Adelman-McCarthy et al. 2008)141414http://classic.sdss.org/dr6 gave a -band magnitude of 17.08 mag (AB). Our preferred band is of course the redder -band, however the -band parameters derived here are used to a) check for consistency with the literature as just done and b) obtain a color for the bulge (see later in this section).
We explored the impact on the -band bulge magnitude due to the uncertainty in the sky-background. Due to the large SDSS images, and thus the large number of sky pixels surrounding LEDA 87300, the uncertainty in the median sky value, equal to the standard deviation of the sky values () divided by , is tiny. As such, it is the variation and uncertainty of the individual sky values in the pixels co-occupied by the galaxy which are important. Having pixels make up each isophote reduces this uncertainty to at each isophotal radius. Nonetheless, at large radii, this error in the sky-subtraction (such that the median sky-value for the isophote does not match the global median sky-value that was subtracted) dominates over the Poissonian scatter in the galaxy light. We repeated the galaxy decomposition with the uncertainty () added to, and then subtracted from, the optimal light profile. Given that our fit was performed over the inner 10–16 arcseconds, this did not have a big impact, with the spheroid’s magnitude changing by () mag. Adding and subtracting three times the uncertainty in the sky-background, the bulge magnitude changed by () mag, the bar magnitude changed by just () mag, and the disk magnitude changed by () mag.
Unsurprisingly, changing the width of the PSF by a rather large 25% had almost no affect on the disk parameters, with the magnitude changing by just 0.03 mag. While the bar was found to be similarly stable, the spheroid magnitude changed by 0.4 mag (45%) and the Sérsic index changed by 6%.
| Component | ||||||||
|---|---|---|---|---|---|---|---|---|
| [] | [] | [] | [] | [] | [] | |||
| (1) | (2) | (3) | (4) | (5) | (6) | (7) | (8) | (9) |
| Spheroid | 0.48 | 0.50 | 1.76 | 0.84 | 0.88 | 0.30 | 1.06 | 0.93 |
| Disk | 19.12 | 0.35 | 1.20 | 23.00 | 22.20 | 0.29 | 1.03 | 22.92 |
| Bar | 0.70 | 0.20 | 0.82 | 0.58 | 0.81 | 0.14 | 0.71 | 0.57 |
Column 1: Model components fit to the galaxy light profile. Column 2: -band solar luminosity from column 8 of Table 1. Column 3: color derived from column 8 of Table 1. Column 4: Adopted stellar mass-to-light ratio following Bell et al. (2003). Column 5: Stellar mass. Column 6: -band solar luminosity from column 10 of Table 1. Column 7: color derived from column 10 of Table 1. Column 8: Adopted stellar mass-to-light ratio following Bell et al. (2003). Column 9: Stellar mass.
We next corrected the observed, apparent magnitude for the usual influences. First, in the SDSS - and -band there is 0.122 and 0.084 mag, respectively, of extinction in the direction of LEDA 87300 due to dust in our Galaxy (Schlafly & Finkbeiner 2011). We also brightened the observed magnitudes by mag, allowing for cosmological redshift dimming. Together, this gives us the first corrected magnitudes shown in Table 1. These entries can be compared with the results from BRGG15. In particular, their stated “bulge” (barge) luminosity is 7.7 times brighter than our bulge luminosity, and more than 3 times as bright as our combined bulge plus bar luminosity. This is because of the way the bar in BRGG15’s modelling resulted in a Sérsic component which extended beyond the end of the bar, eating into the disk light.
With the corrections mentioned above, we obtain a disk color of 0.35, consistent with the value of reported in BRGG15. We additionally obtain a bulge color of , and a blue bar colour of . Unlike the long bars of early-type spiral galaxies with bar colors that are similar to or redder than their host (e.g., Prieto et al. 2001), the shorter bars of late-type spiral galaxies tend to be bluer than their galaxy due to recent and ongoing star formation along the bar, revealing that they are young and growing (e.g., Elmegreen & Elmegreen 1985; Kennicutt 1994; Phillips 1996; Gadotti & de Souza 2006; Fanali et al. 2015, and references therein). The sites along the bar in LEDA 87300 with a color of 0.1–0.2 (Figure 3) are indicative of this.
The second set of corrections that we apply are the combined inclination and dust corrections from Driver et al. (2008). At , beyond the radial range where the spiral arms dominate the ellipticity of LEDA 87300, the ellipticity profile rapidly drops to about 0.10.1 by 20, although the low ratio of signal-to-noise makes it hard to know the exact value. For a disk inclination corresponding to an isophotal ellipticity of 0.1 (i.e. close to face-on), the bulge needs to be corrected / brightened by 0.86 and 0.66 mag in the - and -band, while both the disk and bar (made out of the disk) should be brightened by 0.22 and 0.17 mag in the - and -band, respectively151515If the adopted ellipticity is wrong by 0.1, then the corrections to the bulge magnitude will change by just 0.02–0.06 mag; although it should be noted that while the mean corrective prescription from Driver et al. (2008) is appropriate for an ensemble of galaxies, its applicability for individual galaxies will vary. This makes it difficult to assess the error on the bulge magnitude due to dust.. The second last column in Table 1 shows the apparent magnitude of the galaxy’s components after this additional correction is applied. These corrected apparent magnitudes were then converted into absolute magnitudes using a distance modulus of 35.26, and used to obtain a second set of colors. The -band absolute magnitudes were converted into solar luminosities using an absolute magnitude for the Sun of AB mag (Table 2).
2.2.2 Stellar Masses
We use the color to estimate the -band stellar mass-to-light () ratios161616We had hoped to use the -band luminosity and the relation from Taylor et al. (2011), however, as noted before, the signal-to-noise ratio in the combined -band image was too low.. Following BRGG15, we use the prescription in Bell et al. (2003) which is such that
| (1) |
and reportedly has an accuracy of 20% (Bell et al. 2003). Given that dust reddening roughly moves one along this relation (see Figure 6 in Bell et al. 2003, and Figure 13 in Driver et al. 2007), it can be applied to either the dust-reddened or the dust-corrected component’s luminosity and color. The results are shown in Table 2, using both approaches, and the spheroid masses agree within 10%. Our preference is to use the dust-corrected luminosities and masses (column 9 in Table 2). Using the stellar population synthesis model of Conroy et al. (2009), one has from Roediger & Courteau (2015) that . This yields mass-to-light ratios for the spheroid which are some 30–40% smaller than those obtained via the Bell et al. (2003) prescription. Given the uncertainties on the bulge luminosity arising from the uncertainty in (i) the sky-background, (ii) the PSF, (iii) the inclination of the disk, (iv) the color of the spheroid, (v) the uncertainty associated with the conversion from light-to-mass, and (vi) at some small level even the adopted mask (Figure 4), we consider the spheroid stellar mass to be accurate to within a factor of 2, although it could be as high as 3 if the inclination/dust correction was terribly wrong.
LEDA 87300 shows up in the GALaxy Evolution eXplorer All-Sky Survey Source Catalog (GALEXASC J152304.87+114552.0) with NUV (m) = 18.690.08 mag. Brightening for 0.20 mag of Galactic extinction and 0.06 mag of cosmological redshift dimming gives 18.43 mag. Using the galaxy magnitude from column 8 of Table 1, we have that NUV for the galaxy. Together with the galaxy color , LEDA 87300 resides in the middle of the ‘blue cloud’ of star forming galaxies (Chilingarian & Zolotukhin 2012; their Figure 1), and is more blue than the average Sc galaxies (Chilingarian & Zolotukhin 2012; their Figure 3), as expected for an Sm galaxy. Its ongoing star formation therefore supports the low stellar mass-to-light ratios of 0.71–1.76 that we find (Table 2).
For comparison with BRGG15, and therefore not considering the inclination and internal dust correction, we find that BRGG15 obtained a slightly fainter luminosity for their disk () than us (: Table 2, column 2), due to their fainter central surface brightness and smaller scale-length for their fitted disk (see their Figure 3). However, they also derived a redder disk and higher stellar mass-to-light ratio than us. This gave them a stellar mass of (), which agrees well with our optimal disk mass of . As noted before, BRGG15 obtained a notably (7.7) brighter ‘spheroid’ () than us (), due to their fitted model being biased by the bar light. BRGG15 report a “bulge” (barge) stellar mass of (), while our optimal bulge mass is , or 7.5 times less massive.
BRGG15 obtained a bulge-to-disk mass ratio () which is what one typically finds in early-type disk galaxies rather than in late-type spiral galaxies (e.g., Laurikainen et al. 2010). Our bulge-to-disk mass ratio is 4%, in good agreement with values seen in Scd–Sm galaxies (Graham & Worley 2008).
3. Additional parameters and data
3.1. The black hole mass
Using a ‘reduced’ virial factor (which equates to an -factor equal to 4), BRGG15 reported black hole mass estimates ranging from (2.7–6.2) when using three different techniques for modeling the narrow emission lines, plus an associated factor of 2.7 uncertainty arising from the empirical relations used to estimate virial black hole masses. This gives a black hole mass range from to about their adopted nominal value of , where .
Building on Onken et al. (2004) who reported an -factor of 5.51.7, Graham et al. (2011) also investigated the optimal -factor by calibrating the virial black hole masses obtained from reverberation mapping studies of AGN against the – relation defined by other galaxies with directly measured black hole masses. Using both a ‘forward’ and an ‘inverse’ linear regression to construct the – relation — the latter is required for minimizing the sample selection bias that arises from the need to spatially resolve the black holes’s sphere-of-influence — — an -factor of around 3 was derived for the full sample. Moreover, they reported why this was an upper limit because of several factors, including radiation pressure (Marconi et al. 2008, who also report ). Repeating this analysis, the forward and inverse linear regressions from Park et al. (2012) yielded similar results to Graham et al. (2011), and an -factor of 3 is commonly used in the literature (e.g., Kaspi et al. 2000; Xiao et al. 2011; Jiang et al. 2011). However when dealing only with AGN in barred galaxies, Graham et al. (2011) found that the optimal -factor171717Graham et al. (2011) reported optimal -factors of for unbarred galaxies, for barred galaxies (many of which may have pseudobulges), and for the ensemble. was (and this may still be too high, see Shankar et al. 2016). The optimal virial black hole mass for LEDA 87300 is thus a factor of 2.3/4 times smaller than reported by BRGG15, and we therefore adopt a mass of with a range from (0.6–9.6) (). This is still consistent with the value adopted by BRGG15.
Our mass ratio for LEDA 87300 is 0.031%, which is 2.4 times larger than the value of 0.013% obtained by BRGG15. Our ratio is 16 times smaller than the median value of 0.49% reported by Graham & Scott (2013) for massive spheroids with partially depleted cores, and 22 times smaller than the median value of 0.68% reported by Savorgnan et al. (2015) for their early-type galaxy sample181818The intrinsic scatter observed in these ratios is 0.4 dex..
3.2. The stellar velocity dispersion
There is no available stellar velocity dispersion () for LEDA 87300. However BRGG15 measured a gas velocity dispersion of km s-1 from the [NII] line. They assumed 0.15 dex of scatter and zero mean offset between measurements of the stellar and the gas velocity dispersion in other galaxies, and reported km s-1. There is however a well known tendency for gas to have a lower velocity dispersion than stars (e.g., Vega Beltrán et al. 2001, their Figure 3; Barth et al. 2008, their Figure 10), with Ho (2009) reporting an average ratio of 0.8. That is, the stellar velocity dispersion is typically 25% higher than the gas velocity dispersion. Although, this ratio is less clear for the Scd-Sm galaxies for which there is more scatter, with Figure 1 from Ho (2009) revealing that systems with –35 km s-1 have –100 km s-1. Figure 11d from Xiao et al. (2011) reveals this same behavior at low velocity dispersions, and that one expects 30–50 km s-1 if km s-1. We adopt this more constrained range rather than an average value of 50–60 km s-1 which might be expected from Ho (2009). Adding the km s-1 measurement uncertainty in quadrature with a km s-1 range, we conservatively adopt km s-1.
Given that spheroids with low Sérsic indices have rather flat, luminosity-weighted, velocity dispersion profiles (e.g., Graham & Colless 1997, their Figure 7), no discernible difference between the central () and effective () aperture velocity dispersion is expected for the spheroidal component of LEDA 87300. Of course the presence of discs and bars can bias attempts to measure the spheroid’s velocity dispersion, and increasingly so as one moves to apertures of larger radii in disk galaxies. This is because one will increasingly acquire more of a galaxy velocity dispersion than a bulge velocity dispersion as the radial range is increased. For this reason, one should be wary of or , which may be systematically biased if the disc light and dynamics contribute more in galaxies with lower mass black holes.
3.3. The X-ray Data
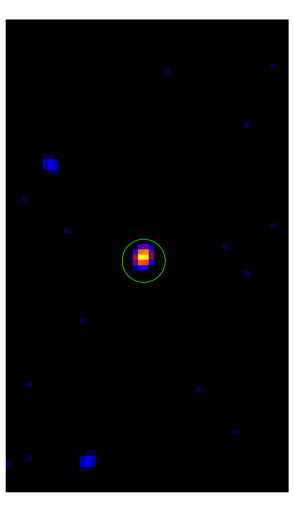
Given the current scarcity, and thus importance, of IMBHs, we have additionally re-analyzed the Chandra X-ray Observatory Advanced CCD Imaging Spectrometer (ACIS) data for LEDA 87300. We provide confirmation of the analysis in BRGG15, and therefore we do not discuss this data at any great length. Within the 5.5 hour exposure, 4 X-ray photons were detected within a circle of radius 2 centered on the galaxy (see Figure 7). Given the average background count was just 0.25 for an area of this size, we have a 90% confidence limit of between 1 and 8 photons (Kraft et al. 1991). That is, we have at least a 90% detection of a point-like X-ray source in LEDA 87300. We acknowledge that “point-like” actually means within 1 or 500 pc, and thus the source of the X-rays could be an AGN, a compact starburst nucleus, or a combination of both.
None of the four photons appeared in the 0.3–1.5 keV band, they all had energies in the 1.5–5 keV range, with just one having an energy between 1.5 and 2.0 keV. It is interesting that there are no photons with energies in the 0.3–1.5 keV band because it requires the soft band to be absorbed by a column density of neutral hydrogen of at least and more likely cm-2. Assuming a plausible photon index191919The photon index is defined as where is the number flux of photons, e.g. Ishibashi & Courvoisier (2010). for the slope of the X-ray spectrum somewhere in the range –, one detected photon corresponds to a 2–10 keV luminosity erg s-1. As noted by BRGG15, the bolometric luminosity is therefore erg s-1 if using (Marconi et al. 2004; Vasudevan & Fabian 2007).
The rest of the galaxy does not appear to contribute to the X-ray emission, and is not expected to. For a total galaxy stellar mass of , the expected X-ray luminosity from the low-mass X-ray binaries (LMXBs) is erg s-1 (Gilfanov 2004). In the Chandra exposure, this would correspond to only 1/3 of a photon in 5.5 hours. An additional component may come from high-mass X-ray binaries (HMXBs), however if the star formation rate is less than 0.5 yr-1, then we do not expect HMXBs to contribute significantly.
4. Discussion
BRGG15 reported an ellipticity of 0.63 for their “bulge” component of LEDA 87300 and wrote that this value is in accord with expectations for pseudobulges. However because their “bulge” model was dominated by the bar (and perhaps the start of the spiral arms), they over-estimated the ellipticity of the actual spheroid which likely has an ellipticity half of this value (see Figure 6). As discussed in Graham (2014), pseudobulges are particularly difficult to identify, and as such we do not label the bulge component of LEDA 87300 one way or another.
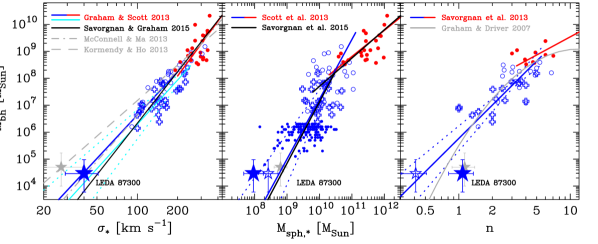
Figure 8 shows the location of LEDA 87300 in the –, –, and – diagrams. We have used the virial black hole mass estimated with the optimal virial factor for barred galaxies (section 3.1), and we now discuss each panel in turn, starting with the – diagram.
BRGG15 showed that their black hole mass and adopted stellar velocity dispersion for LEDA 87300 placed it on the extrapolation of the – relation from Kormendy & Ho (2013) which was constructed using a sample which Kormendy & Ho (2013) considered not to be ‘pseudobulges’. In the left panel of Figure 8, one can see that our slightly revised location of LEDA 87300 places it on the – relation from McConnell & Ma (2013) for barred and unbarred galaxies combined. LEDA 87300 additionally agrees well with the – relations from Graham & Scott (2013) for both barred and unbarred galaxies, which are themselves consistent with the relations presented in Graham et al. (2011).
Graham (2008) and Hu (2008) showed that barred galaxies — which may contain pseudobulges, classical bulges, or simultaneously both a classical bulge and a pseudobulge (e.g., Erwin et al. 2003) — have a tendency to sometimes be offset from the – relation in the direction of higher velocity dispersions, as explained by Hartmann et al. (2014). It was pointed out in section 3.2 that the stellar velocity dispersion may be 50-60 km s-1. If correct, LEDA 87300 would remain within the 1-sigma uncertainty of the – relation for barred galaxies shown in Figure 8. The uncertainties associated with the black hole mass and stellar velocity dispersion for LEDA 87300, coupled with the uncertainty on the slope and intercept of the various – scaling relations, are such that we are not advocating any one relation over another, but expanding upon the consistency noted by BRGG15 between LEDA 87300 and the extrapolation of the – relations to lower velocity dispersions. Finally, we note that these relations may yet turn out to be upper envelopes (Batcheldor 2010), with Subramanian et al. (2015) presenting evidence for this with a sample of low surface brightness galaxies for which the black hole masses, estimated using the broad H line, fell well below the various – relations.
Including over 100 AGN with virial black hole mass estimates from Jiang et al. (2011), Graham & Scott (2015) extended the – diagram from down to . They revealed that the bulges of these AGN follow the near-quadratic relation presented in Scott et al. (2013) for galaxies without partially depleted cores, i.e. for classical spheroids and pseudobulges alike. Mezcua et al. (2015b) present additional AGN supporting such a steep relation, bolstering support for theoretical models which predict a steep scaling relation at these masses (e.g., Fontanot et al. 2006, 2015; Dubois et al. 2012; Bonoli et al. 2014; Bellovary et al. 2014). Building on BRGG15, we extend the – diagram down to through the inclusion of LEDA 87300 (Figure 8, middle panel). The difference here is that we have used the (dust-corrected) bulge mass rather than a combination of the bulge plus bar mass. This had the effect of shifting LEDA 87300 to the left in this diagram. Although the previously reported location of LEDA 87300 (Figure 1) better matches the near-quadratic relation from Scott et al. (2013), within the 1-sigma uncertainties there remains agreement between LEDA 87300 and this steep relation. Lastly, we note that while the use of the barge or galaxy luminosity will spread the data to the right in the – diagram, star formation activity may also produce over-luminous bulges, as discussed by Busch et al. (2015).
LEDA 87300 can be seen to roughly follow the observed trend in the – diagram (Figure 8, right panel). However LEDA 87300 is offset below the linear – relation. For a Sérsic index , and a typical 25% uncertainty202020Equation 3 from Graham & Driver (2007) reveals how this uncertainty propagates through to the predicted black hole mass. An intrinsic scatter of 0.3 dex in the direction has been used here., the log-linear relation from Savorgnan et al. (2013) is such that , and gives , or equivalently . The lower 1-sigma bound to this mass range () is two times higher than our upper range to the virial black hole mass (0.96). The curved – relation from Graham & Driver (2007) does better, but this is not our preferred solution because it does not separate galaxies into core-Sérsic versus Sérsic galaxies, or early-type versus late-type galaxies.
It should be born in mind that LEDA 87300 is just one data point, and the scaling relations are still being refined. Close agreements today may not be close agreements tomorrow, and thus one should be mindful of the uncertainty associated with the relations and the data. More IMBH data would be welcome, In this regard, while Reines et al. (2013) have identified candidate IMBHs in dwarf galaxies, and Sartori et al. (2015) are pursuing AGN in low-mass galaxies, Graham & Scott (2013) have identified targets in the small bulges of disk galaxies. Graham & Scott (2013) named 41 candidate galaxies for hosting an intermediate mass black hole (IMBH) based on the spheroid -band magnitudes reported in the Dong & De Robertis (2006) study of galaxies with low-luminosity AGN. These spheroid magnitudes are being re-derived (Ciambur et al., in preparation) with new images having better spatial resolution than the Two Micron All Sky Survey (2MASS) data212121http://www.ipac.caltech.edu/2mass images used by Dong & De Robertis (2006). This will provide improved spheroid magnitudes and thus better black hole mass estimates. An observational campaign (Webb et al., in preparation) to collect 5 GHz radio data and X-ray data will provide an independent means for estimating/confirming these black hole masses via the ‘fundamental plane of black hole activity’ (Merloni et al. 2003; Falcke et al. 2004; Dong & Wu 2015; Liu et al. 2015; Nisbet & Best 2016) and hopefully enable the further population of the black hole scaling diagrams at masses below .
References
- Adelman-McCarthy et al. (2008) Adelman-McCarthy, J. K., Agüeros, M. A., Allam, S. S., et al. 2008, ApJS, 175, 297
- Ahn et al. (2012) Ahn, C. P., Alexandroff, R., Allende Prieto, C., et al. 2012, ApJS, 203, 21
- Alexander & Natarajan (2014) Alexander, T., & Natarajan, P. 2014, Science, 345, 1330
- Baldassare et al. (2015) Baldassare, V.F., Reines, A.E., Gallo, E., Greene, J.E. 2015, ApJ, 809, L15 (BRGG15)
- Barth et al. (2008) Barth, A. J., Greene, J. E., & Ho, L. C. 2008, AJ, 136, 1179
- Batcheldor (2010) Batcheldor, D. 2010, ApJ, 711, L108
- Beifiori et al. (2012) Beifiori, A., Courteau, S., Corsini, E. M., & Zhu, Y. 2012, MNRAS, 419, 2497
- Belczynski et al. (2010) Belczynski, K., Bulik, T., Fryer, C. L., et al. 2010, ApJ, 714, 1217
- Bell et al. (2003) Bell, E. F., McIntosh, D. H., Katz, N., & Weinberg, M. D. 2003, ApJS, 149, 289
- Bellovary et al. (2014) Bellovary, J., Holley-Bockelmann, K., Gültekin, K., et al. 2014, MNRAS, 445, 2667
- Bonoli et al. (2014) Bonoli, S., Mayer, L., & Callegari, S. 2014, MNRAS, 437, 1576
- Busch et al. (2015) Busch, G., Fazeli, N., Eckart, A., et al. 2015, A&A, in press (arXiv:1511.00904)
- Caon et al. (1993) Caon, N., Capaccioli, M., & D’Onofrio, M. 1993, MNRAS, 265, 1013
- Chilingarian & Zolotukhin (2012) Chilingarian, I. V., & Zolotukhin, I. Y. 2012, MNRAS, 419, 1727
- Ciambur (2015) Ciambur, B.C. 2015, ApJ, 810, 120
- Colbert & Mushotzky (1999) Colbert, E. J. M., & Mushotzky, R. F. 1999, ApJ, 519, 89
- Combes et al. (1990) Combes, F., Debbasch, F., Friedli, D., Pfenniger, D. 1990, A&A, 233, 82
- Combes & Sanders (1981) Combes F., Sanders R.H., 1981, A&A, 96, 164
- Conroy et al. (2009) Conroy, C., Gunn, J. E., & White, M. 2009, ApJ, 699, 486
- Cseh et al. (2015) Cseh, D., Webb, N. A., Godet, O., et al. 2015, MNRAS, 446, 3268
- Damjanov et al. (2009) Damjanov, I., McCarthy, P. J., Abraham, R. G., et al. 2009, ApJ, 695, 101
- Davis et al. (2011) Davis, S. W., Narayan, R., Zhu, Y., et al. 2011, ApJ, 734, 111
- de Vaucouleurs et al. (1991) de Vaucouleurs, G., de Vaucouleurs, A., Corwin, H. G., Jr., et al. 1991, Third Reference Catalogue of Bright Galaxies. Springer, New York (RC3)
- Dong & Wu (2015) Dong, A.-J., & Wu, Q. 2015, MNRAS, 453, 3447
- Dong & De Robertis (2006) Dong, X.Y., & De Robertis, M.M. 2006, AJ, 131, 1236
- Drinkwater et al. (2003) Drinkwater, M. J., Gregg, M. D., Hilker, M., et al. 2003, Nature, 423, 519
- Driver et al. (2007) Driver, S. P., Popescu, C. C., Tuffs, R. J., et al. 2007, MNRAS, 379, 1022
- Driver et al. (2008) Driver, S. P., Popescu, C. C., Tuffs, R. J., et al. 2008, ApJ, 678, L101
- Dubois et al. (2012) Dubois, Y., Devriendt, J., Slyz, A., & Teyssier, R. 2012, MNRAS, 420, 2662
- Ekşi et al. (2015) Ekşi, K. Y., Andaç, İ. C., Çıkıntoğlu, S., et al. 2015, MNRAS, 448, L40
- Elmegreen & Elmegreen (1985) Elmegreen, B. G., & Elmegreen, D. M. 1985, ApJ, 288, 438
- Erwin et al. (2003) Erwin, P., Beltrán, J. C. V., Graham, A. W., & Beckman, J. E. 2003, ApJ, 597, 929
- Fabrika et al. (2015) Fabrika, S., Ueda, Y., Vinokurov, A., Sholukhova, O., & Shidatsu, M. 2015, Nature Physics, 11, 551
- Falcke et al. (2004) Falcke, H., Körding, E., & Markoff, S. 2004, A&A, 414, 895
- Fanali et al. (2015) Fanali, R., Dotti, M., Fiacconi, D., Haardt, F. 2015, MNRAS, 454, 3641
- Farrell et al. (2009) Farrell, S.A., Webb, N.A., Barret, D., Godet, O., & Rodrigues, J.M. 2009, Nature, 460, 73
- Farrell et al. (2014) Farrell, S. A., Servillat, M., Gladstone, J. C., et al. 2014, MNRAS, 437, 1208
- Feng & Soria (2011) Feng, H., & Soria, R. 2011, Nature, 55, 166
- Ferrarese & Merritt (2000) Ferrarese, L., & Merritt, D. 2000, ApJ Lett., 539, L9
- Ferrers (1887) Ferrers N.M. 1877, Quart. J. Pure Appl. Math., 14, 1
- Fontanot et al. (2006) Fontanot, F., Monaco, P., Cristiani, S., & Tozzi, P. 2006, MNRAS, 373, 1173
- Fontanot et al. (2015) ontanot, F., Monaco, P., & Shankar, F. 2015, MNRAS, 453, 4112
- Freeman (1970) Freeman, K. C. 1970, ApJ, 160, 811
- Gadotti & de Souza (2006) Gadotti, D. A., & de Souza, R. E. 2006, ApJS, 163, 270
- Gao et al. (2003) Gao, Y., Wang, Q. D., Appleton, P. N., & Lucas, R. A. 2003, ApJ, 596, L171
- Garnier et al. (1996) Garnier, R., Paturel, G., Petit, C., Marthinet, M. C., & Rousseau, J. 1996, A&AS, 117, 467
- Gebhardt et al. (2000) Gebhardt, K., Bender, R., Bower, G., et al. 2000, ApJ Lett., 539, L13
- Gilfanov (2004) Gilfanov, M. 2004, MNRAS, 349, 146
- Graham (2008) Graham, A. W. 2008, ApJ, 680, 143
- Graham (2012) Graham, A. W. 2012, ApJ, 746, 113
- Graham (2014) Graham, A. W. 2014, in Structure and Dynamics of Disk Galaxies, Edited by M.S. Seigar and P. Treuthardt, ASP Conf. Ser., 480, 185
- Graham (2015a) raham, A.W. 2015a, in “Galactic Bulges”, E. Laurikainen, R.F. Peletier, D. Gadotti (Eds.), Springer International Publishing, Astrophysics and Space Science Library, v.418, p.263-313
- Graham (2015b) raham, A.W. 2015b, in Star Clusters and Black Holes in Galaxies across Cosmic Time, R.Spurzem, F.Liu, S.Li, Y.Meiron (ed.), IAU Symp. 312, in press (arXiv:1412.5715)
- Graham & Colless (1997) Graham, A., & Colless, M. 1997, MNRAS, 287, 221
- Graham & Driver (2007) Graham, A.W., & Driver, S.P. 2007, ApJ, 655, 77
- Graham & Driver (2005) Graham, A.W., & Driver, S.P. 2005, PASA, 22(2), 118
- Graham et al. (2015) Graham, A. W., Dullo, B. T., & Savorgnan, G. A. D. 2015, ApJ, 804, 32
- Graham et al. (2001) Graham, A. W., Erwin, P., Caon, N., & Trujillo, I. 2001, ApJ, 563, L11
- Graham et al. (2011) Graham, A. W., Onken, C. A., Athanassoula, E., & Combes, F. 2011, MNRAS, 412, 2211
- Graham & Scott (2013) Graham, A. W., & Scott, N. 2013, ApJ, 764, 151
- Graham & Scott (2015) Graham, A. W., & Scott, N. 2015, ApJ, 798, 54
- Graham & Worley (2008) Graham, A. W., & Worley, C. C. 2008, MNRAS, 388, 1708
- Greene & Ho (2004) Greene, J. E., & Ho, L. C. 2004, ApJ, 610, 722
- Greene & Ho (2005) Greene, J. E., & Ho, L. C. 2005, ApJ, 630, 122
- Gualandris & Merritt (2008) Gualandris, A., & Merritt, D. 2008, ApJ, 678, 780
- Häring & Rix (2004) Häring, N., & Rix, H.-W. 2004, ApJ Lett., 604, L89
- Hartmann et al. (2014) Hartmann, M., Debattista, V.P., Cole, D.R., Valluri, M., Widrow, L.M., Shen, J. 2014, MNRAS, 441, 1243
- Haynes et al. (2011) Haynes, M. P., Giovanelli, R., Martin, A. M., et al. 2011, AJ, 142, 170
- Ho (2009) Ho, L.C. 2009, ApJ, 699, 638
- Hohl (1975) Hohl F. 1975, IAU Symp., 69, 349
- Hu (2008) Hu, J. 2008, MNRAS, 386, 2242
- Ishibashi & Courvoisier (2010) Ishibashi, W., & Courvoisier, T. J.-L. 2010, A&A, 512, A58
- Jedrzejewski (1987) Jedrzejewski, R. I. 1987, MNRAS, 226, 747
- Jiang et al. (2011) Jiang, Y.-F., Greene, J. E., Ho, L. C., Xiao, T., & Barth, A. J. 2011, ApJ, 742, 68
- Johnson et al. (2013) Johnson, J. L., Whalen, D. J., Li, H., & Holz, D. E. 2013, ApJ, 771, 116
- Kaaret & Feng (2013) Kaaret, P., & Feng, H. 2013, ApJ, 770, 20
- Kaspi et al. (2000) Kaspi, S., Smith, P. S., Netzer, H., et al. 2000, ApJ, 533, 631
- Kennicutt (1994) Kennicutt, R. C., Jr. 1994, in Mass-Transfer Induced Activity in Galaxies, ed. Isaac Shlosman, Cambridge: Cambridge University Press, p.131
- Komossa & Merritt (2008) Komossa, S., & Merritt, D. 2008, ApJ, 683, L21
- Kormendy & Ho (2013) Kormendy, J., & Ho, L. C. 2013, ARA&A, 51, 511
- Kraft et al. (1991) Kraft, R. P., Burrows, D. N., & Nousek, J. A. 1991, ApJ, 374, 344
- Lanzoni (2015) Lanzoni, B. in Star Clusters and Black Holes in Galaxies Across Cosmic Time, IAU Symp. 312, R.Spurzem, F.Liu, S.Li, Y.Meiron (eds), (arXiv:1502.04479)
- Laor (1998) Laor, A. 1998, ApJ, 505, L83
- Laor (2001) Laor, A. 2001, ApJ, 553, 677
- Läsker et al. (2014a) Läsker, R., Ferrarese, L., & van de Ven, G. 2014a, ApJ, 780, 69
- Läsker et al. (2014) Läsker, R., Ferrarese, L., van de Ven, G., & Shankar, F. 2014, ApJ, 780, 70
- Latif et al. (2013) Latif, M. A., Schleicher, D. R. G., Schmidt, W., & Niemeyer, J. 2013, MNRAS, 433, 1607
- Laurikainen et al. (2010) Laurikainen, E., Salo, H., Buta, R., Knapen, J. H., & Comerón, S. 2010, MNRAS, 405, 1089
- Liu et al. (2012) Liu, J., Orosz, J., & Bregman, J. N. 2012, ApJ, 745, 89
- Liu et al. (2013) Liu, J.-F., Bregman, J. N., Bai, Y., Justham, S., & Crowther, P. 2013, Nature, 503, 500
- Liu et al. (2015) Liu, X., Han, Z., & Zhang, Z. 2015, Astrophysics & Space Sciences, in press (arXiv:1511.08608)
- Lasota et al. (2015) Lasota, J.-P., King, A. R., & Dubus, G. 2015, ApJ, 801, L4
- Lupi et al. (2015) Lupi, A., Haardt, F., Dotti, M., Fiacconi, D., Mayer, L., Madau, P. 2015, MNRAS, in press (arXiv:1512.02651)
- Lützgendorf et al. (2013) Lützgendorf, N., Kissler-Patig, M., Neumayer, N., et al. 2013, A&A, 555, A26
- Madau et al. (2014) Madau, P., Haardt, F., & Dotti, M. 2014, ApJ, 784, L38
- Madau & Rees (2001) Madau, P., & Rees, M. J. 2001, ApJ, 551, L27
- Magorrian et al. (1998) Magorrian, J., Tremaine, S., Richstone, D., et al. 1998, AJ, 115, 2285
- Marconi et al. (2008) Marconi, A., Axon, D. J., Maiolino, R., et al. 2008, ApJ, 678, 693
- Marconi & Hunt (2003) Marconi, A., & Hunt, L. K. 2003, ApJ, 589, L21
- Marconi et al. (2004) Marconi, A., Risaliti, G., Gilli, R., et al. 2004, MNRAS, 351, 169
- Marquardt (1963) Marquardt, D. 1963, SIAM Journal on Applied Mathematics, 11(2), 431
- McConnell & Ma (2013) McConnell, N. J., & Ma, C.-P. 2013, ApJ, 764, 184
- McLure & Dunlop (2002) McLure, R. J., & Dunlop, J. S. 2002, MNRAS, 331, 795
- Merloni et al. (2003) Merloni, A., Heinz, S., & di Matteo, T. 2003, MNRAS, 345, 1057
- Merritt et al. (2009) Merritt, D., Schnittman, J. D., & Komossa, S. 2009, ApJ, 699, 1690
- Mezcua et al. (2015a) Mezcua, M., Roberts, T. P., Lobanov, A. P., & Sutton, A. D. 2015a, MNRAS, 448, 1893
- Mezcua et al. (2015b) Mezcua, M., Civano, F., Fabbiano, G., Miyaji, T., & Marchesi, S. 2015b, ApJ, in press (arXiv:1511.05844)
- Miller & Hamilton (2002) Miller, M. C., & Hamilton, D. P. 2002, MNRAS, 330, 232
- Miller et al. (2013) Miller, J. M., Walton, D. J., King, A. L., et al. 2013, ApJL, 776, L36
- Mould et al. (2000) Mould, J. R., Huchra, J. P., Freedman, W. L., et al. 2000, ApJ, 529, 786
- Nisbet & Best (2016) Nisbet, D. M., & Best, P. N. 2016, MNRAS, 455, 2551
- Oka et al. (2015) Oka, T., Mizuno, R., Miura, K., Takekawa, S. 2016, ApJ, 816, L7
- Onken et al. (2004) Onken, C. A., Ferrarese, L., Merritt, D., et al. 2004, ApJ, 615, 645
- Park et al. (2012) Park, D., Kelly, B. C., Woo, J.-H., & Treu, T. 2012, ApJS, 203, 6
- Pasham et al. (2014) Pasham, D. R., Strohmayer, T. E., & Mushotzky, R. F. 2014, Nature, 513, 74
- Pasham et al. (2015) Pasham, D.R., Cenko, S.B., Zoghbi, A., Mushotzky, R.F., Miller, J., Tombesi, F. 2015, ApJL, 811, L11
- Paturel et al. (1989) Paturel, G., Fouque, P., Bottinelli, L., & Gouguenheim, L. 1989, A&AS, 80, 299
- Paturel et al. (2000) Paturel, G., Petit, C., Garnier, R., & Prugniel, P. 2000, A&AS, 144, 475
- Peng et al. (2010) Peng, C. Y., Ho, L. C., Impey, C. D., & Rix, H.-W. 2010, AJ, 139, 2097
- Phillips (1996) Phillips, A. C. 1996, IAU Colloq. 157: Barred Galaxies, 91, 44
- Pohlen et al. (2002) Pohlen, M., Dettmar, R.-J., Lütticke, R., & Aronica, G. 2002, A&A, 392, 807
- Pohlen & Trujillo (2006) Pohlen, M., & Trujillo, I. 2006, A&A, 454, 759
- Portegies Zwart & McMillan (2002) Portegies Zwart, S. F., & McMillan, S. L. W. 2002, ApJ, 576, 899
- Prieto et al. (2001) Prieto, M., Aguerri, J. A. L., Varela, A. M., & Muñoz-Tuñón, C. 2001, A&A, 367, 405
- Reines et al. (2013) Reines, A. E., Greene, J. E., & Geha, M. 2013, ApJ, 775, 116
- Roediger & Courteau (2015) Roediger, J.C., Courteau, S. 2015, MNRAS, 452, 3209
- Sabra et al. (2015) Sabra, B. M., Saliba, C., Abi Akl, M., & Chahine, G. 2015, ApJ, 803, 5
- Sani et al. (2011) Sani, E., Marconi, A., Hunt, L. K., & Risaliti, G. 2011, MNRAS, 413, 1479
- Sartori et al. (2015) Sartori, L. F., Schawinski, K., Treister, E., et al. 2015, MNRAS, 454, 3722
- Savorgnan & Graham (2015a) Savorgnan, G.A.D., & Graham, A. W. 2015a, ApJ, in press (arXiv.1511.07446)
- Savorgnan & Graham (2015b) Savorgnan, G. A. D., & Graham, A. W. 2015b, MNRAS, in press (arXiv:1511.05654)
- Savorgnan & Graham (2015c) Savorgnan, G. A. D., & Graham, A. W. 2015c, MNRAS, 446, 2330
- Savorgnan et al. (2013) Savorgnan, G.A.D., Graham, A. W., Marconi, A., et al. 2013, MNRAS, 434, 387
- Savorgnan et al. (2015) Savorgnan, G.A.D., Graham, A. W., Marconi, A., & Sani, E. 2015, ApJ, in press (arXiv:1511.07437)
- Schlafly & Finkbeiner (2011) Schlafly, E. F., & Finkbeiner, D. P. 2011, ApJ, 737, 103
- Schombert et al. (1992) Schombert, J. M., Bothun, G. D., Schneider, S. E., & McGaugh, S. S. 1992, AJ, 103, 1107
- Scott et al. (2013) Scott, N., Graham, A. W., & Schombert, J. 2013, ApJ, 768, 76
- Secrest et al. (2012) Secrest, N. J., Satyapal, S., Gliozzi, M., et al. 2012, ApJ, 753, 38
- Sérsic (1963) Sérsic, J.-L. 1963, Boletin de la Asociacion Argentina de Astronomia, vol.6, p.41
- Seth et al. (2014) Seth, A., van den Bosch, R., Mieske, S., et al. 2014, Nature, 513, 398
- Shankar et al. (2016) Shankar, F., Mariangela, B., Sheth, R.K., et al. 2016, MNRAS, submitted
- Shuder (1981) Shuder, J. M. 1981, ApJ, 244, 12
- Soria et al. (2010) Soria, R., Hau, G.K.T., Graham, A.W., Kong, A.K.H., Kuin, N.P.M., Li, I.-H., Liu, J.-F. & Wu, K. 20 10, MNRAS, 405, 870
- Subramanian et al. (2016) Subramanian, S., Ramya, S., Das, M., et al. 2016, MNRAS, 455, 3148
- Sutton et al. (2012) Sutton, A. D., Roberts, T. P., Walton, D. J., Gladstone, J. C., & Scott, A. E. 2012, MNRAS, 423, 1154
- Taylor et al. (2011) Taylor, E. N., Hopkins, A. M., Baldry, I. K., et al. 2011, MNRAS, 418, 1587
- Tremaine et al. (2002) Tremaine, S., Gebhardt, K., Bender, R., et al. 2002, ApJ, 574, 740
- Tully (1988) Tully, R. B. 1988, Nearby galaxies catalog, Cambridge and New York, Cambridge University Press
- van den Bosch et al. (2012) van den Bosch, R. C. E., Gebhardt, K., Gültekin, K., et al. 2012, Nature, 491, 729
- Vasudevan & Fabian (2007) Vasudevan, R. V., & Fabian, A. C. 2007, MNRAS, 381, 1235
- Vega Beltrán et al. (2001) Vega Beltrán, J. C., Pizzella, A., Corsini, E. M., et al. 2001, A&A, 374, 394
- Vika et al. (2012) Vika, M., Driver, S. P., Cameron, E., Kelvin, L., & Robotham, A. 2012, MNRAS, 419, 2264
- Webb et al. (2010) Webb, N. A., Barret, D., Godet, O., et al. 2010, ApJ, 712, L107
- Webb et al. (2012) Webb, N., Cseh, D., Lenc, E., et al. 2012, Science, 337, 554
- Webb et al. (2014) Webb, N. A., Godet, O., Wiersema, K., et al. 2014, ApJ, 780, L9
- Wright (2006) Wright, E. L. 2006, PASP, 118, 1711
- Wyller (1970) Wyller, A. A. 1970, ApJ, 160, 443
- Xiao et al. (2011) Xiao, T., Barth, A. J., Greene, J. E., et al. 2011, ApJ, 739, 28
- Zhou (2015) Zhou, X.-L. 2015, New Astronomy, 37, 1