Rate equation model of phototransduction into the membranous disks of mouse rod cells
Abstract
A theoretical model was developed to investigate the rod phototransduction process in the mouse. In particular, we explored the biochemical reactions of several chemical components that contribute to the signaling process into/around the membranous disks in the outer segments of the rod cells. We constructed a rate equation model incorporating the molecular crowding effects of rhodopsin according to experimental results, which may hinder the diffusion of molecules on the disk membrane. The present model could effectively reproduce and explain the mechanisms of the following phenomena observed in experiments. First, the activations and relaxation of the wild-type mouse rod cell progressed more slowly than those of mutant cells containing half the amount of rhodopsin on the disk membrane. Second, the strong photoactivated state of the cell was sustained for a longer period when the light stimuli were strong. Finally, the lifetime of photoactivation exhibited a logarithmic increase with increasing light strength given exposure to strong light stimuli.
I Introduction
Most living systems have evolved the ability to sense and adapt to environmental fluctuations through several internal biochemical processes. Photoreception is one of the most important signaling processes for several higher organisms. This signaling process starts from activation of the photoreceptor rhodopsin on the membranous disk, which is regulated by negative feedback through activation and repression cascades mediated by several membrane-associated proteins, low-molecular weight signaling molecules, and ions in each rod cellrod1 ; rod2 ; rod3 ; rod4 .
Recent studies have demonstrated the phenomenon of the crowding of macromolecules in individual cells, in which the volume fraction of macromolecules is much higher than that observed under typical in vitro conditions crowd1 ; crowd2 ; crowd3 ; crowd4 ; crowd5 ; crowd6 ; crowd7 ; crowd8 ; crowd9 ; crowd10 ; crowd11 ; crowd12 ; crowd13 ; crowd14 ; crowd15 ; crowd16 ; crowd17 ; crowd18 ; crowd19 ; crowd20 . Such “molecular crowding” is considered to highly suppress the diffusion of moleculescrowd2 ; crowd3 ; crowd4 ; crowd5 ; crowd6 ; crowd7 ; crowd8 ; crowd9 ; crowd10 ; crowd11 ; crowd12 ; crowd13 ; crowd14 ,which ultimately hinders intra-cellular reaction processes but also often enhances protein folding crowd15 ; crowd16 , stabilization of the intracellular architecture crowd17 ; crowd18 , and processive phosphorylations of ERK mitogen-associated protein kinase and associated gene transcriptioncrowd19 ; crowd20 ; mem1 . In a molecular crowding scenario, the volume fractions of macromolecules on the membranes of cells and in intra-cellular organelles are also considered to be as high as that in the cytoplasm mem1 ; mem2 ; mem3 ; mem4 ; mem5 ; mem6 . Thus, molecular crowding on the cell membrane is expected to have more complex effects for tightly controlled biochemical processes such as the pattern formations of signaling proteins mem6 .
A high volume fraction of the photoreceptor rhodopsin tends to be maintained in the outer segments of the membranous disks of the rod cells of vertebratesrod1 ; rod2 ; rod3 ; rod4 ; rod5 ; rod6 ; rod7 ; rod8 . Indeed, this high packing density of photoreceptors has been proposed to ensure efficient photon capture. On the other hand, recent experimental studies of mouse rod cells showed that activation and relaxation of this signaling pathway in wild type (WT) mouse rod cells was slower than those of mutant cell containing half the amount of rhodopsin on the disk membrane. This fact suggests that the crowding of rhodopsin might actually limit the diffusion of signaling proteins on the disk membrane to slow down the phototransduction processes after rhodopsin activation. rod4 ; rod7 .
Recently, theoretical and experimental studies revealed the influence of the crowding of rhodopsin or other molecules on the disk membrane on the activation of the phototransduction processrod6 ; rod8 ; rod9 . Moreover, the influence of the secondary messengers in the cytoplasm, such as , disk membrane shape, and multi-level phosphorylations of rhodopsin on the phototransductions have also been explored with reaction diffusion modelsrod7 ; rod10 ; rod11 ; rod12 ; rod13 ; rod14 . These studies have successfully depicted the photoresponse behaviors in response to weak light stimuli. However, some of the mechanisms to explain characteristic phenomena observed in experiments have not yet been sufficiently explained yet, including: (i) activation and relaxation of the WT mouse rod cell progresses more slowly than those of mutant cells containing half the amount of rhodopsin on the disk membrane; (ii) the time interval of the photoactive state is drastically prolonged in response to strong light stimuli compared to weak stimuli; (iii) the lifetime of photoactivation exhibits a logarithmic increase with light strength under strong light stimuli.
To address these questions, in this study, we constructed a theoretical model of the whole process of phototransduction occurring in the outer segment of WT and mutant mouse rod cells in order to unveil the characteristics and the mechanism underlying the observed photoresponse behaviors for a wide range of light intensities. Recent experiments have shown that types of signaling components such as proteins, low-molecular weight molecules, ions, and their complexes contribute to these processes. Based on these experimental findings, we constructed a rate equation model incorporating the molecular crowding effects of rhodopsin that could hinder the diffusion and reactions of molecules on the disk membrane. We confirmed that the present model can qualitatively reproduce and explain the light intensity-dependent temporal phototransduction behaviors, lifespan of activation, and rhodopsin volume fraction-dependent restrictions of the phototransduction speed in mouse rod cells, as observed in experiments.
II Model and methods
II.1 Signaling components and reaction network of phototransduction
The molecular networks of vertebrate phototransduction have been extensively investigated experimentally rod1 ; rod2 ; rod3 ; rod4 . After activation of rhodopsin () as (∗ indicates the active form) by a light stimulus, the signal goes through a series of activation and relaxation states via the following reactions processes (Fig. 1).
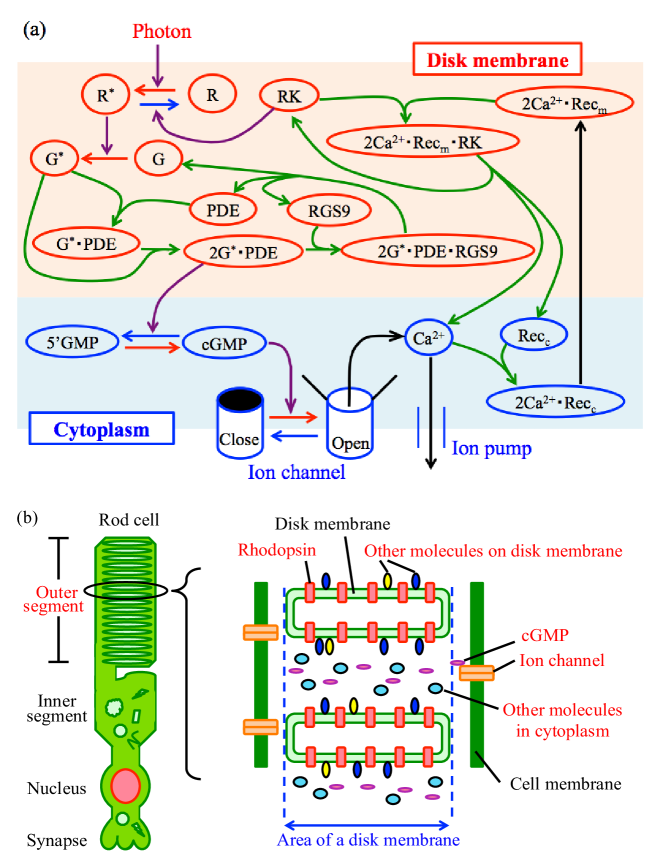
Phototransduction starts with the activation of the G-protein transducin (), which diffuses on the disk membrane via collision with photoactivated rhodopsin (), as
| (1) |
where catalyzes the exchange of a GTP for a GDP on . then diffuses along the membrane surface, and two molecules eventually bind to a single cyclic GMP phosphodiesterase (PDE) to construct a complex, , as
| (2) |
A membrane-associated regulator of G-protein signaling, , binds to as
| (3) |
Then, the G-bound GTP molecules are hydrolyzed and this complex is dissociated as
| (4) |
is synthesized by guanylate-cyclase-activating proteins in the cytoplasm
| (5) |
which opens the channel () as
| (6) |
Here, and indicate the closed and open channel, respectively, and refers to the number of molecules required to open a channelrod1 ; rod2 ; rod3 . In this study, we assume . The hydrolysis of is accelerated by as
| (7) |
which results in the closure of channels in the membrane.
flows into the cytoplasm of the outer segment through the channel and is extruded by an exchanger as
| (9) |
If the concentrations of become reduced in the outer segment, the rod cell moves into a hyperpolarization state, which can activate the downstream neurons.
Two s bind to the cytoplasmic protein recoverin () as
| (10) |
and bind to the membrane as
| (11) |
( indicates on membrane.).
Rhodopsin kinase () accelerates the inactivation of through inducing the phospholyration of activated rhodopsin as
| (12) |
which triggers the relaxation of this phototransduction. is then inactivated by coupling with as
| (13) |
and eventually returns to the active form through dissociation of the complex as
| (14) |
II.2 Rate equation model
Recent experiments have mainly focused on the activation and relaxation of cells in response to an instantaneous light stimulus under dark conditions rod1 ; rod2 ; rod3 ; rod4 ; rod7 . Thus, we here simulate the same general situations using the following rate equation model.
The density of signaling components () on the surface of a disk membrane in the outer segment of a rod cell is given as i) [Number of component on one surface of the disk membrane] / [Area of the disk membrane] for signaling components on the disk membrane, and ii) [Half of the number of component between two neighboring membrane disks] / [Area of the disk membrane] for signaling components in the cytoplasm (Fig. 1(b)). Here, the density of the channel is given by [Number of channels] / [Area of the cell membrane]. It is noted that each signaling component is assumed to occupy a finite area on the disk membrane. Thus, the total concentration of signaling components on the disk membrane is limited.
Now, for simplicity, we define the concentration of signaling component , , as a rescaled density of signaling component obeying the limitations
| (15) |
where indicates the total concentration of signaling components (rhodopsin, G-protein, , , , and ) on the disk membrane.
Based on the reaction processes described in the previous subsection, the rate equations of after instantaneous exposure to a light stimulus are obtained as
| (16) |
| (17) |
| (18) |
| (19) |
| (20) |
| (21) |
| (22) |
| (23) |
| (24) |
| (25) |
| (26) |
| (27) |
| (28) |
| (29) |
| (30) |
| (31) |
| (32) |
and
| (33) |
Here, since the time scales of gene expression and protein degradation are much slower than those of the phenomena of focus, we assume conservation of the total concentrations of the following molecules, , in the outer segment of the rod cell:
| (34) |
| (35) |
| (36) |
| (37) |
| (38) |
| (39) |
| (40) |
and
| (41) |
II.3 Implemetation of light stimuli and evaluation of photoactivation of the cell
In the present arguments, the instantaneous light stimulus is implemented as follows. It is noted that the time course of the presented rate equation model always induces relaxation to a unique stationary state for a given parameter set such as reaction coefficients and , independent of the initial concentrations of the signaling components. Here, the concentrations of signaling components of this stationary state correspond to those of the rod cells kept in darkness for a sufficiently long period of time. Thus, to consider the behaviors of this model in response to an instantaneous light stimulus, we set the state of the system at as follows. First, we make the system relax to the stationary state with long-term simulation. Here, relaxes to . Next, after inducing the relaxation, we change the concentration of from to ( from to ), and set the time as . Here, is considered to be proportional to the intensity of the light stimulus. Then, we define as the light intensity.
In experiments, the photoactivation of cells was estimated by monitoring the flux through channels, , as , where indicates the flux in the darknessrod1 ; rod2 ; rod3 ; rod4 ; rod7 . In the present model, the flux is proportional to . Thus, we measure
| (42) |
to estimate the photoactivation of the system.
II.4 Assumptions of the parameters for WT and mutant models
The present rate equation model involves a large number of parameters such as the reaction coefficients and the total numbers of chemical components. Now, we assume the following parameter sets for the model to most accurately reproduce and explain several of the experimental results observed in mouse rod cells.
First, we set the total concentration of each signaling component according to the following assumptions for constructing both the WT model and mutant model of cells. As shown in recent experiments, the area fractions of rhodopsin are expected to be in WT mouse rod cells, in contrast to for mutant cellsrod4 ; rod7 . It is noted that the area fration is restricted to be . In the previous subsection, we set the same restriction for the total concentration of signaling components on the disk membrane. Thus, we assume for the WT model and for the mutant model.
It has also been shown that the expression levels of genes encoding signaling proteins are almost identical between WT and mutant cells, except for rhodopsinrod4 . Thus, we assume that , , , and are the same between the WT and mutant models, and their sum obeys , since the volume fractions of molecules in normal cells are estimated to be . In the following arguments, we mainly focus on the cases of , , , and , and the total concentration of in the cytoplasm and that of the channel on the cell membrane are assumed to be and , respectively.
Next, we consider the reaction coefficients. The reaction coefficients are given as the combinations of the association and/or dissociation rates of molecules and their diffusion constants. However, not all of these values are precisely determined or reported in experiments. Thus, each reaction coefficient is set according to the following naturally assumed facts aiming for simplicity.
A1) In general, the diffusion of molecules on the lipid membrane is slower than that in the cytoplasm, suggesting that two-body reactions occur more frequently in the cytoplasm than on the membrane. Thus, the reaction coefficients for two-body reactions on the disk membrane are considered to be smaller than those in the cytoplasm. In this argument, for simplicity, we assume that the reaction coefficients on both the disk membrane and cytoplasm are respective constant values and , independent of signaling components, when the concentrations of the molecules are diluted.
A2) The diffusion of molecules in cells is restricted by their molecular crowdingcrowd2 ; crowd3 ; crowd4 ; crowd5 ; crowd6 ; crowd7 ; crowd8 ; crowd9 ; crowd10 ; crowd11 ; crowd12 ; crowd13 ; crowd14 . Thus, each reaction in a molecularly crowded environment is slower than that in an enviroment with diluted molecules. In this argument, we assume that the effective reaction rate of two-body reactions on the disk membrane and cytoplasm, and , obey and , where refers to the total volume of molecules in the cytoplasm, and is assumed to be constant since the fluctuation of the molecular density in the cytoplasm seems to be small and relax immediately.
Then, the coefficients of the two-body reaction processes on the disk membrane are , , , , , , , and , , , . Here, we regard the degradation of by and the opening of the channel by (reaction (6)) as the representative cytoplasmic reactions, since the diffusion of in the cytoplasm is an essential determinant of the frequency of these reactions. Moreover, the binding rate of to the disk membrane is assumed to be similar to that of the reactions on the membrane, since this process is also influenced by the molecular concentration on the disk membrane.
A3) The diffusion of in the cytoplasm is faster than any other reaction process. Here, we assume that the inflow and outflow rates of are the same with , which is set as a large value.
A4) If any molecules do not bind to the channel, this channel is considered to close quickly. Thus, is set to be a large value.
A5) The spontaneous reactions are considered to be slower than catalytic reactions. For simplicity, we assume that the coefficients of spontaneous degradation of signaling components are small constant values of , , , .
A6) The synthesis of molecules is also considered to be a relatively slower reaction. Thus, the production rate of , , is set to be a small value.
Based on these assumptions, we classify the parameters as follows: L) , , and have large values; S) and have small values; and M) has an intermediate value. In the following sections, we mainly focus on the results derived in the case of , , , , , and .
III Results and discussion
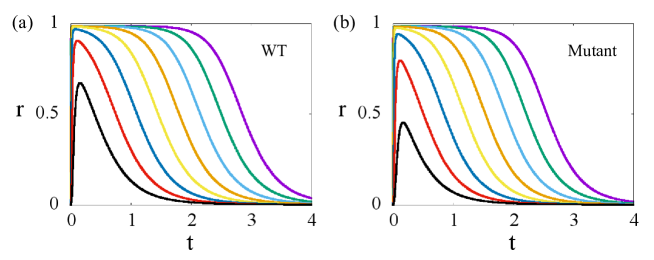
First, we focus on the time course of for both the WT and mutant models of mouse rod cells for an appropriately large (Fig. 2(a,b)). The results showed that the relaxation of the mutant model was faster than that of the WT model for each , which is consistent to experimental observationsrod4 ; rod7 . Notably, the photoactivated state with large was prolonged with the appearance of the plateau of for large values, a result that has not been obtained in recent theoretical models of the mouse rod cellrod6 ; rod7 ; rod8 ; rod9 ; rod10 ; rod11 ; rod12 ; rod13 ; rod14 but has been observed in experimentsrod1 ; rod2 ; rod3 ; rod4 ; rod7 .
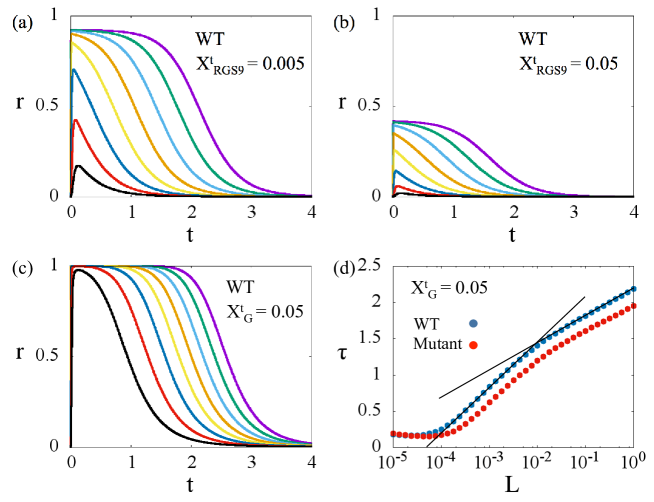
Second, the lifespan of the photoactivation of cells, , was measured, which is defined as the time interval from the point at which reaches its maximum to the point at which , based on a recent experimentrod4 (Fig. 3(a)). For the cases in which is larger (than ), for the WT model was always longer than that for the mutant model for the same , as observed in the experimentrod4 . Moreover, in both models, the slope of increased with an increase in , and showed a logarithmic increase when was so large that reached a plateau. Such phenomena were also observed in the experimentrod4 . In addition, both the activation and relaxation of the mutant model were faster than those of the WT model in the case of the same ( for the WT model and for the mutant model) when is larger than but is small (Fig. 3(d)), as observed in experiments with weak light intensityrod4 ; rod7 .

The present model also demonstrated a decrease in for smaller values (less than ) with an increase in (Fig. 3(a)). Such behavior has not been reported in any experiments. We speculate that this was due to acceleration in the relaxation of the activation of each rod cell with increasing light intensity within the context of very weak light stimuli. However, this conjecture should be confirmed in future experiments to evaluate the validity of the present model.
Now, we consider the mechanism of the phenomena obtained in the present model. In particular, we focus on the accelerations of the activation and relaxation due to the mutations and the appearances of the plateau of for large .
The reason for the accelerations in the activation and relaxation in the mutant cell with a reduced rhodopsin density can be easily understood as follows. The limiting steps of the present signaling processes are the two-body reactions on the disk membrane, becauase of the slow diffusion and molecular crowding effects on the membrane. In the mutant model, the concentraton of rhodopsin is half that of the WT model. Thus, the reaction coefficients for the limiting reaction steps of the mutant model are larger than those of the WT model. By this simple fact, the photoactivation and relaxation of mutant cells are more quickly achieved than those of WT cells.
Next, we consider the mechanism of the slow relaxation of with the appearance of the plateau for large values. The dominant contribution of the appearance of the plateau is considered to result from the deficiency of ; in particular, its concentration is substantially reduced compared to and , which slows down the degradation of to . If is small, the concentration of is not so large, so that the concentration of is similar or less than that of . In this case, is rapidly transformed to and the degradation of is immediately suppressed. On the other hand, if becomes large, the concentration of becomes so large that the concentration of becomes larger than that of . Consequently, most of the becomes involved in , and continues to be degraded by the remaining . Thus, the transformation from to is hindered by the conflict of , which induces the observed plateau of for large
These arguments were confirmed by simulations of the model using larger values of than (Fig. 4(a, b)) where the length of the plateau, the range of with which the plateau appears, was changed. Moreover, the maximum was reduced with an increase in . Thus, the deficiency of has a dominant contribution to the amplification and reduction in the rate of relaxation of photoactivation of rod cells.
Finally, we show the typical behaviors obtained by the present model when the parameters are changed from the previously considered ideal cases. If () becomes so large (small) to approach () or becomes larger, a slow increase in with an increase in appeared again for larger values (Fig. 4(c,d)). Similar results were obtained when some reaction coefficients were randomly changed. However, these behaviors have not yet been reported experimentally.
IV Conclusion
In this study, we investigated the mouse rod phototransduction process through the development of rate equation models consisting of the chemical components that contribute to the signaling processes into and around the membranous disks in the outer segments of rod cells. By considering the effects of the molecular crowding of rhodopsin on the disk membrane, we could explain the mechanism observed both experimentally and theoretically by which photoactivation and relaxation in the WT mouse rod cell are slower than those of the mutant cell containing half the amount of rhodopsin. We also clarified that the deficiency of compared to the other molecules on the disk membrane is primarily responsible for inducing prolongation of the photoactivated state of rod cells in response to strong light stimuli; these observations and explanations have not previously been obtained in recent theoretical models.
The present model includes a large number of parameters, and only a portion of these parameters are experimentally derived. Thus, in the presented arguments, we have adopted simple but reasonably appropriate assumptions for estimating the unknown parameters. The accumulation of further experimental data for several of the relevant parameters in the future would allow us to address quantitative considerations and derive several predictions for the realistic behaviors of mouse rod cells. Moreover, the reduction and mathematical analysis of a few effective valuables and their rate equations from the presented model should be conducted in the future in order to unveil more detail properties and mechanisms of these signaling processes.
Acknowledgment
The author is grateful to M. Fujii, T. Yamashita, and M. Yanagawa for fruitful discussions. This research is partially supported by the Platform Project for Supporting in Drug Discovery and Life Science Research Platform for Dynamic Approaches to Living System from the Ministry of Education, Culture, Sports, Science (MEXT), the Japan Agency for Medical Research and development (AMED), and the Grant-in-Aid for Scientific Research on Innovative Areas “Spying minority in biological phenomena (No.3306) (24115515)” and “Initiative for High-Dimensional Data-Driven Science through Deepening of Sparse Modeling (No.4503)(26120525)” of MEXT of Japan.
References
- (1) Pugh, E. N., and Lamb, T. D. (1993). Amplification and kinetics of the activation steps in phototransduction. Biochimica et Biophysica Acta (BBA)-Bioenergetics, 1141(2), 111-149.
- (2) Pugh, E. N., Nikonov, S., and Lamb, T. D. (1999). Molecular mechanisms of vertebrate photoreceptor light adaptation. Current opinion in neurobiology, 9(4), 410-418.
- (3) Burns, M. E., and Baylor, D. A. (2001). Activation, deactivation, and adaptation in vertebrate photoreceptor cells. Annual review of neuroscience, 24(1), 779-805.
- (4) Calvert, P. D., Govardovskii, V. I., Krasnoperova, N., Anderson, R. E., Lem, J., and Makino, C. L. (2001). Membrane protein diffusion sets the speed of rod phototransduction. Nature, 411(6833), 90-94.
- (5) Fulton AB (1982) How crowded is the cytoplasm? Cell 30: 345–347.
- (6) Minton AP, Colclasure GC, Parker JC (1992) Model for the role of macromolecular crowding in regulation of cellular volume. Proc Natl Acad Sci USA 89: 10504–10506.
- (7) Zimmerman SB, Minton AP (1993) Macromolecular crowding: biochemical, biophysical, and physiological consequences. Annu Rev Biophys Biomol Struct 22: 27–65.
- (8) Minton AP (1998) Molecular crowding: analysis of effects of high concentrations of inert cosolutes on biochemical equilibria and rates in terms of volume exclusion. Methods Enzymol 295: 127–149.
- (9) Minton AP (2001) The influence of macromolecular crowding and macromolecular confinement on biochemical reactions in physiological media. J Biol Chem 276: 10577–10580.
- (10) Ellis RJ (2001) Macromolecular crowding: an important but neglected aspect of the intracellular environment. Curr Opin Struct Biol 11: 114–119.
- (11) Hall D (2003) Macromolecular crowding: qualitative and semiquantitative successes, quantitative challenges. Biochim Biophys Acta, Proteins Proteomics 1649: 127–139.
- (12) Kim J, Yethiraj A (2009) Effect of macromolecular crowding on reaction rates: a computational and theoretical study. Biophys J 96: 1333–1340.
- (13) Agrawal M, Santra SB, Anand R, Swaminathan R (2009) Effect of macromolecular crowding on the rate of diffusion-limited enzymatic reaction. Pramana 71: 359–368.
- (14) Jiao M, Li HT, Chen J, Minton AP, Liang Y (2010) Attractive protein-polymer interactions markedly alter the effect of macromolecular crowding on protein association equilibria. Biophys J 99: 914–923.
- (15) Minton AP (2010) Analysis of membrane binding equilibria of peripheral proteins: allowance for excluded area of bound protein. Anal Biochem 397: 247–249.
- (16) Fritsch C, Langowski J (2011) Chromosome dynamics, molecular crowding, and diffusion in the interphase cell nucleus: a Monte Carlo lattice simulation study. Chromosome Res 19: 63–81.
- (17) Fernández C, Minton AP (2011) Effect of nonadditive repulsive intermolecular interactions on the light scattering of concentrated protein-osmolyte mixtures. J Phys Chem B 115: 1289–1293.
- (18) Shtilerman MD, Ding TT, Lansbury PT (2002) Molecular Crowding Accelerates Fibrillization of α-Synuclein: Could an Increase in the Cytoplasmic Protein Concentration Induce Parkinson’s Disease? Biochemistry 41: 3855–3860.
- (19) Nagarajan S, Amir D, Grupi A, Goldenberg DP, Minton AP, et al. (2011) Modulation of functionally significant conformational equilibria in adenylate kinase by high concentrations of trimethylamine oxide attributed to volume exclusion. Biophys J 100: 2991–2999.
- (20) Cheung M, Klimov D, Thirumalai D (2005) Molecular crowding enhances native state stability and refolding rates of globular proteins. Proc Natl Acad Sci USA 102: 4753–4758.
- (21) Kinjo A, Takada S (2002) Effects of macromolecular crowding on protein folding and aggregation studied by density functional theory: Dynamics. Phys Rev E 66: 051902.
- (22) Kilburn D, Roh JH, Guo L, Briber RM, Woodson SA (2010) Molecular crowding stabilizes folded RNA structure by the excluded volume effect. J Am Chem Soc 132: 8690–8696.
- (23) Lin J, Harding A, Giurisato E, Shaw AS (2009) KSR1 modulates the sensitivity of mitogen-activated protein kinase pathway activation in T cells without altering fundamental system outputs. Mol Cell Biol 29: 2082–2091.
- (24) Aoki K, Yamada M, Kunida K, Yasuda S, Matsuda M (2011) Processive phosphorylation of ERK MAP kinase in mammalian cells. Proc Natl Acad Sci USA 108: 12675–12680.
- (25) Phillips, R., Kondev, J., Theriot, J., and Garcia, H. (2012). Physical biology of the cell. Garland Science.
- (26) Suzuki K, Ritchie K, Kajikawa E, Fujiwara T, Kusumi A (2005) Rapid hop diffusion of a G-proteincoupled receptor in the plasma membrane as revealed by single-molecule techniques. Biophys J 88: 3659–3680.
- (27) Kusumi A, Sako Y, Yamamoto M (1993) Confined lateral diffusion of membrane receptors as studied by single particle tracking (nanovid microscopy). Effects of calcium-induced differentiation in cultured epithelial cells. Biophys J 65: 2021–2040.
- (28) Fujiwara T, Ritchie K, Murakoshi H, Jacobson K, Kusumi A (2002) Phospholipids undergo hop diffusion in compartmentalized cell membrane. J Cell Biol 157: 1071–1081.
- (29) Nakada C, Ritchie K, Oba Y, Nakamura M, Hotta Y, et al. (2003) Accumulation of anchored proteins forms membrane diffusion barriers during neuronal polarization. Nat Cell Biol 5: 626–632.
- (30) Fujii, M., Nishimori, H., and Awazu, A. (2013). Influences of Excluded Volume of Molecules on Signaling Processes on the Biomembrane. PloS one, 8(5), e62218.
- (31) Buzhynskyy, N., Salesse, C., and Scheuring, S. (2011). Rhodopsin is spatially heterogeneously distributed in rod outer segment disk membranes. Journal of Molecular Recognition, 24(3), 483-489.
- (32) Dell’Orco, D., and Schmidt, H. (2008). Mesoscopic Monte Carlo simulations of stochastic encounters between photoactivated rhodopsin and transducin in disc membranes. The Journal of Physical Chemistry B, 112(14), 4419-4426.
- (33) Makino, C. L., Wen, X. H., Michaud, N. A., Covington, H. I., DiBenedetto, E., Hamm, H. E., Lem, J., and Caruso, G. (2012). Rhodopsin expression level affects rod outer segment morphology and photoresponse kinetics. PloS one, 7(5), e37832.
- (34) Goose, J. E., and Sansom, M. S. (2013). Reduced lateral mobility of lipids and proteins in crowded membranes. PLoS computational biology, 9(4), e1003033.
- (35) Wang, Q., Zhang, X., Zhang, L., He, F., Zhang, G., Jamrich, M., and Wensel, T. G. (2008). Activation-dependent hindrance of photoreceptor G protein diffusion by lipid microdomains. Journal of Biological Chemistry, 283(44), 30015-30024.
- (36) Mendez, A., Burns, M. E., Roca, A., Lem, J., Wu, L. W., Simon, M. I., Baylor, D. A., and Chen, J. (2000). Rapid and reproducible deactivation of rhodopsin requires multiple phosphorylation sites. Neuron, 28(1), 153-164.
- (37) Caruso, G., Bisegna, P., Lenoci, L., Andreucci, D., Gurevich, V. V., Hamm, H. E., and DiBenedetto, E. (2010). Kinetics of rhodopsin deactivation and its role in regulating recovery and reproducibility of rod photoresponse. PLoS computational biology, 6(12), e1001031.
- (38) Andreucci, D., Bisegna, P., Caruso, G., Hamm, H. E., and DiBenedetto, E. (2003). Mathematical model of the spatio-temporal dynamics of second messengers in visual transduction. Biophysical journal, 85(3), 1358-1376.
- (39) Caruso, G., Bisegna, P., Shen, L., Andreucci, D., Hamm, H. E., and DiBenedetto, E. (2006). Modeling the role of incisures in vertebrate phototransduction. Biophysical journal, 91(4), 1192-1212.
- (40) Bisegna, P., Caruso, G., Andreucci, D., Shen, L., Gurevich, V. V., Hamm, H. E., and DiBenedetto, E. (2008). Diffusion of the second messengers in the cytoplasm acts as a variability suppressor of the single photon response in vertebrate phototransduction. Biophysical journal, 94(9), 3363-3383.