From Interstellar Clouds to Stars
Abstract
I review (1) Physics of Star Formation & Open Questions; (2) Structure & Dynamics of Star-Forming Clouds & Young Clusters; (3) Star Formation Rates: Observations & Theoretical Implications.
1 The Physics of Star Formation and Open Questions
Star formation is a complex, nonlinear phenomenon involving a host of physical processes. However, in essence it is a competition between self-gravity of gas clouds, along with any processes that promote gravitational instability, and forces that resist collapse, including: various pressures (e.g., thermal, turbulent, magnetic, cosmic ray); direct stellar feedback (protostellar outflows, winds, ionization [leading to enhanced thermal pressure], radiation pressure) and rotation and/or shear. The evolution of these pressures and support mechanisms needs to be followed by considering heating and cooling, generation and decay of turbulence, and generation and diffusion of -fields. This requires following the chemical evolution of gas and dust, both for heating/cooling and for the trace ionization fraction that is important for coupling -fields to the mostly neutral, molecular gas.
We use clumps to describe self-gravitating gas structures that fragment into star clusters and cores as the structures that collapse via a central, rotationally-supported disk to form single stars or small- multiples. Fragmentation of a clump into a population of cores (and subsequent lack of fragmentation in core envelopes) will depend on the evolution of local pressure support contributions.
Once the clump or core contains stars, then, in addition to the feedback these stars return to the gas, one also needs to follow the evolution of their orbits and multiplicity properties in the protocluster environment. Continued, competitive Bondi-Hoyle accretion of gas to stars has been argued to be important in shaping the upper end of the initial mass function (IMF) (Bonnell et al. 2001; Bate 2012). However, as discussed by Tan et al. (2014, hereafter T14), simulations of competitive accretion have typically not included -fields or well-resolved feedback, especially protostellar outflows, and so may have overestimated its importance.
This highlights two major challenges for star formation simulations. First, one needs to be sure to include all the important physical processes, especially -fields (including non-ideal MHD processes, since young stars have magnetic flux-to-mass ratios that are several orders of magnitude smaller than molecular clouds) and stellar feedback. Second, one needs to resolve a vast ranges of scales, ideally down to the stellar surface. Unfortunately, this is not yet practical for realistic systems that contain even moderate numbers of stars, especially because of the short timesteps that are associated with the smallest scales. Thus, subgrid models are always needed, often implemented via sink particles, and a major concern is whether the results of simulations, such as the IMF, binary properties and star formation rates (SFRs), depend on how physics is implemented at the subgrid level. A third challenge is, unlike the cosmological Pop III case, numerical simulations of “local” star formation must make uncertain choices for initial conditions.
Given these theoretical difficulties, and with observations of basic quantities of star-forming regions (see §2), such as mass and -field strengths of interstellar gas clouds and the ages and thus SFRs of young stellar systems, also suffering from large uncertainties, there are still a number of major open questions about the star formation process. On the scales of galactic disks and kpc-scale subregions, empirical star formation relations have been found between SFR per unit area, , and total gas content per unit area, , and orbital timescale (Kennicutt & Evans 2012), but, as discussed below in §3, there is no consensus on what processes regulate the SFR to follow these relations. On scales of giant molecular clouds (GMCs), it is unclear what causes a certain region to form stars, i.e., does it typically do so because of an external trigger (e.g., converging flows, cloud collisions or stellar feedback) or via spontaneous gravitationally instability (e.g., as a cloud evolves and loses its earlier level of internal pressure support)? The answer to this question relates directly to the specification of initial conditions for numerical simulations of star formation, e.g., how close is the initial clump or core to virial and pressure equilibrium? How do stars accrete their mass—is it mostly from a natal pre-stellar core or by competitive Bondi-Hoyle accretion from the clump? What sets the IMF and binary properties and do these vary with environment? What are the main processes that regulate SFRs in GMCs, clumps & cores: turbulence, magnetic fields or feedback? Are timescales to form a star cluster from a gas clump short (Elmegreen 2000; Hartmann & Burkert 2007) or long (Tan et al. 2006; Nakamura & Li 2007) compared to the local free-fall time?
2 Structure and Dynamics of Star-Forming Clouds and Young Clusters
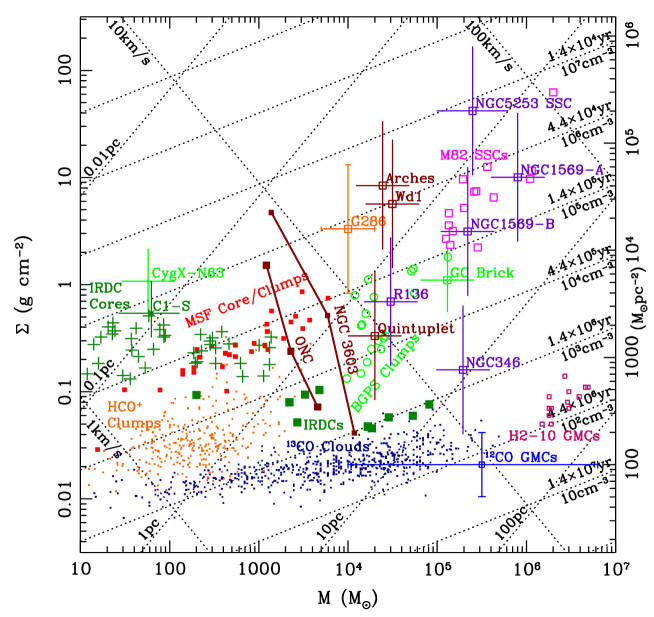
The physical properties of mass (), radius (), mass surface density (), density () or equivalently number density of H nuclei (), free-fall time () and surface escape speed (, where is the virial parameter and is the 1D velocity dispersion) of star-forming clouds and young star clusters are shown in Fig. 1. The range of scales shown extends from those of GMCs, i.e., up to and pc, down to those of individual relatively massive cores and pc.
A large fraction of stars in the Galaxy and other similar disk galaxies are formed in star clusters with sizes of a few parsecs and a range of from to and masses from to , with initial cluster mass functions (ICMFs) that can be fit by a power law up to (Fall & Chandar 2012). Individual galaxies with higher SFRs, such as the starbursting Antennae, or samples of galaxies (e.g., Dowell et al. 2008) exhibit a similar ICMF that extends up to . Although the majority of stars are born in protoclusters that have relatively high overall star formation efficiencies, , and are initially gravitationally bound, most cluster members eventually disperse to the field, due to a combination of cluster mass loss, envelope expansion and tidal stripping.
The precursors to star clusters are dense clumps that are mostly within GMCs and revealed by their emission from high critical density species (e.g., HCO+), from their extinction as Infrared Dark Clouds (IRDCs), or by their mm/sub-mm dust continuum emission (e.g., Massive Star-Forming (MSF) clumps and the Bolocam Galactic Plane Survey (BGPS) clumps) (see Fig. 1). The central densities of some stellar clusters, such as the Orion Nebula Cluster (ONC) and NGC 3603, extend to higher values than are typically seen in gas clouds of equivalent mass, which may indicate central concentration due to dynamical evolution of the protocluster during or just after star cluster formation, probably driven by mass segregation.
One important question is the extent to which GMCs and clumps are gravitationally bound, i.e., with virial parameters and close to virial equilibrium, i.e., with . Hernandez & Tan (2015, hereafter HT15) considered the ten IRDCs shown by solid green squares in Fig. 1, as well as their surrounding GMCs as traced by 13CO(1-0). For clouds defined as connected structures in position-position-velocity space and with masses and velocity dispersions estimated from 13CO(1-0), the mean and median values for GMCs are and 1.0, with a standard deviation of 0.5. For the IRDCs, the mean and median values are both 1.9, with a standard deviation of 1.1. This is evidence that GMCs are gravitationally bound and virialized, consistent with the results of Roman-Duval et al. (2010, see also Tan et al. 2013). It is tentative evidence for IRDCs having more disturbed kinematics. However, one must be careful with systematic effects, such as the possibility that CO freeze-out onto dust grains is a greater in IRDCs (Hernandez et al. 2011), leading to their 13CO-derived masses being somewhat underestimated. As pointed out by Heyer et al. (2009), studying the correlation of versus , which should be linear if virial equilibrium applies, is a more accurate way of assessing the virial equilibrium of cloud populations, since it reduces the effects of common systematic uncertainties associated with, e.g., mass measurements that require assuming a particular abundance of a molecular cloud tracer, such as 13CO. Such a correlation is seen in the GMC sample studied by HT15, with a slight steepening on extending into the higher regime of IRDCs.
Another way to assess the dynamics of clumps is to look directly for infall motions and mass infall rates. As reviewed by T14, infall times, , relative to the local free-fall time, , have been measured in several clumps, including IRDCs, with typical observed ratios of , indicating relatively slow, quasi equilibrium contraction. In agreement with this, recently Wyrowski et al. (2015) have reported infall velocities to a sample of nine massive molecular clumps, finding infall speeds that are typically about 10% of free-fall. Such slow rates of collapse suggest either a dynamically important role for -fields, consistent with observations of two IRDCs by Pillai et al. (2015, see also analysis of Falceta-Gonçalves et al. 2008 and H-B. Li et al. 2014), and/or stabilization of collapse by protostellar outflow feedback, as modeled by Nakamura & Li (2007, 2014).
The timescales and dynamics of molecular clouds can also be assessed by modeling their chemical evolution. From observations of ortho- and para- that constrain the ortho-to-para ratio (OPR) of , Brüncken et al. (2014) estimated a chemical age of Myr, i.e., , in the protostellar core IRAS 16293-2422 A/B, which has mean density , i.e., yr. The OPR of also controls deuteration chemistry, e.g., of the abundance ratio []/[] (Pagani et al. 2013; Kong et al. 2015a). This ratio rises by several orders of magnitude above the cosmic [D]/[H] ratio in cold, dense gas, where OPR of drops to very low values and CO molecules are mostly frozen out onto dust grains. The study of Kong et al. (2015b) uses observations of in two massive starless or early-stage cores to estimate chemical ages that imply contraction is most likely proceeding at rates smaller than of free-fall.
Study of the internal structures of molecular clouds constrains the processes that regulate their dynamics. A simple metric is the probability distribution function (PDF) of within a defined area. Kainulainen et al. (2009) found non-star-forming clouds have log-normal -PDFs, while star-forming clouds, such as Taurus, have high- power-law tails. Log-normal -PDFs are a feature of supersonic turbulence, while high- power law tails are seen to emerge in such simulations once self-gravity is turned on, with this gas component interpreted as being in free-fall collapse (Kritsuk et al. 2011; Collins et al. 2011). However, on the observational side, the difficulty of determining the peak of -PDFs has been highlighted by Schneider et al. (2015a) and Lombardi et al. (2015), with the latter concluding that, given the uncertainties, the data of all the nearby clouds they considered are consistent with pure power-law tails. On the other hand, from combined NIR + MIR extinction mapping of an IRDC and surrounding GMC, Butler et al. (2014) claimed to identify the peak of the -PDF near 0.03 ( mag) and found that the overall shape was well-fit by a single log-normal, with very little scope for the presence of high- power-law tail, even though the cloud has (however, see Schneider et al. 2015b). On the theoretical side, simulations of self-gravitating, strongly-magnetized (trans-Alfvénic), turbulent clouds with realistic (i.e., non-periodic) boundary conditions are needed for comparison with observed -PDFs. In addition, the -PDF is just one simple metric and higher order spatial and/or kinematic statistics are required to better characterize MHD turbulence of molecular clouds (Burkhart et al. 2014; 2015).
Filamentary structures are common in star-forming clouds. On the largest scales, at least ten examples of very long pc-scale filaments have been detected in the Galactic plane (e.g., Jackson et al. 2010; Ragan et al. 2014; Wang et al. 2015). Their relatively ordered kinematics are a challenge to models that involve rapid, free-fall collapse (Butler et al. 2015), which may again indicate that -field support is important. On smaller scales, molecular clouds and clumps often appear to be composed of a network of filaments and there are claims, from studies of nearby, relatively low- clouds, that the filaments exhibit a characteristic width of pc (see review by André et al. 2014). Hennebelle & André (2013) have presented a model of self-gravitating filaments in which this scale is explained as being due to a balance between accretion-driven turbulence and dissipation by ion-neutral friction. More generally, sheets and filaments are expected to occur in all realistic models involving gravitational collapse, including those in which the clouds are permeated by trans-Alfvénic turbulence for which both -fields and turbulent motions make important contributions to internal pressure support.
Both pre-stellar and protostellar cores are seen in star-forming clouds, typically spaced along filaments, with identification via dust continuum emission, dust extinction or molecular emission lines. The core mass function (CMF) has been measured and found to be similar in shape to the stellar IMF (e.g., Könyves et al. 2015), but translated to higher masses by a factor of about 2.5, i.e., implying a star formation efficiency of about 40%. Such efficiencies are naturally explained as being due to feedback from protostellar outflows, for both low-mass (Matzner & McKee 2000) and high-mass cores (Zhang et al. 2014).
The origin of the CMF remains uncertain. Models of turbulent fragmentation have been proposed. For example, Padoan & Nordlund (2002) build a CMF by equating the size of cores to the thickness of post-shock compressed gas in a cloud permeated by super-Alfvénic turbulence (see also Hennebelle & Chabrier 2008). However, it is not clear that observed cores form in such a dynamic and rapid manner. Alternatively, Kunz & Mouschovias (2009) have proposed a dominant role for -fields, with the CMF being set by ambipolar diffusion.
The velocity dispersions of core populations have been measured in star-forming regions: e.g., the (1-0)-defined sample of Kirk et al. (2007) in Perseus. It was noted that the velocity dispersions appear subvirial, which could either be a true reflection of an unstable dynamical state (although dense cores are expected to exhibit somewhat subvirial motions even in virialized clouds, Offner et al. 2008) or indicate that large-scale -fields are providing significant support in the clump.
Observations of the stellar kinematics of embedded clusters from NIR radial velocities find a dynamical state that is near virial equilibrium in the case of NGC 1333 (Foster et al. 2015) and moderately super-virial for IC 348 (Cottaar et al. 2015). These results are consistent with theoretical expectations, given that the latter cluster has a smaller gas mass fraction, perhaps due to dispersal by feedback.
3 Star Formation Rates - Observations and Theoretical Implications
It is very challenging to measure SFRs. On galactic and kiloparsec-scales this is normally achieved by measuring diagnostics associated with short-lived (i.e., Myr) high-mass stars, such as recombination lines, mainly H, from ionized gas and MIR to FIR luminosities (see Kennicutt & Evans 2012). Empirically, a correlation is seen in disk galaxies and circumnuclear starburst disks, i.e., with (Kennicutt 1998). Considering only the mass surface density of molecular gas, , a linear relation has been derived (Bigiel et al. 2008). Another relation that is almost as good a fit to the data is , which is equivalent to conversion of 4% of total gas mass into stars per local orbital time (Kennicutt 1998; Tan 2010; Suwwanajak et al. 2014). Such a relation could in principle be explained by triggering of star formation by spiral arm passage, but such enhancements were not seen in the study of Foyle et al. (2010). One alternative model is triggering by shear-driven GMC collisions in a flat rotation curve thin disk (Tan 2000; Tasker & Tan 2009), since in this environment, for gravitationally bound GMCs, the collision time is a fixed fraction, , of an orbital time.
Once the total SFR is measured in a galaxy, such as the Milky Way where it is estimated to be , then the SFR per free-fall time, , on the density scale of a given ISM tracer can also be assessed. For example, the Galactic population of 12CO-defined GMCs has with typical densities and free-fall times yr. Assuming most of the total SFR occurs in GMCs, then for GMCs (Zuckermann & Evans 1974). Extending this to the higher densities of IRDCs and other tracers, Krumholz & Tan (2007) concluded for clouds of densities up to . Murray (2011) found higher values, i.e, , in the GMCs associated with the 13 most luminous Galactic free-free sources, which suggests that SFR activity may be very stochastic.
Extending to the smaller scales of individual GMCs, counting of young stellar objects (YSOs) can be attempted and a SFR derived by assuming they have a typical age, e.g., Myr in the study of Heiderman et al. (2010). Their results are consistent with a threshold for star formation of , i.e., or mag, which agrees with the prediction of a model of photoionization-regulated star formation in magnetically-supported clouds (McKee 1989). Above the threshold, there is an approximately linear relation of , i.e., with a normalization factor higher than the kpc-scale result of Bigiel et al. (2008). This implies for spherical clouds.
If more accurate individual stellar ages can be derived, then age spreads can be searched for and SFRs derived more directly. The best region for such studies is the ONC, from which an estimate of is derived (Da Rio et al. 2014).
Ma et al. (2013) measured luminosity to mass ratios, , of a complete census of HCO+ clumps (Fig. 1). The lower bound of this distribution in the vs. plane constrains , otherwise just the accretion luminosities of the protostars, i.e., ignoring internal luminosities, would exceed observed values.
Thus, even in regions that are actively forming stars, observed SFRs in molecular clouds typically imply very inefficient star formation, i.e., just a few percent conversion of gas into stars per local free-fall time. Based on the results of numerical simulations, supersonic turbulence in self-gravitating gas has been proposed to explain these SFRs (Krumholz & McKee 2005; Padoan & Nordlund 2011; Hennebelle & Chabrier 2011; see review by Padoan et al. 2014). Krumholz et al. (2009) have applied these models to populations of GMCs in galactic disks to explain their empirical star formation relations.
However, the turbulence regulated star formation models involve creation of gravitationally unstable regions, i.e., cores, by rapid compression behind shocks and it is not clear that the observations of cores (§2) support a picture of such rapid accumulation of their gas. Also, to achieve in simulations of MHD turbulence, typically requires (Padoan et al. 2012), again inconsistent with observed clouds. The simulations that underpin the models are mostly of super-Alfvénic turbulence (i.e., relatively weak -fields) driven on large-scales and have periodic boundary conditions. If star cluster formation is a relatively slow, quasi-equilibrium process that takes at least several free-fall times to build up the stellar population (Tan et al. 2006), then most stars will instead be forming in an environment in which turbulence is maintained by small-scale driving by protostellar outflows (Nakamura & Li 2007). Finally, the threshold for star formation is not naturally explained in these pure turbulence models.
In summary, observations suggest stars form with low efficiency per local free-fall time, i.e., of a few percent, in clumps with mag, i.e., , but these regions often eventually build up overall efficiencies of to form loosely bound clusters. This star formation activity is likely regulated by a combination of -fields and turbulence. Clumps need to become moderately magnetically supercritical, i.e., their large-scale -fields no longer strong enough to resist gravity, which likely explains the threshold for active SFRs. However, -fields remain relatively strong so that turbulence is trans-Alfvénic. At first turbulence is mostly driven from large scales, perhaps by GMC collisions, which also promote compression and formation of supercritical clumps and are a natural mechanism to connect the kpc-scale galactic dynamics of shearing disks to the pc-scales of protoclusters. As star formation proceeds, then the local turbulence becomes dominated by that driven by protostellar outflows. Eventually feedback from massive stars, especially ionization, disperses remaining gas in the protocluster, though this becomes progressively more difficult in higher-, higher-mass clumps, which may then form super star clusters with high efficiency.
References
- [] André, P., Di Francesco, J., Ward-Thompson, D. et al. 2014, Protostars & PlanetsVI, 27
- [] Bate, M. R. 2012, MNRAS, 419, 3115
- [] Bigiel, F., Leroy, A., Walter, F. et al. 2008, AJ, 136, 2846
- [Bonnell et al.(2001)] Bonnell, I. A., Bate, M. R., Clarke, C. J., & Pringle, J. E. 2001, MNRAS, 323, 785
- [] Brüncken, S., Sipilä, O., Chambers, E. T. et al. 2014, Nature, 516, 219
- [] Burkhart, B., Collins, D. C., & Lazarian, A. 2015, ApJ, 805, 118
- [] Burkhart, B., Lazarian, A., Leão, I. C. et al. 2014, ApJ, 790, 130
- [] Butler M. J., Tan J. C., & Kainulainen, J. 2014, ApJL, 782, L30
- [] Butler M. J., Tan J. C., & Van Loo, S. 2015, ApJ, 805, 1
- [] Collins, D., Padoan, P., Norman, M. L., & Xu, H. 2011, ApJ, 731, 59
- [] Cottaar, M., Covey, K. R., Foster, J. B. et al. 2015, ApJ, 807, 1
- [] Da Rio, N., Tan, J. C., & Jaehnig, K. 2014, ApJ, 795, 55
- [] Dowell, J. D., Buckalew, B. A., & Tan, J. C. 2008, AJ, 135, 823
- [] Elmegreen, B. G. 2000, ApJ, 530, 277
- [] Falceta-Gonçalves, D., Lazarian, A. & Kowal, G. 2008, ApJ, 679, 537
- [] Fall, S. M., & Chandar, R. 2012, ApJ, 752, 96
- [] Foster, J. B., Cottaar, M., Covey, K. R. et al. 2015, ApJ, 799, 136
- [] Foyle, K., Rix, H.-W., Walter, F., & Leroy, A. K. 2010, ApJ, 725, 534
- [] Hartmann, L., & Burkert, A. 2007, ApJ, 654, 988
- [] Heiderman, A., Evans, N. J., Allen, L. E. et al. 2010, ApJ, 723, 1019
- [] Hennebellw, P., & André, P. 2013, A&A, 560, 68
- [] Hennebelle, P. & Chabrier, G. 2008, ApJ, 684, 395
- [] Hennebelle, P. & Chabrier, G. 2011, ApJL, 743, L29
- [] Hernandez, A. K., & Tan, J. C. 2015, ApJ, 809, 154
- [] Hernandez, A. K., Tan, J. C., Caselli et al. 2011, ApJ, 738, 11
- [] Jackson, J. M., Finn, S. C., Chambers, E. T. et al. 2010, ApJL, 719, L185
- [] Kainulainen, J., Beuther, H., Henning, T., & Plume, R. 2009, A&A, 508, L35
- [] Kennicutt, R. C. 1998 ApJ, 498, 541
- [] Kennicutt, R. C., & Evans, N. J. 2012, ARA&A, 50, 531
- [] Kirk, H., Johnstone, D., & Tafalla, M. 2007, ApJ, 668, 1042
- [] Kong, S., Caselli, P., Tan, J. C. et al. 2015a, ApJ, 804, 98
- [] Kong, S., Tan, J. C., Caselli, P. et al. 2015b, ApJ, submitted (arXiv:1509.08684)
- [] Könyves, V., André, P., Men’shchikov, A. et al. 2015, A&A, 548, 91
- [] Kritsuk, A. G., Norman, M. L., & Wagner, R. 2011, ApJ, 727, L20
- [] Krumholz, M. R. & McKee, C. F. 2005, ApJ, 630, 250
- [] Krumholz, M. R., McKee, C. F., & Tumlinson, J. 2009, ApJ, 699, 850
- [] Krumholz, M. R. & Tan, J. C. 2007, ApJ, 654, 304
- [] Kunz, M. W. & Mouschovias, T. Ch. 2009, MNRAS, 399, L94
- [] Li, H.-B., Goodman, A., Sridharan, T. K. et al. 2014, Protostars & Planets VI, 101
- [] Lombardi, M., Alves, J., & Lada, C. J. 2015, A&A, 576, L1
- [] Ma, B., Tan, J. C., & Barnes, P. 2013, ApJ, 779, 79
- [] Matzner, C. D. & McKee, C. F. 2000, ApJ, 545, 364
- [] McKee, C. F. 1989, ApJ, 345, 782
- [] Murray, N. 2011, ApJ, 729, 133
- [] Nakamura, F. & Li, Z.-Y. 2007, ApJ, 662, 395
- [] Nakamura, F. & Li, Z.-Y. 2014, ApJ, 783, 115
- [] Offner, S. S. R., Krumholz, M. R., Klein, R. I. & McKee, C. F. 2008, AJ, 136, 404
- [] Padoan, P., Federrath, C., Chabrier, G. et al. 2014, Protostars & Planets VI, p77
- [] Padoan, P., Haugbølle, T., & Nordlund, Å. 2012, ApJ, 759, L27
- [] Padoan, P. & Nordlund, Å. 2002, ApJ, 576, 870
- [] Padoan, P. & Nordlund, Å. 2011, ApJ, 730, 40
- [] Pagani, L., Lesaffre, P. Jorfi, M. et al. 2013, A&A, 551, 38
- [Pillai et al.(2015)] Pillai, T., Kauffmann, J., Tan, J. C., et al. 2015, ApJ, 799, 74
- [] Ragan, S. E., Henning, Th., Tackenberg, J., et al. 2014, A&A, 568, A73
- [] Roman-Duval, J., Jackson, J. M., Heyer, M. et al. 2010, ApJ, 723, 492
- [] Schneider, N., Ossenkopf, V., Csengeri, T. et al. 2015a, A&A, 575, 79
- [] Schneider, N., Csengeri, T., Klessen, R. S. et al. 2015b, A&A, 578, 29
- [] Suwwanajak, C., Tan, J. C., & Leroy, A. K. 2014, ApJ, 787, 68
- [] Tan, J. C. 2000, ApJ, 536, 173
- [] Tan, J. C. 2010, ApJ, 710, 88
- [Tan et al.(2014)] Tan, J. C., Beltrán, M. T., Caselli, P., et al. 2014, Protostars & Planets VI, 149
- [] Tan, J. C., Krumholz, M. R., & McKee, C. F. 2006, ApJL, 641, L121
- [] Tan, J. C., Shaske, S., & Van Loo, S. 2013, IAU Symp. 292, ed. T. Wong & J. Ott, 19
- [] Tasker, E. J., & Tan 2009, ApJ, 700, 358
- [] Wang, K., Testi, L., Ginsburg, A. et al. 2015, MNRAS, 450, 4043
- [] Wyrowski, F., Güsten, R., Menten, K. M. et al. 2015, A&A, in press (arXiv:1510.08374)
- [] Zhang, Y., Tan, J. C., & Hosokawa, T. 2014, ApJ, 788, 166
- [] Zuckerman, B., & Evans, N. J. 1974, ApJL, 192, L194