The JCMT Gould Belt Survey: A First Look at Dense Cores in Orion B
Abstract
We present a first look at the SCUBA-2 observations of three sub-regions of the Orion B molecular cloud: LDN 1622, NGC 2023/2024, and NGC 2068/2071, from the JCMT Gould Belt Legacy Survey. We identify 29, 564, and 322 dense cores in L1622, NGC 2023/2024, and NGC 2068/2071 respectively, using the SCUBA-2 850 m map, and present their basic properties, including their peak fluxes, total fluxes, and sizes, and an estimate of the corresponding 450 m peak fluxes and total fluxes, using the FellWalker source extraction algorithm. Assuming a constant temperature of 20 K, the starless dense cores have a mass function similar to that found in previous dense core analyses, with a Salpeter-like slope at the high-mass end. The majority of cores appear stable to gravitational collapse when considering only thermal pressure; indeed, most of the cores which have masses above the thermal Jeans mass are already associated with at least one protostar. At higher cloud column densities, above cm-2, most of the mass is found within dense cores, while at lower cloud column densities, below cm-2, this fraction drops to 10% or lower. Overall, the fraction of dense cores associated with a protostar is quite small (), but becomes larger for the densest and most centrally concentrated cores. NGC 2023/2024 and NGC 2068/2071 appear to be on the path to forming a significant number of stars in the future, while L1622 has little additional mass in dense cores to form many new stars.
1. INTRODUCTION
The James Clerk Maxwell Telescope Gould Belt Survey has mapped nearly all of the nearby (500 pc) significant star-forming regions visible from Hawaii with the SCUBA-2 instrument (Holland et al., 2013), tracing thermal emission from dust grains at 850 m and 450 m (Ward-Thompson et al., 2007). A subset of these star-forming regions has also been mapped in 3–2 line emission of CO isotopologues using HARP (Buckle et al., 2009). With a variety of nearby star-forming regions mapped in a uniform manner, one of the goals of the GBS is to characterize the properties of dense cores and their surroundings, and determine the influence of the larger environment on their formation and evolution. In this paper, we present a first look at the SCUBA-2 observations of the Orion B molecular cloud using SCUBA-2, identifying dense cores and analyzing their basic properties. Buckle et al. (2010) earlier presented a first-look analysis of the 12CO, 13CO, and C18O line observations in Orion B.
The Orion B molecular cloud is part of the larger Orion complex, a large (100 pc long; Maddalena et al., 1986), nearby (415 pc, e.g., Anthony-Twarog, 1982; Menten et al., 2007) set of associated molecular clouds forming both low- and high- mass stars (e.g., Bally, 2008). The best-studied part of the Orion complex is the Orion A cloud, which includes the Integral Shaped Filament (e.g., Bally et al., 1987) and the Orion Nebula Cluster (e.g., Muench et al., 2008). The Orion B cloud lies northeast of the Orion A cloud and has a similar total mass of about M⊙ (e.g., Maddalena et al., 1986; Meyer et al., 2008) but a smaller fraction of dense gas. This lower fraction of dense gas also translates into a lower overall star formation rate (two to seven times lower; Meyer et al., 2008). Lombardi et al. (2014) found that the surface density of young protostars varies roughly with the square of the extinction (or total column density) in Orion. The bulk of star formation in Orion B is concentrated within three clusters, NGC 2024, NGC 2068, and NGC 2071, which are estimated to contain 60% to 90% of the current YSOs in Orion B, while a fourth cluster, NGC 2023, is forming a smaller number of stars (e.g., Lada et al., 1991; Meyer et al., 2008). The most active parts of these four regions have been analyzed using prior submillimetre observations, including dust continuum maps from SCUBA (e.g., Motte et al., 2001; Mitchell et al., 2001; Johnstone et al., 2001, 2006; Nutter & Ward-Thompson, 2007) and the polarimeter attached to SCUBA (Matthews et al., 2002; Matthews & Wilson, 2002). Our SCUBA-2 observations cover a larger area around these four regions than the original SCUBA data – 2.1 and 1.7 square degrees were mapped by SCUBA-2 in NGC 2023/2024 and NGC 2068/2071 respectively, compared to 0.5 and 0.3 square degrees with SCUBA. Our SCUBA-2 observations also cover a fifth region, LDN 1622 (0.6 square degrees mapped), which contains roughly 30 YSOs (Reipurth et al., 2008). L1622 is formally part of ‘Orion East’ and has a different typical CO centroid velocity than the neighbouring Orion B (e.g., km s-1 versus 10 km s-1; Maddalena et al., 1986). Reipurth et al. (2008), however, cite other evidence that suggests L1622 is still part of the same Orion complex at a similar distance as Orion A and B, though a few observations suggest a distance of less than 200 pc (see discussion in Reipurth et al., 2008).
Star-forming regions tend to display hierarchical structure, as recent Herschel Gould Belt Survey results (e.g., André et al., 2010, 2014) have beautifully illustrated. The larger-scale (column) density distribution of material is often traced with CO observations (e.g., Maddalena et al., 1986), estimates of the dust column density based on stellar reddening (e.g., Lombardi et al., 2011), or more recently, combining Herschel and Planck measurements of dust emission (e.g., Lombardi et al., 2014). SCUBA-2 is insensitive to the largest scale of (lower) column density, like any ground-based submillimetre instrument, but provides a higher-resolution view of smaller-scale dense objects than the former measurements can usually provide. For example, Ward-Thompson et al (2015, in prep) show that in the Taurus molecular cloud, SCUBA-2 is particularly sensitive to the denser, more compact objects that will likely become (or already are) the birthsites of protostars, even when the effects of ground-based filtering are accounted for.
In our first-look analysis, we examine the dense cores detected by SCUBA-2 in the context of the larger-scale column density (using data from Lombardi et al., 2014), as well as already-formed young protostars (using data from Megeath et al. 2012 and Stutz et al. 2013). In this paper, we describe the SCUBA-2 observations (Section 2), identify the dense cores therein (Section 3), analyze the basic properties of the cores including their masses, gravitational stability, and relationship with the material in the larger cloud (Section 4), discuss our results (Section 5), and summarize our conclusions (Section 6).
2. OBSERVATIONS
Orion B was observed with SCUBA-2 (Holland et al., 2013) at 850 m and 450 m as part of the
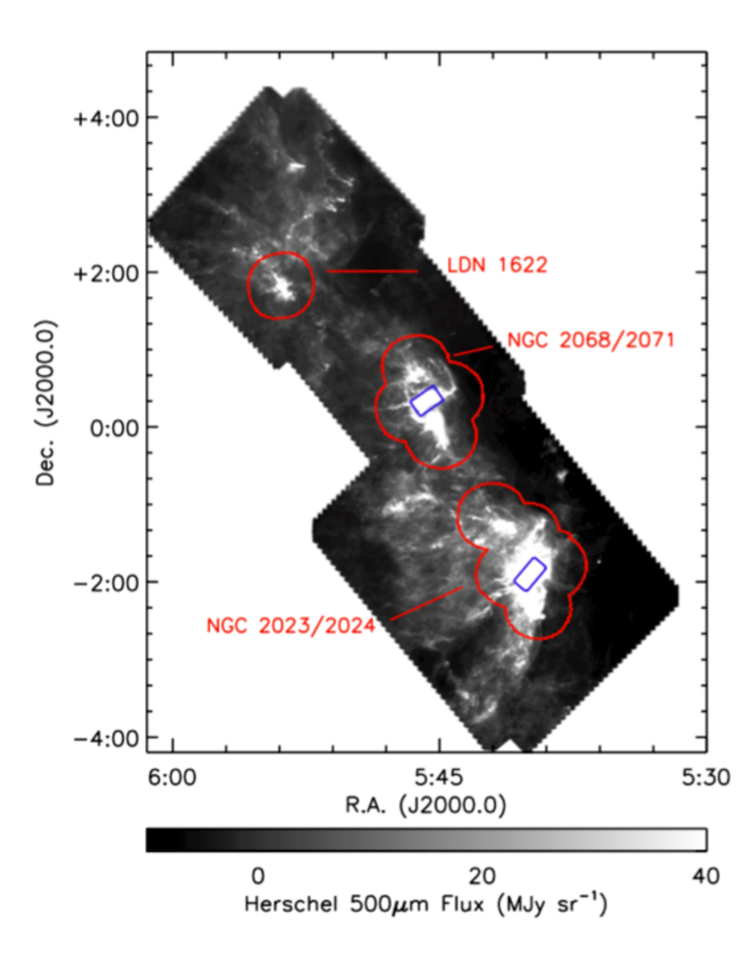
JCMT Gould Belt Survey (Ward-Thompson et al., 2007). Three separate regions were observed: the areas
around L1622, NGC 2023/2024, and NGC 2068/2071, as illustrated in
Figure 1. Our SCUBA-2 observations
cover most of the high flux areas in the Herschel 500 m map from
Schneider et al. (2013)111We downloaded the Herschel 500 m map from
http://www.herschel.fr/cea/gouldbelt/en/Phocea
/Vie_des_labos/Ast/ast_visu.php?id_ast=66.
The SCUBA-2 observations were obtained between February 2012 and November 2014 with some initial
science
verification data taken in October 2011 and November 2011. Most data
were observed as fully sampled 30′ diameter circular regions using the PONG 1800 mode
(Kackley et al., 2010). Several science verification observations taken in the NGC 2023/2024 and
NGC 2068/2071 regions were instead taken in PONG 900 mode, which fully samples a 15′ diameter circular region (Kackley et al., 2010).
Each area of sky was observed between four
to six times in PONG 1800 mode, with the number of repeats depending on weather
conditions. Neighbouring fields were set up to overlap slightly to create a more uniform
noise in the final mosaic.
The PONG 900 observations are not included in the final mosaic that we analyze here,
to maintain an approximately uniform noise
level and sensitivity to larger-scale structures across the areas observed.
The data reduction used for the maps presented here follow the GBS Legacy Release 1 methodology, which is discussed in Mairs et al. (2015). The data presented here were reduced using an iterative map-making technique (makemap in smurf222smurf is a software package used for reducing JCMT observations, and is described in more detail in Chapin et al. (2013a).; Chapin et al., 2013b), and gridded to 3″ pixels at 850 m and 2″ pixels at 450 m. The iterations were halted when the map pixels, on average, changed by 0.1% of the estimated map rms. The initial reductions of each individual scan were coadded to form a mosaic from which a signal-to-noise mask was produced for each region. The final mosaic was produced from a second reduction using this mask to define areas of emission. In Orion B, the mask included all pixels with signal-to-noise ratio of 2 or higher at 850 m. Testing by our data reduction team showed similar final maps using either an 850 µm-based or a 450 µm-based mask for the 450 m reduction, when using the SNR-based masking scheme described here. Using identical masks at both wavelengths for the reduction ensures that the same large-scale filtering is applied to the observations at both wavelengths (e.g., maps of the ratio of fluxes at both wavelengths are less susceptible to differing large-scale flux recovery). Detection of emission structure and calibration accuracy are robust within the masked regions, but are less certain outside of the masked region (Mairs et al., 2015).
Larger-scale structures are the most poorly recovered outside of the masked areas, while point sources are better recovered. A spatial filter of 600″ is used during both the automask and external mask reductions, and an additional filter of 200″ is applied during the final iteration of both reductions to the areas outside of the mask. Further testing by our data reduction team found that for 600″ filtering, flux recovery is robust for sources with a Gaussian FWHM less than 2.5′, provided the mask is sufficiently large. Sources between 2.5′ and 7.5′ in diameter were detected, but both the flux and the size were underestimated because Fourier components representing scales greater than 5′ were removed by the filtering process. Detection of sources larger than 7.5′ is dependent on the mask used for reduction. At a distance of 415 pc, 7.5′ corresponds to 0.9 pc.
The data are calibrated in mJy per square arcsec using aperture
flux conversion factors (FCFs) of
2.34 Jy/pW/arcsec2 and
4.71 Jy/pW/arcsec2 at 850 m and 450 m, respectively,
as derived from average values of JCMT calibrators (Dempsey et al. 2013).
The PONG scan pattern leads to lower
noise in the map centre and mosaic overlap regions, while data reduction and
emission artifacts can lead to small variations in the noise over the
whole map.
The pointing accuracy of the JCMT is smaller than the pixel sizes we adopt,
with current rms pointing errors of 1.2″ in azimuth and 1.6″ in elevation
(see http://www.eaobservatory.org/JCMT/
telescope/pointing/pointing.html); JCMT pointing
accuracy in the era of SCUBA is discussed in Di Francesco et al. (2008).
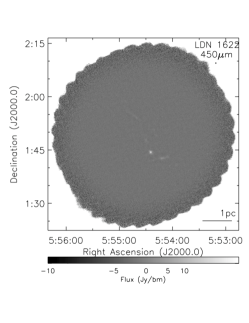
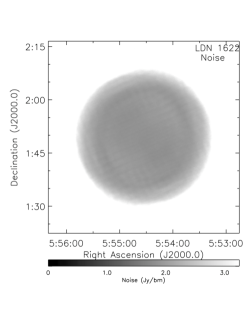
The observations for Orion B were taken in both grade one () and grade two () weather, corresponding to and respectively (Dempsey et al., 2013), with a mean value of of 0.06 0.01. At 850 m, the final noise level in the mosaic is typically 0.05 mJy arcsec-2 per 3″ pixel, corresponding to 3.7 mJy per 14.6″ beam. At 450 m, the final noise level is 1.2 mJy arcsec-2 per 2″ pixel, corresponding to 59 mJy per 9.8″ beam. (Note the beamsizes quoted here are the effective beams determined by Dempsey et al., 2013, and account for fact that the beam shape is well-represented by the sum of a Gaussian primary beam shape and a fainter, larger Gaussian secondary beam). The noise levels for each PONG observing area in the final mosaic is given in Table 1 in terms of the typical rms in a pixel.
| Region | NameaaObservation designation chosen by GBS team, denoted as Target Name in the CADC database at http://www3.cadc-ccda.hia-iha.nrc-cnrc.gc.ca/en/jcmt/ | R.A.bbCentral position of each observation | decl.bbCentral position of each observation | ccPixel-to-pixel (rms) noise for the final mosaic of all of the observed PONG 1800s for the given area at 850 m and 450 m respectively. | ccPixel-to-pixel (rms) noise for the final mosaic of all of the observed PONG 1800s for the given area at 850 m and 450 m respectively. | ddEffective noise per beam (i.e., point source sensitivity) for the final mosaic of all of the observed PONG 1800s for the given area at 850 m and 450 m respectively. | ddEffective noise per beam (i.e., point source sensitivity) for the final mosaic of all of the observed PONG 1800s for the given area at 850 m and 450 m respectively. | NobseeTotal number of PONG 1800 observations taken at each wavelength. Note that this count may include partially completed scans. |
|---|---|---|---|---|---|---|---|---|
| (J2000.0) | (J2000.0) | (mJy arcsec-2) | (mJy bm-1) | |||||
| LDN 1622 | ORIONBN_850_solo | 5:54:33 | 1:49:34 | 0.053 | 2.0 | 3.9 | 98 | 6 |
| NGC 2068/2071 | ORIONBN_450_E | 5:47:55 | 0:13:60 | 0.050 | 1.0 | 3.7 | 49 | 6 |
| NGC 2068/2071 | ORIONBN_450_S | 5:46:17 | 0:06:30 | 0.050 | 1.2 | 3.7 | 59 | 6 |
| NGC 2068/2071 | ORIONBN_450_W | 5:45:55 | 0:24:42 | 0.055 | 1.7 | 4.0 | 84 | 6 |
| NGC 2068/2071 | ORIONBN_850_N | 5:47:33 | 0:45:26 | 0.047 | 0.9 | 3.4 | 44 | 6 |
| NGC 2023/2024 | ORIONBS_450_E | 5:42:38 | -1:54:19 | 0.049 | 1.1 | 3.6 | 54 | 6 |
| NGC 2023/2024 | ORIONBS_450_S | 5:41:16 | -2:18:26 | 0.051 | 0.8 | 3.7 | 39 | 4 |
| NGC 2023/2024 | ORIONBS_450_W | 5:40:34 | -1:48:26 | 0.052 | 0.9 | 3.8 | 44 | 4 |
| NGC 2023/2024 | ORIONBS_850_N | 5:43:39 | -1:09:11 | 0.047 | 1.0 | 3.4 | 49 | 6 |
| NGC 2023/2024 | ORIONBS_850_S | 5:41:53 | -1:24:41 | 0.043 | 1.2 | 3.1 | 59 | 7 |
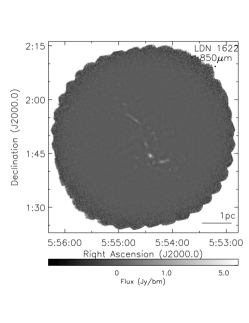
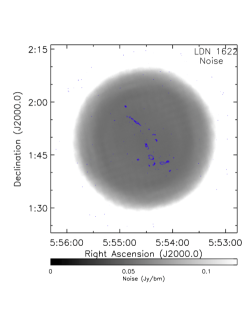
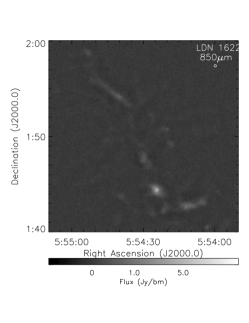
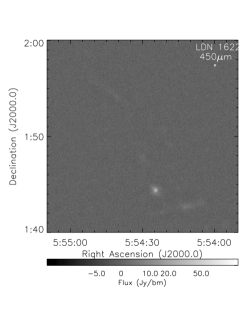
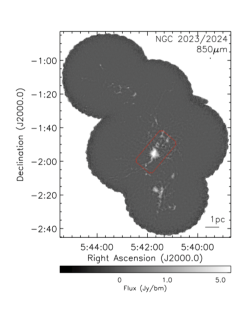
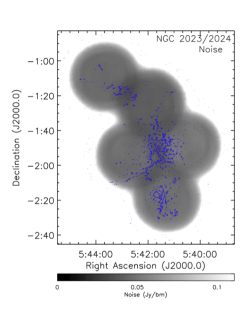
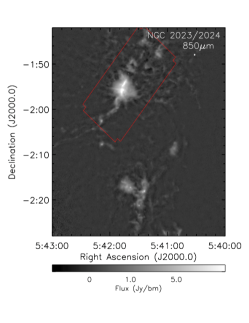
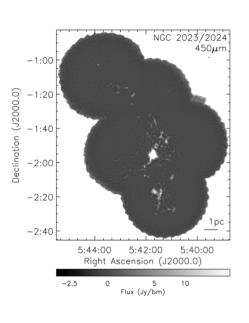
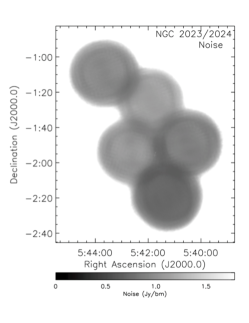
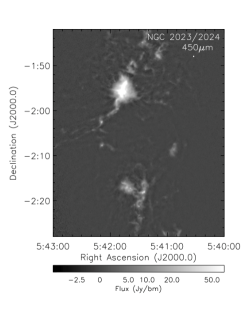
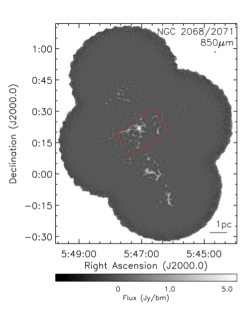
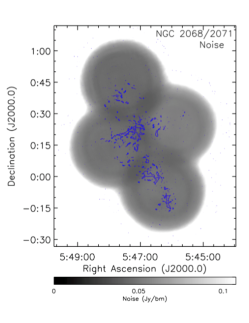
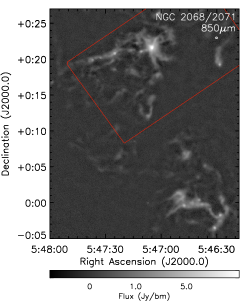
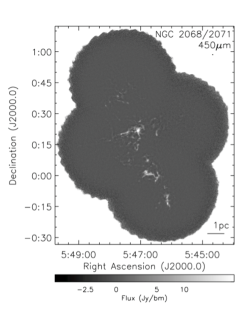
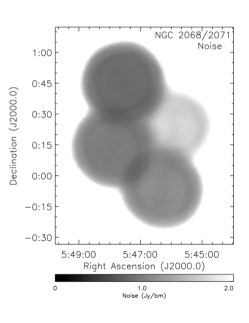
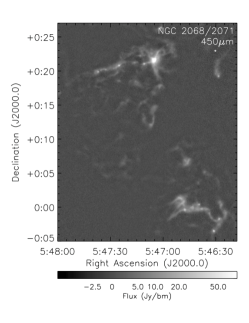
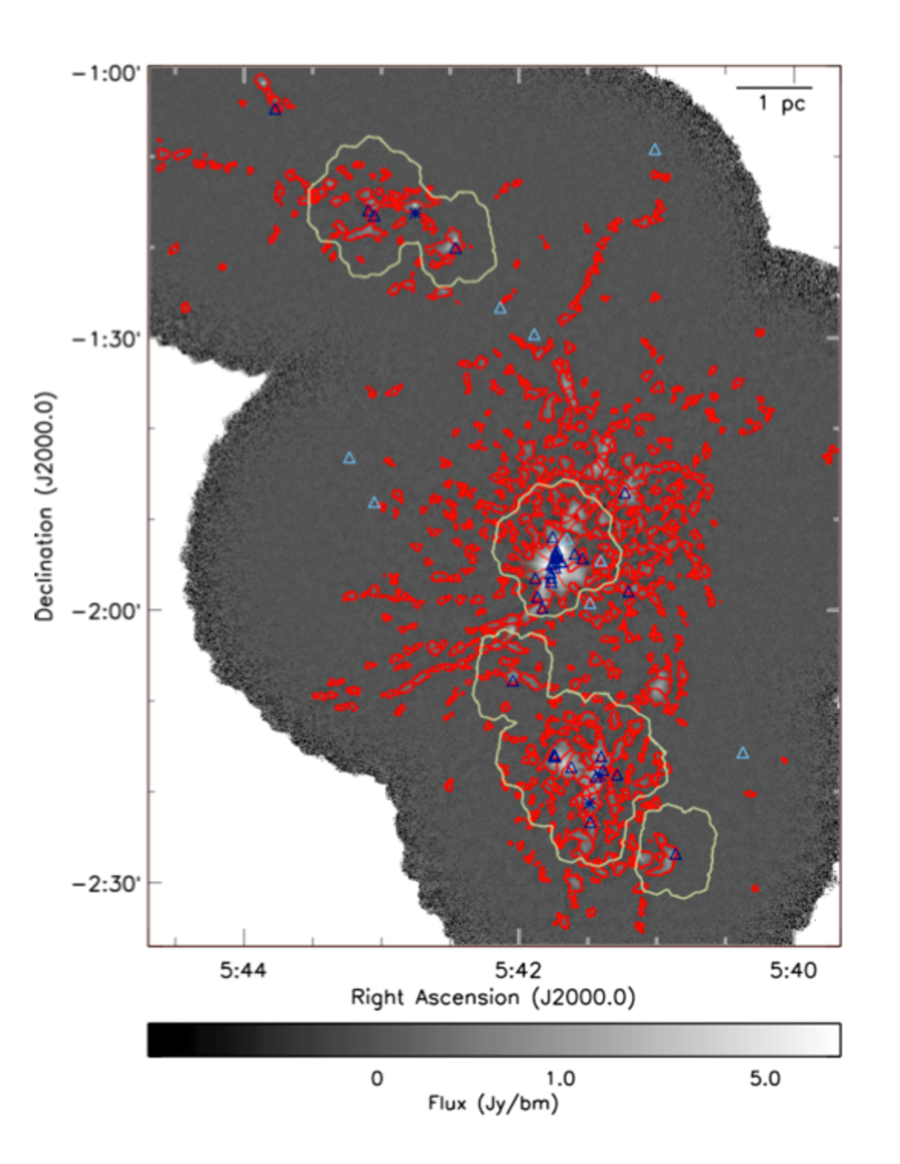
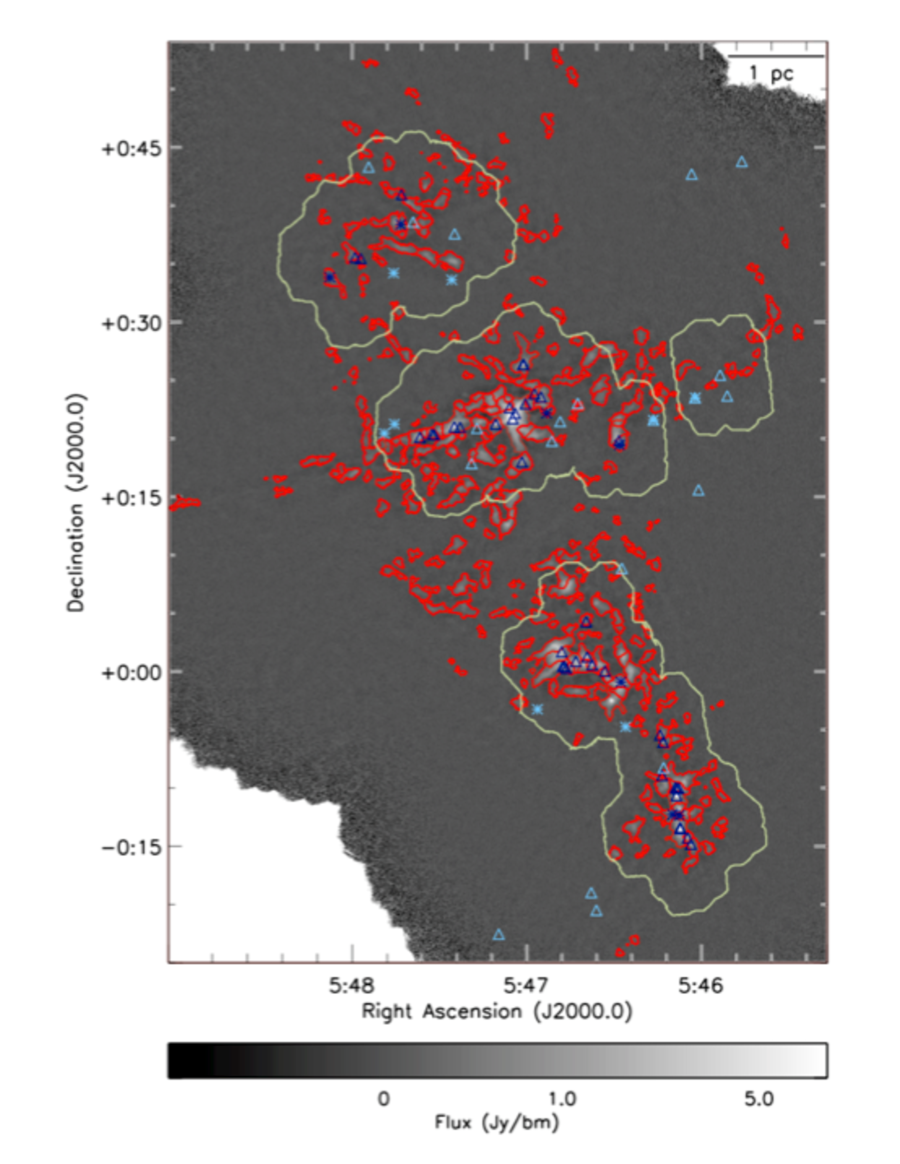
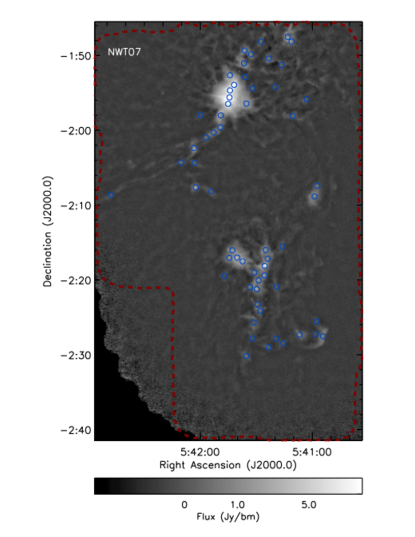
Figures 2 through 4 show the final reduced images, along with their associated noise maps. The external masks applied are indicated by the blue contours on the 850 m noise map. Note that the isolated pixels in the mask at the map edges will have no effect on the scale of a dense core, since the contiguous area within those parts of the mask is too small. Several of the brightest sources of emission in the maps are surrounded by negative (‘bowl’) features. These features may slightly diminish the sizes and total fluxes we derive for sources in Section 3, but based on artificial source-recovery tests discussed in Mairs et al. (2015) and our mask-making strategy, we expect our results to be accurate to 20% or better.
 |
 |
 |
 |
 |
 |
 |
 |
 |
 |
 |
 |
 |
 |
 |
 |
 |
 |
Portions of the NGC 2023/2024 and NGC 2068/2071 regions were also observed by the GBS in 12CO(3-2) with HARP (Buckle et al., 2010) and reduced using ORAC-DR (Jenness et al., 2015). These areas are indicated as contours in Figures 1, 3, and 4. The 12CO (3-2) emission line lies within the 850 m continuum band, and therefore some fraction of the 850 m flux may in fact not be thermal dust emission (e.g., Johnstone et al., 2003). Observations of other star-forming regions (e.g., Johnstone et al., 2003; Drabek et al., 2012; Sadavoy et al., 2013; Hatchell et al., 2013; Pattle et al., 2015; Salji et al., 2015; Buckle et al., 2015) have shown that this ‘contamination’ is generally not a large effect (%), the main exception being regions with faint dust emission and bright CO outflows, where the 12CO emission can dominate (up to 90%). Over the regions where we have HARP CO observations, we estimate the level of CO contamination on the observed 850 m flux. Following the procedure outlined in Drabek et al. (2012), we run an extra round of data reduction with the CO integrated intensity map included as a negative source of emission in each raw datafile, scaled to the atmospheric transmission of that evening. These CO-subtracted maps are then mosaicked together, and compared with the original 850 m mosaic. This procedure ensures that the CO data are filtered and processed identically to our 850 m data. We calculate the fractional CO contamination level as
| (1) |
where is the flux in the original 850 m map and is the flux in the CO-subtracted 850 m map. Most of the area mapped has below the (fractional) noise level at the same location, implying an overall very small contamination level. In NGC 2068/2071, several small zones at the outskirts of the NGC 2071 cluster show above the 20% level, but these are generally in areas of lower 850 m flux. In NGC 2023/2024, slightly off of the main NGC 2024 cluster, there are several dense cores which show contamination levels above 50% over part of their extent (less than half of their full extent, and usually substantially less). In general, however, the level of CO contamination is small. Since most of the cores fall outside of the region with CO observations, we do not include the CO flux corrections in any of our subsequent analysis.
3. SOURCE IDENTIFICATION
We identify cores in the three 850 m Orion B maps using FellWalker (Berry, 2015), a source identification algorithm available as part of the CUPID333http://www.starlink.ac.uk/cupid package (Berry et al., 2007) in Starlink. The basic premise of FellWalker is to define the peaks and sizes of objects in images based on local gradients, and the extent of pathways which lead to a given peak. Like the more traditionally-used ClumpFind algorithm (Williams et al., 1994), FellWalker does not assume a geometry when identifying cores. ClumpFind, however, splits zones of complex emission into multiple cores based on user-selected contour levels, whereas FellWalker relies on local gradients instead; Watson (2010) found FellWalker generally produces superior results to ClumpFind, including a generally better recovery of accurate peak and total fluxes of artifical cores inserted into maps. FellWalker provides both a listing of the peak flux position for each dense core and also a dense core footprint (i.e., a set of pixels all belonging to the core). Appendix A discusses the details of our source identification process.
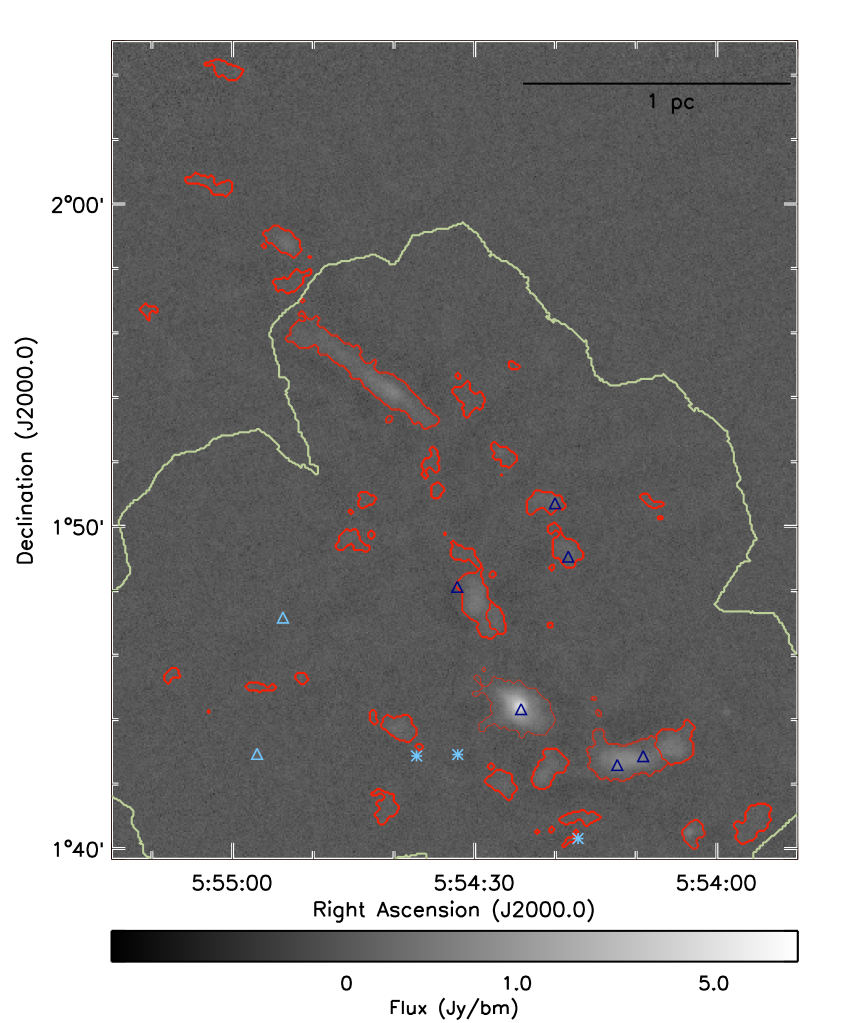
We ran FellWalker with very relaxed settings, identifying 260, 1383, and 1020 potential sources, from which we then culled unreliable sources from. After this subsequent elimination, we identified 29 reliable cores in L1622, 564 in NGC 2023/2024, and 322 in NGC 2068/2071. See Appendix A for more details on our core identification strategy. Our final core list includes cores with peaks potentially as low as twice the local noise level. While this is fainter than most core searches would be extended to, a careful comparison of the 850 m data with the Herschel 500 m data revealed that faint structures below the formal 3 typical cutoff were, in fact, real, and appear to have similar extents at both wavelengths. The dense cores we identify are shown in Figures 5 through 7, with the dense core footprints, and the Spitzer-identified protostars from Megeath et al. (2012) and Herschel-identified protostars from Stutz et al. (2013) also shown (see next section for more discussion on identifying protostellar cores). We note that in Figure 5, more closed contours are apparent than the total number of cores identified. FellWalker does not require that cores have contiguous boundaries, and therefore sometimes near a core edge, some pixels will be excluded, e.g., due to low flux, while other neighbouring pixels do satisfy all of the core criterion and are included. These isolated pixels represent a small fraction of individual cores and by definition are located in low-flux areas of the map. Therefore, these isolated pixels have minimal influence on the properties we measure (recall that the core size is based on the total area of the core footprint, not the maximal core extent).
Table 4 provides a full list of the dense cores we identify within each of the three regions. In the table, core locations correspond to the position of peak flux within the core. The peak flux and total flux are calculated without any background emission subtracted, but see Section 4 for further treatment of this issue. The peak flux is given in Jy bm-1, with the conversion from mJy arcsec-2 made assuming an effective beam size of 14.6 ″ (Dempsey et al., 2013). The core size is the effective radius, , calculated as the radius of a circle which spans the same area as the dense core (calculated using the full dense core footprint). For cores where HARP CO observations were made, we also include the fraction of the core’s area covered by the CO data, and the resulting core peak fluxes and total fluxes at 850 m with the contribution from CO emission removed. We also calculate the peak and total 450 m flux using the same dense core footprints as the 850 m data. Note that we do not make any attempt to account for the noise level at 450 m within the dense core footprints. In effect, cores with little to no 450 m emission above the noise level may have a negative total flux within the core footprint.
The original SCUBA instrument at JCMT observed parts of NGC 2023/2024 and NGC 2068/2071 (e.g., Motte et al., 2001; Mitchell et al., 2001; Johnstone et al., 2001, 2006; Nutter & Ward-Thompson, 2007). Motte et al. (2001) used a wavelet-based scheme to identify dense cores, which generally identifies more compact regions of emission. Other SCUBA analyses (Mitchell et al., 2001; Johnstone et al., 2001, 2006; Nutter & Ward-Thompson, 2007) used ClumpFind, which tends to act more similarly to FellWalker, in identifying larger zones of emission around each core. We provide a detailed comparison of the dense cores identified in Nutter & Ward-Thompson (2007) as well as those published in the SCUBA Legacy Catalogue (Di Francesco et al., 2008) with our SCUBA-2 results in Appendix B. We find generally good agreement between the cores identified in SCUBA and their corresponding match in the SCUBA-2 data. Different core identification schemes, however, can subdivide regions of complex emission differently, which generally leads to larger differences in the total fluxes and sizes of the cores between the two measurements than peak fluxes. The SCUBA-2 observations are factors of four to six times more sensitive than the SCUBA observations, with a median noise level of 3.7 mJy bm-1 compared to 16-23 mJy bm-1 in SCUBA (Nutter & Ward-Thompson, 2007).
4. DENSE CORE PROPERTIES
We first classify all of the dense cores as starless or protostellar. Our aim is to make a conservative list of starless cores. We start by using the Spitzer catalogue from Megeath et al. (2012) to identify protostars. Specifically, any dense core which contained one or more protostars listed in the ‘all protostars’ list from Megeath et al. (2012) within the dense core’s boundary was classified as protostellar. We supplement our list of protostars by running a similar procedure on the full list of candidate protostars from Stutz et al. (2013) using Herschel data. In other words, if any pixel of a core has a protostar lying within it from either catalogue, we classify the core as protostellar. We note that the Herschel catalogue covers a smaller area within Orion B, and focuses exclusively on the most embedded YSOs. This procedure allows us to identify five protostellar cores in L1622, 25 in NGC 2023/2024 (of which 3 were Herschel-based) and 34 in NGC 2068/2071 (of which 6 were Herschel-based). The number of starless cores in each region is therefore 24, 539, and 288 in L1622, NGC 2023/2024, and NGC 2068/2071 respectively. Table 4 denotes which dense cores we defined as protostellar.
4.1. Masses
In addition to the dense core properties returned directly from FellWalker (size, peak flux, and total flux), the core mass is an important property. Using only the total 850 m flux measured for each core, we estimate the mass using the equation
| (2) |
from Hildebrand (1983), where is the total flux at frequency , is the dust opacity, and is the black body function at temperature . This simplifies to
| (3) |
with in solar masses and in Jy bm-1. We adopt a dust opacity of cm2 g-1 with , i.e., cm2 g-1, following Pattle et al. (2015) and Salji et al. (2015) among others, and a distance of 415 pc following Buckle et al. (2010). These two assumptions are similar to those used in previous SCUBA analyses. Note, however, that Motte et al. (2001), Johnstone et al. (2006), and Nutter & Ward-Thompson (2007) assume a distance of 400 pc, while Johnstone et al. (2001) assumes 450 pc. Also, Johnstone et al. (2001) and Nutter & Ward-Thompson (2007) assume cm2 g-1 while Motte et al. (2001) and Johnstone et al. (2006) assume cm2 g-1.
The dense cores are likely to have a range of temperatures (both within each core, and core-to-core), although the largest variation would be expected for the protostellar cores. Schneider et al. (2013) find dust temperatures of K or higher around the NGC 2023/2024 and NGC 2068/2071 clusters, where most of the SCUBA-2 emission is observed444While the maps at each Herschel wavelength analyzed by Schneider et al. (2013) are publicly released, the derived temperature and column density maps are not similarly available at present. A full re-derivation of the dust temperature across Orion B based on the Herschel data is beyond the scope of our present analysis.. We therefore assume a constant temperature of 20 K, consistent with Johnstone et al. (2006) and Nutter & Ward-Thompson (2007), as well as Sadavoy et al. (2010); Motte et al. (2001), however, assumed a temperature of 15 K for starless cores and 20-40 K for protostellar cores, while Johnstone et al. (2001) assumed a constant value of 30 K. Johnstone et al. (2006) note the four most massive cores they identified in Orion B are known to harbour bright far infrared sources which have heated them to above 50 K, which would lower their estimated masses considerably from the value measured assuming 20 K. At 50 K, the masses would be a factor of 3.3 lower than assuming a temperature of 20 K. We expect high temperatures to be most likely in some of the brightest protostellar cores, where the masses we estimate are largest. Uncertainties in the dust opacity and cloud distance also increase the uncertainty in the dense core mass estimates. The dust opacity at 850 m likely has some variation across the cloud, with some inter-core and core-to-core variations, as seen in the variations measured across the Perseus molecular cloud by Chen et al (2015, submitted) and Sadavoy et al. (2013). We expect that the distance will generally be relatively constant across the cloud, and is more likely to affect global population values (i.e., changes would increase / decrease all masses by the same factor), and should have a smaller effect on the relative masses estimated.
In addition to the uncertainties in the conversion factor between flux and mass, there is one other important consideration. Structures within molecular clouds are hierarchical in nature, although our SCUBA-2 observations are insensitive to the largest of these structures. Source identification algorithms such as FellWalker associate zones of emission with a single source, whereas other types of algorithms such as those based on dendrograms (e.g., Rosolowsky et al., 2008) treat emission as nested levels in a hierarchy of emission. Under the latter scheme, only a fraction of the total emission at a given position would be associated with the top level of the hierarchical structure (i.e., the dense core), while some fraction of the emission would be associated with underlying larger structures. We therefore make a second estimate of the total flux associated with each core which accounts for some of this larger-scale structure. Conservatively, we take the median flux value of pixels along the boundary of a core as representing the constant background level of underlying layers of structure, and subtract that value from every pixel lying within the core. We refer to this as the background-subtracted total flux (and mass), and include the background-subtracted flux in Table 4. This background subtraction method will overestimate the contribution of larger-scale emission, particularly in the more clustered parts of the cloud, and therefore provides a strict lower limit to the dense core masses.
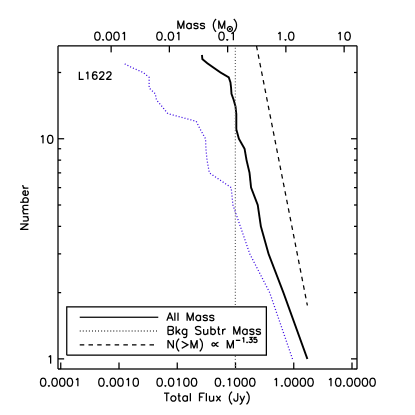
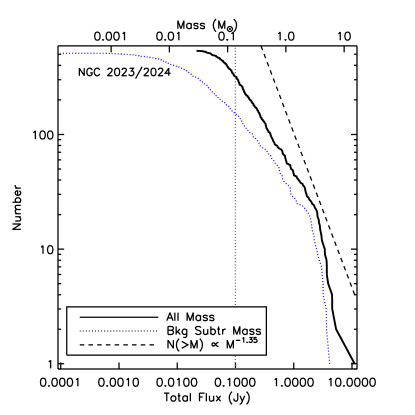
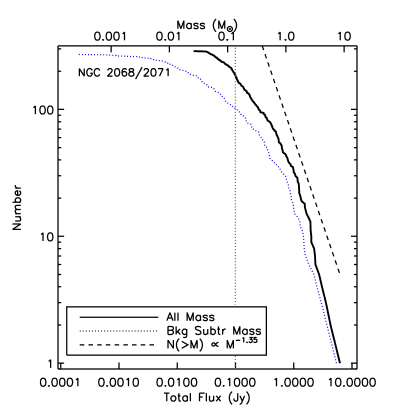
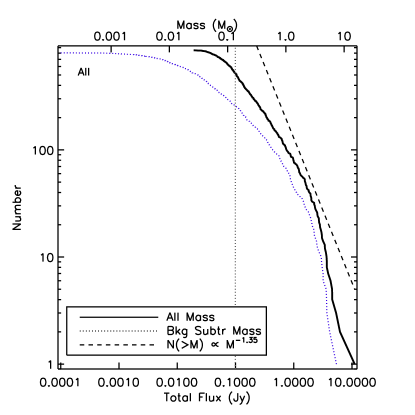
Figure 8 shows the cumulative mass functions measured from the total and background subtracted fluxes for the starless core population in each of the three regions observed (top row and bottom left panel), and also as a combined sample (bottom right panel). We omit the protostellar cores on the basis that their masses are more likely to be over-estimated by assuming a constant temperature of 20 K. We estimate the completeness level from a flux level of 3 across an area equal to the median starless core size. At the higher-mass end of the distribution, the slope is roughly consistent with the canonical Salpeter IMF (Salpeter, 1955), for either estimate of the dense core masses. This similarity of the slope with the Salpeter IMF agrees with the original SCUBA analysis of Motte et al. (2001), and the combined SCUBA Orion A and B results of Nutter & Ward-Thompson (2007), among others. Although the Herschel core mass distribution for Orion B is not yet available for a direct comparison (see, however, Schneider et al., 2013, for the Orion B column density PDF), other star-forming regions tend to follow a similar profile (see, e.g., André et al., 2014).
At the very highest masses, we appear to have a slight deficit of starless cores relative to a pure Salpeter distribution. For example, extrapolating the mass function shown in black from around 1 Jy (around 1 M⊙) up to 10 Jy using a Salpeter slope implies that there should be roughly three cores with total fluxes above 10 Jy, whereas our sample contains only one. The discrepancy between the Salpeter slope and the observed distribution of cores becomes even larger when the background subtracted masses are used instead. Both, however, are consistent within 3 Poisson uncertainties. An even larger sample of dense cores, ideally at least ten times more cores with high masses, would be needed to confirm whether or not this result is statistically significant. An absence of massive dense starless cores might be partially attributable to the tendency of object-identification algorithms to split large sources into multiple components. A real dearth of the most massive starless cores might also be partially attributable to a slightly higher detection rate of protostars in the infrared; since massive cores tend to have higher densities, it is possible that their natal protostars would tend to have higher accretion rates, and therefore higher luminosities. A larger sample size, combined with a detailed consideration of the typical accretion rates derived for detected protostars, would be necessary to test this scenario.
 |
 |
 |
 |
4.2. Core Stability
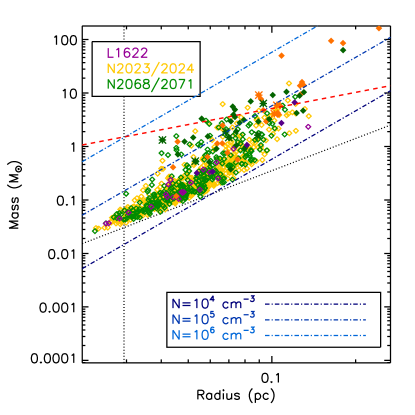
Using the sizes and estimated masses of all the dense cores, we can determine which cores are stable to gravitational collapse. Figure 9 shows the core masses and radii for all three regions, as indicated by the different colours. The JCMT effective beam width and the approximate flux sensitivity, i.e., three times the median noise level integrated across a given area are also shown. Our core selection criterion is slightly more complex than can be captured by a single completeness level. In particular, we removed sources that failed several local signal-to-noise ratio criteria, which are more stringent than the global level indicated. In Figure 9, we show masses derived from the total fluxes of all cores (left panel), as well as masses derived from background- subtracted total fluxes (right panel). The background-subtracted mass estimates tend to be smaller (as expected), and can be significantly smaller than our nominal total mass completeness level. We emphasize that our simple method for estimating the background level overestimates the true core background, likely by a significant amount for cores in crowded regions, and therefore those results should be treated with caution.
 |
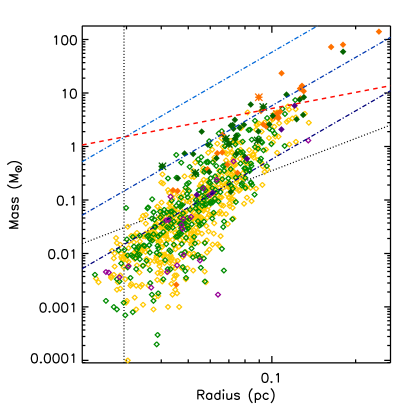 |
Assuming a spherical geometry for the dense cores allows us to estimate their mean densities. Lines of constant density of cm-3, cm-3, and cm-3 are plotted in Figure 9. Most of the cores in the left panel lie between cm-3 and several cm-3. Although not explicitly calculated there, the range spanned by our more massive dense cores is similar to that inferred from Figure 5 of Johnstone et al. (2001) and Figure 7 of Johnstone et al. (2006). Motte et al. (2001) use a wavelet-based source-finder and include deconvolution of the telescope beam in their final size measurement, which tends to lead to smaller sizes (and therefore higher mean densities) than we report. We also compared our results to those we would obtain using core sizes deconvolved by the telescope beam. Deconvolution had little effect most cores, since the majority of cores that we identify are significantly larger than the beam.
In Figure 9, we also plot the locus of Jeans mass for each radius for an assumed temperature of 20 K. Dense cores above the Jeans mass locus are expected to be unstable to collapse if thermal pressure provides the only avenue of support against gravitational collapse, and indeed, the majority of cores in this regime are associated with a protostar (of 33 cores in the unstable regime, 24 are protostellar), although we caution that the protostellar masses may be overestimated. Using instead the background-subtracted mass decreases the already small number of cores which lie above the Jeans instability line (17 unstable cores, of which 15 are protostellar). Johnstone et al. (2001) and Johnstone et al. (2006) similarly found that most dense cores lie within the range of stable Bonnor-Ebert sphere models (an equilibrium isothermal sphere model; Ebert, 1955; Bonnor, 1956). In addition, cores above this range tended to have high central concentrations, which are correlated with the presence of protostars (see discussion in the following section). Motte et al. (2001), however, argued that most of their identified dense cores were gravitationally unstable, with this difference being directly attributable to their smaller core size measurements obtained using a wavelet-based technique.
The inclusion of velocity information from a dense gas tracer is important to determine the role of turbulent motions in offsetting gravitational instability. While primarily sensitive to more diffuse gas than our SCUBA-2 observations, HARP 13CO and C18O observations of NGC 2023/2024 and NGC 2068/2071 show typical line widths of 1 – 3 km s-1 (Buckle et al., 2010), suggesting that some level of non-thermal support is likely present in the Orion B dense cores. With observations of a dense gas tracer such as N2H+, a more detailed consideration can be made of the level of non-thermal support present for each dense core (e.g., Kirk et al., 2007; Pattle et al., 2015). While non-thermal support mechanisms can explain the presence of starless cores lying above the Jeans stability line, it is harder to understand the presence of protostellar cores which appear to be Jeans stable. The most likely possibility is that the core boundaries we use in our analysis encompass both a smaller-scale unstable region where the protostar has formed and a larger-scale zone around it which is still stable, therefore making the core as a whole to appear to be stable.
4.3. Concentration
We measure the central concentration of each dense core as:
| (4) |
following Johnstone et al. (2001), where is the effective beam width (in arcsec), is the total flux (in Jy), is the effective radius (in arcsec; see Section 3 for the definition of ), and is the peak flux (in Jy bm-1). For dense cores that are well-approximated by the Bonnor-Ebert sphere model, those having concentrations above 0.72 would be unstable to gravitational collapse (Johnstone et al., 2001). Previous work (Jørgensen et al., 2007, 2008; van Kempen et al., 2009) has also shown that highly concentrated dense cores tend to be associated with protostars.
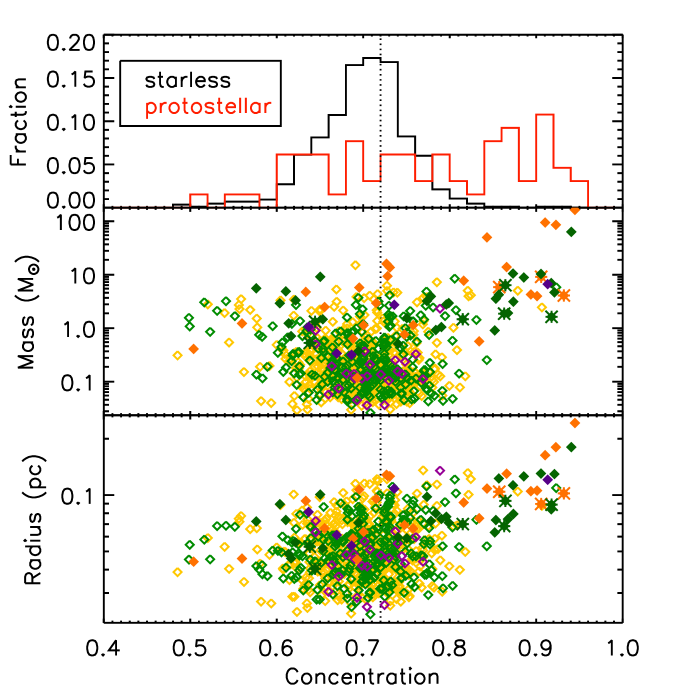
In Figure 10, we show the concentration of the dense cores compared with their masses and effective radii. The top panel shows that the majority of protostellar cores have high concentrations that are normally taken to indicate gravitational instability (42 protostellar cores, versus 23 at lower concentrations). The starless cores have a much tighter distribution of concentrations around a value of , which a two-sided KS test shows is statistically distinct, with a probability of that the protostellar and starless core concentrations were drawn from the same parent sample. We note that some of the cores are elongated, complicating both the application of the Bonnor-Ebert sphere model and the interpretation of the concentration measurement. FellWalker does not calculate core elongations, since it does not fit any pre-determined shape to the cores. We use the ratio of the ‘size’ of the core along the horizontal and vertical axes, each defined as the flux-weighted standard deviation of core pixel values from the flux-weighted centre position, as a rough proxy for core elongation. With this measure, only 12% of the cores are elongated (ratios of 2 or higher), and they have a similar distribution of concentrations and effective radii to the other cores, so they do not bias the global distribution.
Lower concentrations for protostellar cores could indicate more evolved sources (c.f. van Kempen et al., 2009). SCUBA-2 is insensitive to the mass contained within the central protostar itself, so a protostar which has accreted much of the mass in its envelope would tend to have a lower concentration (see Mairs et al., 2014, for a discussion of protostellar mass versus ‘envelope’ mass in the context of comparisons with numerical simulations). The protostellar cores which lie the furthest below the thermal Jeans line, and those with smaller total masses both tend to have lower concentrations as well, which supports this hypothesis.
In contrast to prior work, we find that a significant number of starless dense cores have high concentrations that would nominally indicate instability (299 starless cores have concentrations above 0.72 while 551 have lower concentrations). At least some of these higher values of concentrations are likely attributable to the increased sensitivity of SCUBA-2 compared with SCUBA. Johnstone et al. (2003) and Johnstone et al. (2006) find a range of concentrations from about 0.3 to 0.9 for dense cores in Orion B using SCUBA data, whereas our concentration measurements range between roughly 0.5 and 0.95. Since the resolution of SCUBA and SCUBA-2 are identical, these differences must be attributable to the improved sensitivity of SCUBA-2 data and possibly also the core identification algorithm used (ClumpFind versus FellWalker). FellWalker, like ClumpFind, tends to include lower flux material around peaks within the boundary of a core. Thus, cores identified in higher sensitivity observations will tend to have larger sizes and total fluxes, with the core area increasing faster than the total flux (since only faint pixels are being added). We therefore expect that the increased sensitivity of the SCUBA-2 observations, coupled with the improved recovery of larger-scale emission, will increase the concentrations of our cores relative to similar analyses of SCUBA observations. At the same time, cores with larger areas relative to their fluxes (or masses) will appear more stable in the mass versus radius analysis shown in Figure 9.
4.4. Dense Cores and Ambient Cloud Pressure
Lombardi et al. (2014) used a combination of Planck and Herschel data across Orion (A and B clouds) to estimate the total column density of material down to a resolution of 36″ in areas with Herschel coverage. We use this map, including Lombardi et al.’s recommended scalings between optical depth at 850 m and total column density, to compare with the SCUBA-2 dense cores. L1622 falls outside of the Lombardi et al. (2014) column density map, and so is not included in this analysis. Previous analyses (e.g., Onishi et al., 1998; Johnstone et al., 2004; Hatchell et al., 2005; Kirk et al., 2006; Enoch et al., 2006, 2007; Könyves et al., 2013) have shown that dense cores tend to be found in regions of higher overall column density, although historically these analyses have relied on much lower resolution measurements of the overall cloud column density.
Under the assumption that a molecular cloud is a sphere, the column density at a given location within the cloud can be used as a proxy for the external pressure due to the overlying weight of the cloud. In this simple model, a higher local column density implies a three dimensional position closer to the cloud centre, and hence a larger weight of overlying cloud material. While the Lombardi et al. (2014) column density map clearly shows that the Orion B cloud is more complex than a sphere, the spherical assumption provides a practical method to estimate the bounding pressure on dense cores due to the ambient cloud material. Furthermore, the model’s implication that sources in higher column density zones are likely surrounded by more material than those in lower column density zones seems generally reasonable. Following McKee (1989), and the implementation in Kirk et al. (2006), the pressure at depth in a cloud is given by
| (5) |
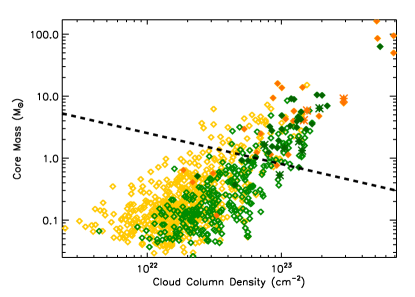
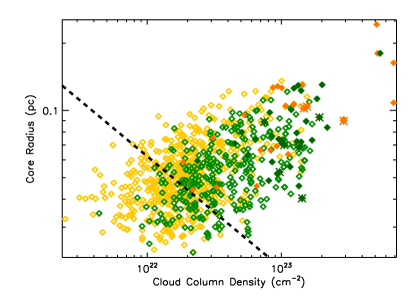
where is the mean column density and is the column density measured at cloud depth . For cores near the cloud centre, the column density along the line of sight to the core is roughly twice this value, i.e., . In both NGC 2023/2024 and NGC 2068/2071, the mean cloud column density over the area observed by SCUBA-2 is cm-2. For each core, we measure the local cloud column density as the maximum value of the Lombardi et al. (2014) column density map within the core’s footprint (there are typically only a few resolution elements within each core footprint). If we make the assumption that the cores can be well represented by an isothermal sphere model, the critical radius and mass of each core can be written as
| (6) |
and
| (7) |
where is the sound speed and the gravitational constant (equations adapted from Hartmann, 1998). In Figure 11, we show the relationship between core sizes and masses and the total cloud column density at the core positions. We see a strong correlation between the cloud column density and the core masses, and a weak correlation between the cloud column density and the core sizes, in contrast with Sadavoy et al. (2010), who compared SCUBA-based dense core properties with extinction-based column density measures in five nearby molecular clouds, including Orion. Given the large scatter in the relationships that we observe, we expect the discrepancy with Sadavoy et al. (2010) is the result of the much larger number of dense cores in our present analysis, and the larger parameter space that they occupy.
With the pressure of the overlying cloud material estimated using the spherical-cloud assumption discussed above, many of the cores have sizes and masses larger than can be thermally supported given this external weight of the cloud. By size, all protostars and 522 of 826 starless cores lie above the critical value, while by mass, 50 of 60 protostars and 101 of 826 starless cores lie above the critical value (note that cores in L1622 are not included in this analysis). The fraction of cores deemed unstable by this simple pressure analysis is a significant change from the apparent thermal stability of the dense cores seen in Figure 9 (24 of 60 protostellar cores lie above the thermal Jeans mass compared to 9 of 826 starless cores; see Section 4.2) and shows that the pressure from the ambient molecular cloud plays a strong role dense core stability. A similar result has been seen in other dense core analyses (e.g., Kirk et al., 2007; Lada et al., 2008; Pattle et al., 2015). Beyond stability considerations from a hydrostatic equilibrium model, non-thermal forces may be contributing significantly to the pressure on individual cores, which might help to explain the large scatter apparent in Figure 11.
While we identify dense cores inhabiting a wide range of cloud column densities, we note that the correlation between the cores’ size or mass with the cloud column density also implies that there is a minimum column density value at which pressure-unstable cores are found. This minimum column density is approximately 1022 cm-2, which is somewhat higher than the column density threshold observed in nearby star-forming regions, which is usually around 5-7 cm-2 (e.g., Onishi et al., 1998; Johnstone et al., 2004; Kirk et al., 2006; Enoch et al., 2006, 2007; Könyves et al., 2013).
 |
 |
4.5. Cloud Structure and Core Lifetimes
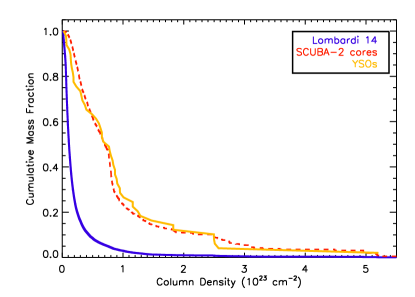
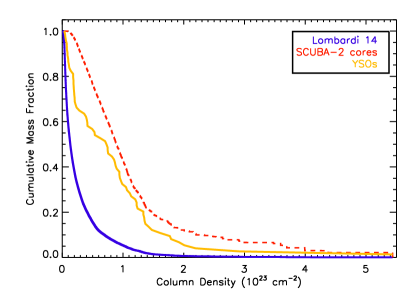
In Figure 12, we compare the cumulative mass fractions of dense cores (using the total mass estimated) and cloud mass as functions of the cloud column density from Lombardi et al. (2014) for NGC 2023/2024 and NGC 2068/2071. For a fair comparison between the dense core mass and cloud mass fractions, we consider only areas observed with SCUBA-2. For the dense cores, we take the column density at each pixel that lies within a dense core footprint (excluding other pixels as noise). Figure 12 shows that the dense cores seen by SCUBA-2 are associated with the highest column density material. For example, roughly 24% and 43% of the mass in SCUBA-2 cores in NGC 2023/2024 and NGC 2068/2071 respectively is associated with total column densities above cm-2, whereas only a small fraction of the cloud material (3% and 5% respectively) lies within this range. We also compare in Figure 12 the protostar number fraction with the column density at the locations of protostars from Megeath et al. (2012) and Stutz et al. (2013). Assuming that all protostars have similar masses, the fractional number of protostars within a column density contour is equivalent to their fractional mass within that same contour. We find that the protostars are also concentrated in regions of high column density, although slightly less so than the dense cores in NGC 2068/2071. Since the protostellar list from Megeath et al. (2012) likely includes some slightly older protostars that have drifted from their birthsites, it is not surprising for a YSO population to have a slightly wider range of column densities than the dense cores.
 |
 |
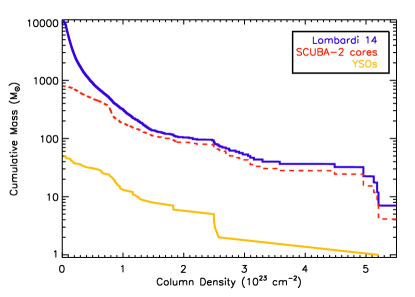
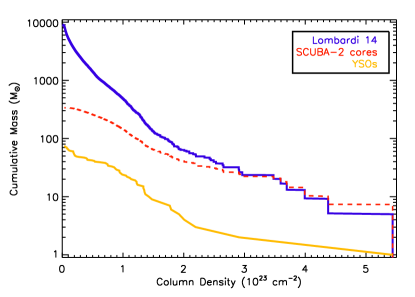
We can also consider the above distributions in terms of total masses, as shown in Figure 13. The total mass in NGC 2023/2024 and NGC 2068/2071 within the areas observed by SCUBA-2 is 10600 M⊙ and 9000 M⊙, respectively, while the total mass in dense cores is 780 M⊙ and 340 M⊙, respectively. Again, we emphasize that the dense core masses are estimated assuming a constant temperature of 20 K. Both NGC 2023/2024 and NGC 2068/2071 have several large and massive protostellar dense cores for which this assumption will cause the mass to be overestimated. These particular dense cores are coincident with the highest total column densities in the Lombardi et al. (2014) map, which is responsible for making the total dense core mass strangely appear larger than the total gas and dust mass at the highest column densities in Figure 13. It is also likely that, due to their slightly lower resolution (compared to SCUBA-2), Lombardi et al. (2014) may slightly underestimate the total mass in the highest column density and smallest scale structures. Even with these caveats, it is interesting to note that above cm-2, nearly all of the high column density material is already in dense cores. Below this column density, the dense cores represent an ever-decreasing fraction of the total mass.
At the highest column densities, 10-20% of the dense core material is already located within protostars, if we make the assumption that each protostar has a mass of 0.5 M⊙. At lower column densities, the mass in YSOs is only around 6% of the dense core mass in NGC 2023/2024 while it is 16 – 22% in NGC 2068/2071. In both regions, the mass within YSOs is less than 1% of the total cloud mass. There is no indication of a strong relationship between the total column density and the ratio of YSO mass to dense core mass, though it is possible that systematic biases in our simple mass estimations which hide such a trend (e.g., if YSOs tend to be more massive in high column density environments). At lower column densities, the ratio of YSO mass to dense core mass in NGC 2023/2024 is roughly a factor of 4 lower than in NGC 2068/2071. This result could imply that NGC 2023/2024 is younger, and that the protostars there have only started to form recently. Although the total numbers of sources are small, Stutz et al. (2013) also found a higher proportion of the youngest protostellar candidates (“PBRs”) in NGC 2023/2024 than in NGC 2068/2071 relative to YSOs found in the Spitzer-based catalogue of Megeath et al. (2012). This result also supports the scenario of NGC 2023/2024 being younger, as does the relatively larger percentage of YSOs that we see at lower column densities in NGC 2068/2071 (Figure 12).
 |
 |
The ratio of starless cores to protostellar cores has also been used as a tool to estimate the relative lifetimes of the two stages, with the estimated protostellar lifetime then used as an anchor to obtain absolute lifetimes. Previous analyses of dense cores detected with SCUBA and similar instruments have suggested lifetimes of both to be several tenths of a Myr, with a similar number of protostellar and starless cores identified (e.g., Enoch et al., 2008; Hatchell et al., 2007; Kirk et al., 2005), while earlier analyses, such as that of Jessop & Ward-Thompson (2000) suggested the starless core lifetime decreases with the core’s volume density. With our more sensitive census of cores detected with SCUBA-2, we identify a much larger population of starless dense cores, and can re-visit this question, although we caution that examining only cores within a single cloud may introduce some bias. Furthermore, some of the dense cores in our sample may be transient features which never evolve to form a star. In our full sample, we have 851 starless cores and 64 protostellar cores, i.e., a ratio of 13:1. If we sub-divide the dense cores into bins of varying mean density, we find a roughly 1:1 ratio for starless to protostellar cores above mean densities of cm-3, and a rapidly increasing ratio beyond that, as shown in Table 2. In Table 2, we include the ratio of protostellar cores for both the full dense core sample, as well as when the cores are restricted to those more massive than 0.1 M⊙ (i.e., those which presently have sufficient mass to form a star and may therefore be less likely to be transient features). While the protostellar ratios differ in the lower density bins, depending on which sample is examined, both show the same trend of a protostellar ratio which decreases rapidly with protostar density. This result is qualitatively in agreement with Jessop & Ward-Thompson (2000) in that dense core lifetimes do indeed appear to be longer for cores with lower mean density. We caution, however, that our assumption of a constant temperature tends to bias the protostellar core masses (and hence mean densities) to higher values, which would therefore serve to increase the fraction of protostellar cores in the higher density bins from their true value. Similarly, if some starless cores were colder than 20 K, their masses and densities would be underestimated which would increase the number of starless cores in the higher density bins.
The concentration measured for each core is likely to be less biased by a non-constant temperature than density / mass estimates are. Separating the dense cores into those with high and low concentrations (above and below the nominal maximum stable value of 0.72) shows that more concentrated dense cores are more likely to be protostellar. The starless to protostellar core ratio for high concentrations is 7:1 (299 versus 42) while the ratio for low concentrations is 24:1 (551 versus 23). We note that these ratios are very similar when only dense cores more massive than 0.1 M⊙ are considered: there, the ratios are 6:1 and 22:1 respectively.
Both the concentration and mean density results support the simple picture that as dense cores evolve, they tend to become denser and more centrally concentrated before they are able to form a protostar.
| Density RangeaaMean core densities calculated using the total mass and effective radius. | All CoresbbNumber of starless cores, protostellar cores, and their ratio for the full dense core sample. | Cores M⊙ccNumber of starless cores, protostellar cores, and their ratio for dense cores above 0.1 M⊙. | ||||
|---|---|---|---|---|---|---|
| (cm-3) | Nsl | Np | Ratio | Nsl | Np | Ratio |
| 34 | 31 | 1:1 | 34 | 31 | 1:1 | |
| 270 | 29 | 9:1 | 205 | 29 | 7:1 | |
| 546 | 5 | 109:1 | 392 | 5 | 78:1 | |
5. DISCUSSION
Lada et al. (1991) identified roughly 300 YSOs in each of the NGC 2023/2024 and NGC 2068/2071 regions, corresponding to an additional 150 M⊙ for each region beyond the YSO masses discussed in the previous section. With an efficiency of converting dense core mass into YSOs of 30%, approximately 235 M⊙ and 100 M⊙ of YSOs in NGC 2023/2024 and NGC 2068/2071, respectively, may be created from the current population of dense cores. This number would roughly double the existing stellar populations in both regions, and is several times larger than the existing YSO population in either region. The total amount of mass at lower densities in each region is around 10000 M⊙; if even 1% of this mass ends up also contributing to future stars, it would contribute about the same amount of stars again. Both of these regions therefore may one day harbour stellar clusters containing many hundreds of stars. At the present star formation rate, it will take several million years to deplete the current population of dense cores. Since the most massive dense starless cores present reach only about 10 M⊙, it is likely that B stars will be the most massive that can eventually form and help to drive the dissipation of the remaining cloud material.
L1622 appears to have less material available to form additional YSOs with a total dense core mass of 18 M⊙ and roughly 6 M⊙ presently in YSOs. The total cloud mass cannot be estimated to the same precision as NGC 2023/2024 and NGC 2068/2071 since a full column density map is not presently available. Based on the CO maps of Maddalena et al. (1986), however, L1622 appears to be a factor of at least several less massive than NGC 2023/2024 or NGC 2068/2071. This too suggests that a limited amount of star formation may occur in the future in L1622. As outlined in the introduction, the distance to L1622 is less certain, and some observations suggest a distance of pc (see discussion in Reipurth et al., 2008). If this closer distance is indeed correct, then L1622 would be an even more quiescent region than our analysis here suggests. For example, all of the core sizes would increase by a factor of , while the masses would decrease by a factor of . Also, the shorter distance would push all of the cores below the thermal Jeans line in Figure 9, while the cores’ concentrations would remain unchanged. Since L1622 cores represent a small fraction of the total core population analyzed here, there would be minimal impact on our overall conclusions.
6. CONCLUSION
We have presented a first-look analysis of SCUBA-2 observations of the Orion B molecular cloud taken as part of the JCMT Gould Belt Survey. The improved sensitivity and larger detector size of SCUBA-2 compared to SCUBA has allowed for significantly larger and more sensitive maps, with these SCUBA-2 observations reaching an rms of 3.7 mJy bm-1, four to six times lower than previous SCUBA observations. Approximately 0.6, 2.1, and 1.7 square degrees were mapped in L1622, NGC 2023/2024, and NGC 2068/2071, respectively. In addition to the catalogues presented here, all of the reduced datasets analyzed in this paper (850 m and 450 m emission maps, the CO-subtracted 850 m map, and the 850 µm-based FellWalker core footprint, along with maps of the variance per pixel, and the external mask applied) are available at https://doi.org/10.11570/16.0003.
We used the FellWalker algorithm to identify 915 dense cores within the 850 m map, and analyzed their basic properties. Protostellar dense cores are identified through association with a protostar in the Spitzer (Megeath et al., 2012) or Herschel (Stutz et al., 2013) catalogues. Assuming a constant temperature of 20 K yields a starless core mass function similar to that derived in other studies, with the high-mass end following a roughly Salpeter slope. Comparing the core masses and radii showed that most cores have mean densities between cm-3 and several cm-3. Dense cores with masses above the thermal Jeans mass for the assumed temperature of 20 K tend to be protostellar, although there are both starless cores and protostars on both sides of this relationship. A larger number of cores appear to be unstable when the bounding pressure due to the weight of the overlying cloud material is accounted for. We measure a range of central concentrations for the dense cores which tends to have larger values than previous SCUBA analyses (Johnstone et al., 2003, 2006), which we speculate is due to our deeper sensitivity. At the highest mean densities, the lifetimes of the starless and protostellar stages of dense cores appear to be fairly similar, consistent with previous observations, while the least dense cores in our sample may be longer-lived entities, if they are destined to form stars at all. Comparison of the distribution of dense cores we identified to the overall cloud column densities in NGC 2023/2024 and NGC 2068/2071 measured by Lombardi et al. (2014) shows that at high column densities, above cm-2, nearly all of the material is contained in the dense cores, while at lower cloud column densities, dense cores comprise a much smaller fraction of the material. Based on the amount of dense gas available, we predict that each of NGC 2023/2024 and NGC 2068/2071 will form at least as many stars as are currently present, while L1622 has little dense material available to supplement the present-day small protostellar population. We will present an in-depth analysis of the clustering properties of the dense cores in Kirk et al (2015, in prep).
Appendix A Dense Core Identification
Here, we describe our identification of dense cores, which was based on Starlink’s Fellwalker algorithm (Berry, 2015). The FellWalker algorithm is based on the idea of hiking through a set of hills: peaks are defined as local maxima, with their extents based on the routes that a hiker could ascend to reach the top of each peak. Users can set parameters in the algorithm such as the minimum peak size, minimum dip between neighbouring peaks, minimum ascent slope, etc. Prior to running FellWalker, we made a qualitative comparison between our 850 m maps and the publicly available Herschel 500 m map (Schneider et al., 2013). This comparison revealed that surprisingly faint structures in the 850 m map all have counterparts in the Herschel 500 m data. Given this correspondence, we adopted less stringent FellWalker parameters than the default recommended values. In particular, the parameters we modified from the default values are:
-
•
FellWalker.AllowEdge = 0 (eliminate objects touching a map edge)
-
•
FellWalker.Noise = 0.5*RMS (extend object search deeper into the noise)
-
•
FellWalker.MaxJump = 2.5 (reduce area for identifying shared peaks)
-
•
FellWalker.MinPix = 5 (allow smaller objects to be identified)
-
•
FellWalker.CleanIter = 5 (tidy up jagged source edges)
We then ran the FellWalker source list through a second program to eliminate spurious sources, which were numerous with the relaxed criteria above. Since the noise at the edges of the maps and mosaics is larger than in the centre, a large number of spurious sources were identified with FellWalker, which assumes a constant noise level across the map. We tested a variety of criteria to weed out spurious sources, and found the following set of criteria to be the most effective at removing noise sources while retaining real sources. We removed: 1) sources smaller than the effective beamsize, 2) sources which had fewer than three pixels above twice the local noise level, and 3) sources which, when slightly smoothed, had fewer than fifteen pixels above the local noise level. In addition, sources identified very near to the map edge (where the noise was highest) were eliminated if they had fewer than 22 pixels above the local noise level, when the image was slightly smoothed (i.e., 50% more pixels than the third criterion). All of the remaining sources passed our visual inspection. In general, the 3rd criterion eliminated the most sources. The first criterion almost never rejected any sources since FellWalker itself eliminates sources smaller than the beam. FellWalker identified 260, 1383, and 1020 sources in L1622, NGC 2023/2024, and NGC 2068/2071 respectively, which reduced to 29, 564, and 322 reliable cores after the cuts described above.
Appendix B Comparison to SCUBA
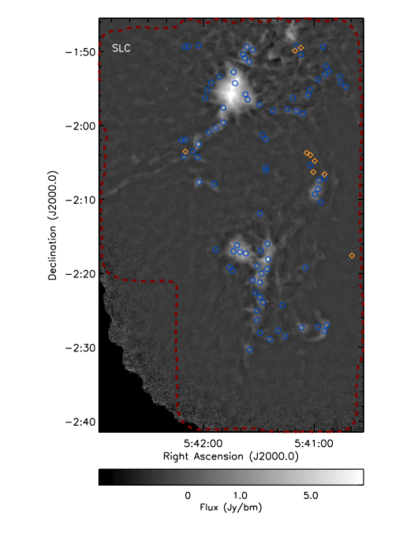
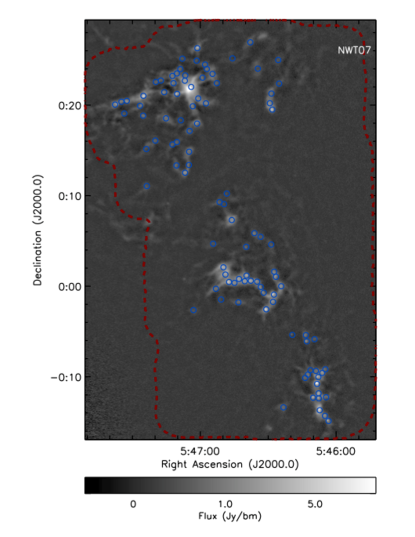
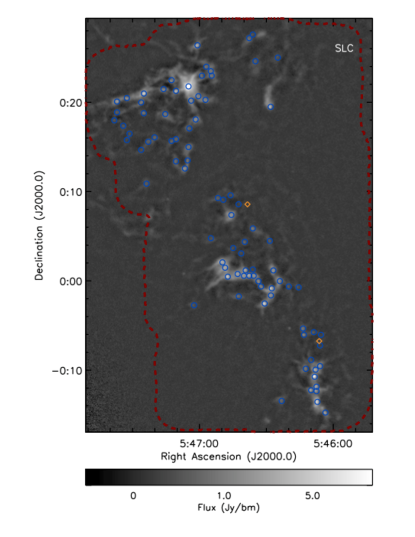
Parts of both the NGC 2023/2024 and NGC 2068/2071 regions were observed with the original SCUBA instrument, and analyses of these observations which include independently-derived core catalogues are given in Motte et al. (2001), Mitchell et al. (2001), Johnstone et al. (2001), Johnstone et al. (2006), Nutter & Ward-Thompson (2007), and Di Francesco et al. (2008). Both Nutter & Ward-Thompson (2007) (hereafter NWT07) and the SCUBA Legacy Catalog of Di Francesco et al. (2008) (hereafter SLC) include all observations taken during SCUBA’s operation of Orion B, and so we use these two works to compare the sensitivity of SCUBA and SCUBA-2 in Orion B555For completeness, we note that one single small ‘jiggle map’ (pointed observation) was taken in the L1622 region, but given the small quantity of data, we do not make comparisons in this region..
Figures 14 and 15 show the SCUBA-2 850 m images of the portions of NGC 2023/2024 and NGC 2068/2071 that were covered by SCUBA,
based on
the ‘coverage maps’ from the SLC666
http://www4.cadc-ccda.hia-iha.nrc-cnrc.gc.ca/
community/scubalegacy/. The left panels
of Figures 14 and 15 show the cores
listed in NWT07, while the
right panels show the SLC cores.
Since both NGC 2023/2024 and NGC 2068/2071 have clustered and complex emission, we expect
differences to arise in core boundaries and the level of fragmentation.
To compare the core catalogues quantitatively, we associate the peak position of each
SCUBA core with the FellWalker core whose boundary it lies within.
Indeed, Figures 14 and 15 show that
all of the cores in NWT07 have a match in our SCUBA-2 core catalogue,
while several of the SLC cores do not have a match.
Table 3 shows the number of cores matched for each
catalogue. Comparing the number of cores in the two SCUBA-based catalogues which
do and do not have a match in the SCUBA-2 catalogue suggests that the SLC probes deeper
than NWT07 in NGC 2023/2024 while the reverse is the case in NGC 2068/2071. In both cases, the
SLC is more susceptible to falsely identifying cores. The SCUBA-2 catalogue
includes several times more cores than seen with SCUBA over a comparable area: roughly 300
additional cores were found in the SCUBA-2 map of the part of NGC 2023/2024 observed with
SCUBA (compared to 60-90 cores identified with SCUBA), while roughly 150 additional cores
were found in NGC 2068/2071 (compared to 90-100 identified with SCUBA).
| Region | NWT07aaNumber of cores in Nutter & Ward-Thompson (2007) which were and were not matched to a SCUBA-2 FellWalker core. | SLCbbNumber of cores in the SCUBA Legacy Catalog (Di Francesco et al., 2008) which were and were not matched to a SCUBA-2 FellWalker core. | FW-NWT07ccNumber of SCUBA-2 FellWalker cores associated with one or more cores in Nutter & Ward-Thompson (2007). | FW-SLCddNumber of SCUBA-2 FellWalker cores associated with one or more cores in the SCUBA Legacy Catalog. | ||||
|---|---|---|---|---|---|---|---|---|
| match | no mat. | match | no mat. | match | no mat. | match | no mat. | |
| NGC 2023/2024 | 59 | 0 | 90 | 9 | 57 | 312 | 80 | 291 |
| NGC 2068/2071 | 100 | 0 | 87 | 2 | 90 | 147 | 80 | 157 |
 |
 |
 |
 |
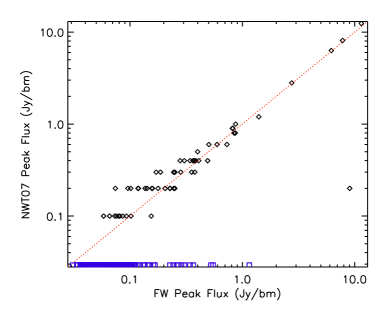
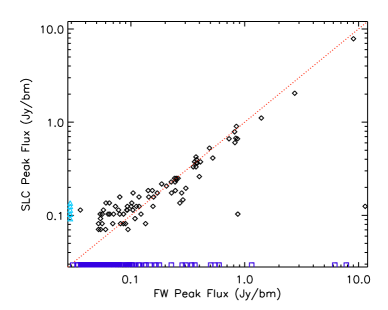
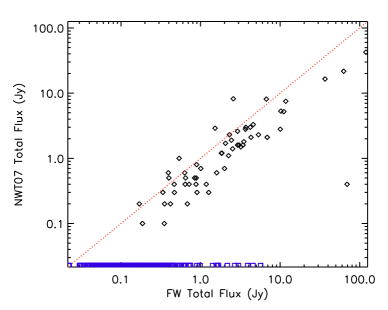
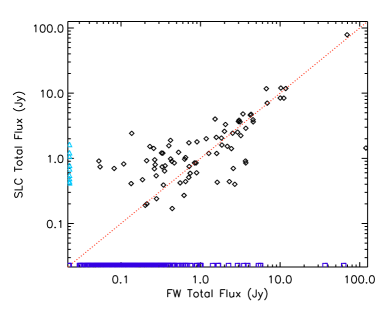
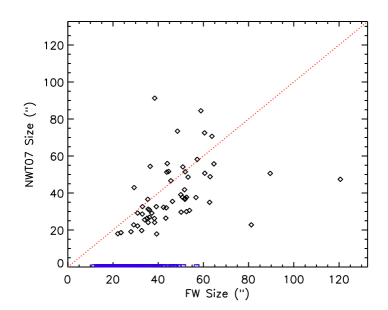
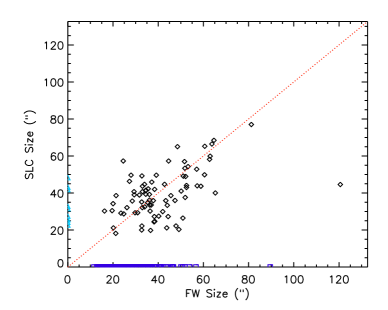
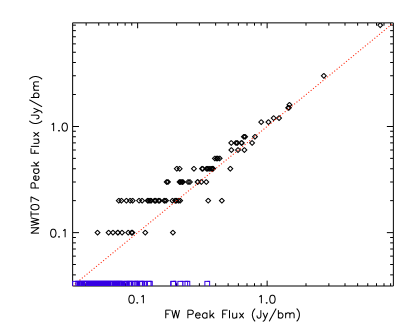
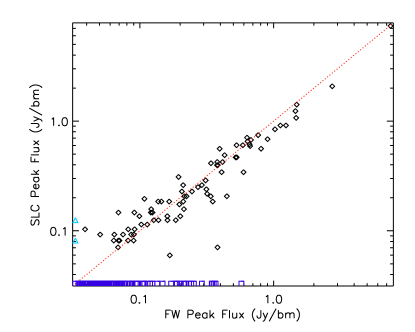
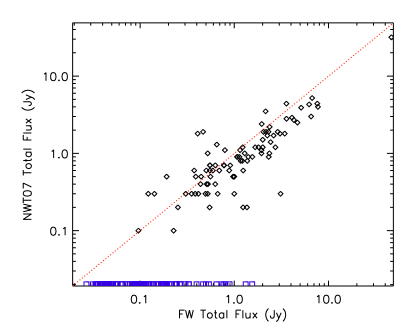
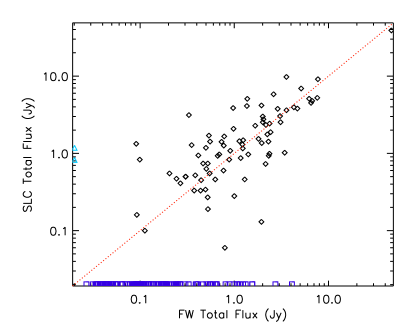
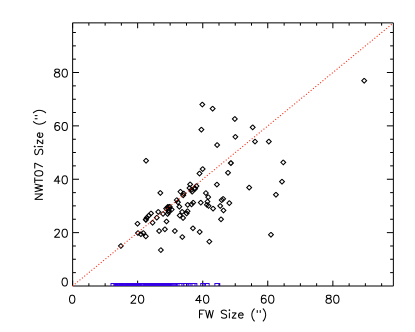
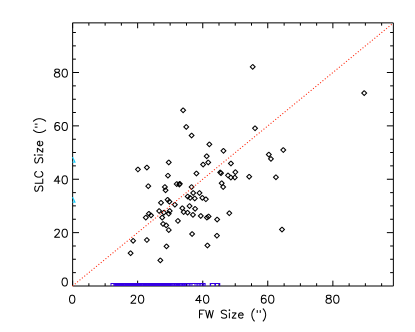
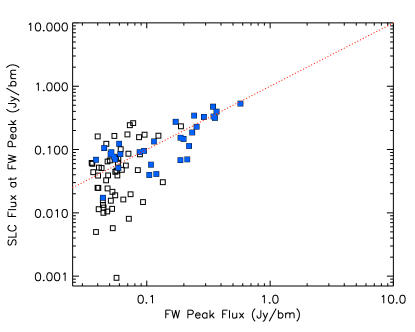
Figures 16 and 17 show comparisons of the peak fluxes, total fluxes, and sizes measured for cores in NGC 2023/2024 and NGC 2068/2071 respectively. The SCUBA Legacy maps were created with a resolution of 19.8″(Di Francesco et al., 2008), degraded from the nominal best value to better handle noise features in their processing of multiple datasets of differing quality. We roughly correct for differences expected in the SLC values caused by this lower resolution: we decrease the SLC peak flux by the ratio of beam sizes, and deconvolve the SLC radius with the 19.8″ beam, and reconvolve it with the SCUBA-2 14.6″ beam (given typical core sizes, the radius correction tends to be very small). The NWT07 catalogue had a similar effective radius to our SCUBA-2 map, so corrections are not needed for that comparison. Most of the core catalogue values agree reasonably well between the two SCUBA measurements and the SCUBA-2 measurement, although there is significant scatter around a perfect one-to-one relationship. We expect the peak flux to show the best agreement, and indeed that is generally true. Note that the scatter in the comparison with the NWT07 peak fluxes is likely due to the lower precision of their published catalogue values, which were only given in tenths of a Jy bm-1. Since generally cores become more numerous at lower flux levels (when above the detection limit), we expect that most of the cores shown at each of the several tenths of a Jy bm-1 level in peak flux would in fact have slightly lower true values, lowering the apparent scatter. The total flux and size plots tend to show a larger scatter between the SCUBA and SCUBA-2 values, as these measures are more sensitive to precisely how the dense core boundaries are defined, which tends to vary more between core identification methods in regions of complex emission. We do not see any indication of systematic calibration issues between the SCUBA and SCUBA-2 maps: the median ratio of peak or total flux in SCUBA and SCUBA-2 cores is not consistently higher or lower than one across both regions in the NWT07 or SLC catalogues.
Barring the problem with the lower precision in the peak flux values given in NWT07, we find generally good agreement between the measured core properties from SCUBA-2 and those in NWT07 and the SLC. The SCUBA Legacy processed images have some negative features (“bowls”) around bright cores. Also, the NGC 2023/2024 and NGC 2068/2071 regions happened to be split between two ‘tiles’ in the SLC dataset, which appears to have caused a particularly poor automated reduction of these regions. The resulting large scale bowls and pedestals make the resulting core catalogue less accurate. This difference likely acounts both for the large scatter away from the one-to-one relationship in the total flux comparison, as well the presence of SLC cores which have no match in our SCUBA-2 catalogue. Visual inspection of the SLC cores which are unmatched show they are either caused by noise spikes at map edges, or are small-scale noise features coincident with a large-scale pedestal that raised them above the global flux cutoff used.
 |
 |
 |
 |
 |
 |
 |
 |
 |
 |
 |
 |
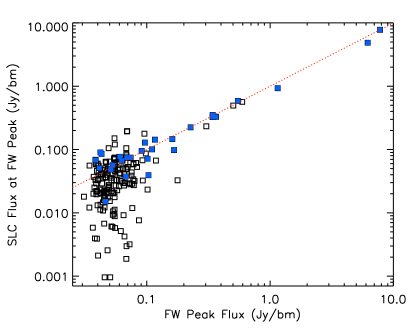
For our comparison with the SLC, since the 850 m maps and source boundaries are publicly available, we can explicitly also test the cause of the un-matched FellWalker sources. In Figure 18, we show the SCUBA Legacy flux at the position of each unmatched FellWalker core peak position. As can be seen in the figure, there is generally a good correspondence between the FellWalker core peak flux and the SCUBA Legacy flux at the same location. We additionally find that the majority of the brighter unmatched FellWalker cores have peak positions which lie within an SLC source boundary. In these cases, it is clear that the reason that the FellWalker core was unmatched is differences in source boundaries in regions of complex emission: the SLC source which the FellWalker core peak lies within was matched to a different FellWalker core. We also examined the brightest unmatched FellWalker cores whose peak positions did not lie within any SLC source boundaries, and in all cases we found that there were sources visible in the SCUBA Legacy map that were excluded from the final SCUBA Legacy catalogue. There were two causes for this exclusion. First, there were several bright emission peaks lying very close to a SCUBA Legacy map edge (these correspond to the brightest few open squares in each panel of Figure 18). Since many SCUBA Legacy maps suffer from significant edge artefacts, the SLC used strong criteria to eliminate potentially spurious objects identified near a map edge, and evidently on occasion those criteria also removed several real sources from their catalogue. Second, some peaks of emission were located within strong negative bowls in the SCUBA Legacy map: while the peaks themselves were bright enough to be easily discernable, their extents were truncated by the surrounding negative bowl to such an extent that these sources were likely eliminated by minimum size criteria imposed on the SLC. The apparent presence of bright unmatched FellWalker cores in Figure 16 and 17 are therefore not indicative of major inconsistencies between the SCUBA Legacy map and the SCUBA-2 map.
 |
 |
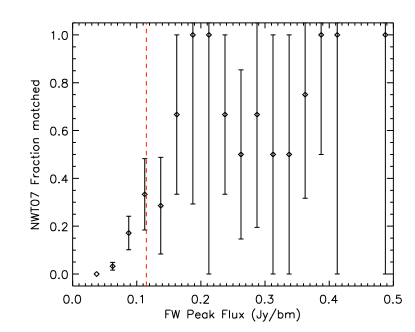
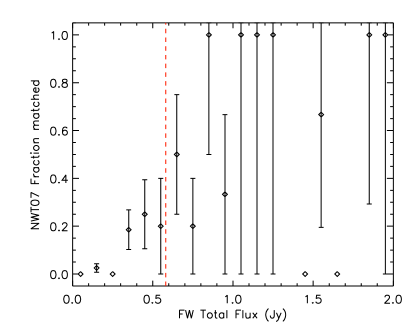
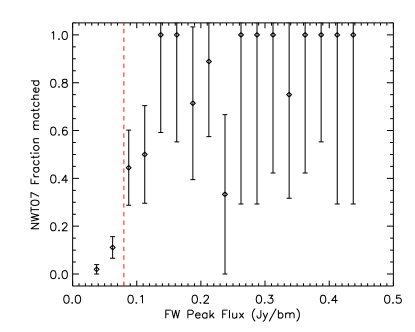
Finally, we show the effective completeness levels in the SCUBA catalogues by determining the fraction of SCUBA-2 cores found. Figure 19 shows the fraction of cores NWT07 identify in our SCUBA-2 catalogue as a function of peak flux (left panel) and total flux (right panel). The bin sizes adopted were chosen to ensure most bins were reasonably populated, while still showing sufficient detail at low fluxes. The vertical lines in both panels show the statistical / counting uncertainty based on the number of NWT07 cores in each bin, illustrating that most bins are not strongly populated. Still, it is clear that at higher peak and total flux values, the fraction of matches is generally good. We visually inspected the instances of fewer correspondences at higher peak and total fluxes and found that these were attributable to differences in how the FellWalker and ClumpFind algorithms divided complex emission structures into individual cores.
In the lower peak and total flux regimes, we find that the NWT07 catalogue is complete to roughly 40% to 60% of the cores in our catalogue at their nominal completeness level. For the peak flux, the completeness level shown (vertical dashed line) is five times the SCUBA noise level as listed in NWT07, which they state was used as the minimum ClumpFind threshold. The total flux completeness level is more difficult to determine, since it varies with core size. We roughly estimated the completeness level by taking a flux of three times the noise level across the average area of their cores777Normally, ClumpFind includes pixels within cores that have fluxes down to 2 below the specified minimum peak flux value.. Although there is a significant amount of uncertainty introduced by the complex emission structure, these comparisons suggest that the NWT07 catalogue would be roughly 90% complete at a completeness limit of approximately 50% higher than quoted in their paper.
 |
 |
 |
 |
These comparisons show that the SCUBA-2 data of Orion B analyzed here provide significantly more sensitive coverage than the SCUBA data (as well as also covering a larger area, as is evident comparing, e.g., Figures 3 and 14). With a typical noise level of 3.7 mJy bm-1, our nominal 3 completeness is roughly 11 mJy bm-1 in peak flux, although we expect the actual value to be slightly larger, since faint cores lying outside of our external mask will have somewhat diminshed flux levels.
References
- André et al. (2014) André, P., Di Francesco, J., Ward-Thompson, D., et al. 2014, Protostars and Planets VI, 27
- André et al. (2010) André, P., Men’shchikov, A., Bontemps, S., et al. 2010, A&A, 518, L102
- Anthony-Twarog (1982) Anthony-Twarog, B. J. 1982, AJ, 87, 1213
- Bally (2008) Bally, J. 2008, Overview of the Orion Complex, ed. B. Reipurth, 459
- Bally et al. (1987) Bally, J., Langer, W. D., Stark, A. A., & Wilson, R. W. 1987, ApJ, 312, L45
- Berry (2015) Berry, D. S. 2015, Astronomy and Computing, 10, 22
- Berry et al. (2007) Berry, D. S., Reinhold, K., Jenness, T., & Economou, F. 2007, in Astronomical Society of the Pacific Conference Series, Vol. 376, Astronomical Data Analysis Software and Systems XVI, ed. R. A. Shaw, F. Hill, & D. J. Bell, 425
- Bonnor (1956) Bonnor, W. B. 1956, MNRAS, 116, 351
- Buckle et al. (2009) Buckle, J. V., Hills, R. E., Smith, H., et al. 2009, MNRAS, 399, 1026
- Buckle et al. (2010) Buckle, J. V., Curtis, E. I., Roberts, J. F., et al. 2010, MNRAS, 401, 204
- Buckle et al. (2015) Buckle, J. V., Drabek-Maunder, E., Greaves, J., et al. 2015, MNRAS, 449, 2472
- Chapin et al. (2013a) Chapin, E., Gibb, A. G., Jenness, T., et al. 2013a, Starlink User Note, 258
- Chapin et al. (2013b) Chapin, E. L., Berry, D. S., Gibb, A. G., et al. 2013b, MNRAS, 430, 2545
- Currie et al. (2014) Currie, M. J., Berry, D. S., Jenness, T., et al. 2014, in Astronomical Society of the Pacific Conference Series, Vol. 485, Astronomical Data Analysis Software and Systems XXIII, ed. N. Manset & P. Forshay, 391
- Dempsey et al. (2013) Dempsey, J. T., Friberg, P., Jenness, T., et al. 2013, MNRAS, 430, 2534
- Di Francesco et al. (2008) Di Francesco, J., Johnstone, D., Kirk, H., MacKenzie, T., & Ledwosinska, E. 2008, ApJS, 175, 277
- Drabek et al. (2012) Drabek, E., Hatchell, J., Friberg, P., et al. 2012, MNRAS, 426, 23
- Ebert (1955) Ebert, R. 1955, ZAp, 37, 217
- Enoch et al. (2008) Enoch, M. L., Evans, II, N. J., Sargent, A. I., et al. 2008, ApJ, 684, 1240
- Enoch et al. (2007) Enoch, M. L., Glenn, J., Evans, II, N. J., et al. 2007, ApJ, 666, 982
- Enoch et al. (2006) Enoch, M. L., Young, K. E., Glenn, J., et al. 2006, ApJ, 638, 293
- Hartmann (1998) Hartmann, L. 1998, Accretion Processes in Star Formation
- Hatchell et al. (2007) Hatchell, J., Fuller, G. A., Richer, J. S., Harries, T. J., & Ladd, E. F. 2007, A&A, 468, 1009
- Hatchell et al. (2005) Hatchell, J., Richer, J. S., Fuller, G. A., et al. 2005, A&A, 440, 151
- Hatchell et al. (2013) Hatchell, J., Wilson, T., Drabek, E., et al. 2013, MNRAS, 429, L10
- Hildebrand (1983) Hildebrand, R. H. 1983, QJRAS, 24, 267
- Holland et al. (2013) Holland, W. S., Bintley, D., Chapin, E. L., et al. 2013, MNRAS, 430, 2513
- Jenness et al. (2015) Jenness, T., Currie, M. J., Tilanus, R. P. J., et al. 2015, MNRAS, 453, 73
- Jessop & Ward-Thompson (2000) Jessop, N. E., & Ward-Thompson, D. 2000, MNRAS, 311, 63
- Johnstone et al. (2003) Johnstone, D., Boonman, A. M. S., & van Dishoeck, E. F. 2003, A&A, 412, 157
- Johnstone et al. (2004) Johnstone, D., Di Francesco, J., & Kirk, H. 2004, ApJ, 611, L45
- Johnstone et al. (2001) Johnstone, D., Fich, M., Mitchell, G. F., & Moriarty-Schieven, G. 2001, ApJ, 559, 307
- Johnstone et al. (2006) Johnstone, D., Matthews, H., & Mitchell, G. F. 2006, ApJ, 639, 259
- Jørgensen et al. (2007) Jørgensen, J. K., Johnstone, D., Kirk, H., & Myers, P. C. 2007, ApJ, 656, 293
- Jørgensen et al. (2008) Jørgensen, J. K., Johnstone, D., Kirk, H., et al. 2008, ApJ, 683, 822
- Kackley et al. (2010) Kackley, R., Scott, D., Chapin, E., & Friberg, P. 2010, in Society of Photo-Optical Instrumentation Engineers (SPIE) Conference Series, Vol. 7740, Society of Photo-Optical Instrumentation Engineers (SPIE) Conference Series, 1
- Kirk et al. (2006) Kirk, H., Johnstone, D., & Di Francesco, J. 2006, ApJ, 646, 1009
- Kirk et al. (2007) Kirk, H., Johnstone, D., & Tafalla, M. 2007, ApJ, 668, 1042
- Kirk et al. (2005) Kirk, J. M., Ward-Thompson, D., & André, P. 2005, MNRAS, 360, 1506
- Könyves et al. (2013) Könyves, V., André, P., Schneider, N., et al. 2013, Astronomische Nachrichten, 334, 908
- Lada et al. (2008) Lada, C. J., Muench, A. A., Rathborne, J., Alves, J. F., & Lombardi, M. 2008, ApJ, 672, 410
- Lada et al. (1991) Lada, E. A., Bally, J., & Stark, A. A. 1991, ApJ, 368, 432
- Landsman (1993) Landsman, W. B. 1993, in Astronomical Society of the Pacific Conference Series, Vol. 52, Astronomical Data Analysis Software and Systems II, ed. R. J. Hanisch, R. J. V. Brissenden, & J. Barnes, 246
- Lombardi et al. (2011) Lombardi, M., Alves, J., & Lada, C. J. 2011, A&A, 535, A16
- Lombardi et al. (2014) Lombardi, M., Bouy, H., Alves, J., & Lada, C. J. 2014, A&A, 566, A45
- Maddalena et al. (1986) Maddalena, R. J., Morris, M., Moscowitz, J., & Thaddeus, P. 1986, ApJ, 303, 375
- Mairs et al. (2014) Mairs, S., Johnstone, D., Offner, S. S. R., & Schnee, S. 2014, ApJ, 783, 60
- Mairs et al. (2015) Mairs, S., Johnstone, D., Kirk, H., et al. 2015, MNRAS, 454, 2557
- Matthews et al. (2002) Matthews, B. C., Fiege, J. D., & Moriarty-Schieven, G. 2002, ApJ, 569, 304
- Matthews & Wilson (2002) Matthews, B. C., & Wilson, C. D. 2002, ApJ, 571, 356
- McKee (1989) McKee, C. F. 1989, ApJ, 345, 782
- Megeath et al. (2012) Megeath, S. T., Gutermuth, R., Muzerolle, J., et al. 2012, AJ, 144, 192
- Menten et al. (2007) Menten, K. M., Reid, M. J., Forbrich, J., & Brunthaler, A. 2007, A&A, 474, 515
- Meyer et al. (2008) Meyer, M. R., Flaherty, K., Levine, J. L., et al. 2008, Star Formation in NGC 2023, NGC 2024, and Southern L1630, ed. B. Reipurth, 662
- Mitchell et al. (2001) Mitchell, G. F., Johnstone, D., Moriarty-Schieven, G., Fich, M., & Tothill, N. F. H. 2001, ApJ, 556, 215
- Motte et al. (2001) Motte, F., André, P., Ward-Thompson, D., & Bontemps, S. 2001, A&A, 372, L41
- Muench et al. (2008) Muench, A., Getman, K., Hillenbrand, L., & Preibisch, T. 2008, Star Formation in the Orion Nebula I: Stellar Content, ed. B. Reipurth, 483
- Nutter & Ward-Thompson (2007) Nutter, D., & Ward-Thompson, D. 2007, MNRAS, 374, 1413
- Onishi et al. (1998) Onishi, T., Mizuno, A., Kawamura, A., Ogawa, H., & Fukui, Y. 1998, ApJ, 502, 296
- Pattle et al. (2015) Pattle, K., Ward-Thompson, D., Kirk, J. M., et al. 2015, MNRAS, 450, 1094
- Reipurth et al. (2008) Reipurth, B., Megeath, S. T., Bally, J., & Walawender, J. 2008, The L1617 and L1622 Cometary Clouds in Orion, ed. B. Reipurth, 782
- Rosolowsky et al. (2008) Rosolowsky, E. W., Pineda, J. E., Kauffmann, J., & Goodman, A. A. 2008, ApJ, 679, 1338
- Sadavoy et al. (2010) Sadavoy, S. I., Di Francesco, J., Bontemps, S., et al. 2010, ApJ, 710, 1247
- Sadavoy et al. (2013) Sadavoy, S. I., Di Francesco, J., Johnstone, D., et al. 2013, ApJ, 767, 126
- Salji et al. (2015) Salji, C. J., Richer, J. S., Buckle, J. V., et al. 2015, MNRAS, 449, 1769
- Salpeter (1955) Salpeter, E. E. 1955, ApJ, 121, 161
- Schneider et al. (2013) Schneider, N., André, P., Könyves, V., et al. 2013, ApJ, 766, L17
- Stutz et al. (2013) Stutz, A. M., Tobin, J. J., Stanke, T., et al. 2013, ApJ, 767, 36
- van Kempen et al. (2009) van Kempen, T. A., van Dishoeck, E. F., Salter, D. M., et al. 2009, A&A, 498, 167
- Ward-Thompson et al. (2007) Ward-Thompson, D., Di Francesco, J., Hatchell, J., et al. 2007, PASP, 119, 855
- Watson (2010) Watson, M. 2010, Master’s thesis, University of Hertfordshire
- Williams et al. (1994) Williams, J. P., de Geus, E. J., & Blitz, L. 1994, ApJ, 428, 693
| Source | 850 m | 450 m | CO Contam. | Bkgrd | ||||||||||
|---|---|---|---|---|---|---|---|---|---|---|---|---|---|---|
| Name | Region | Index | R.A.aaPosition of peak emission in the dense core | Dec.aaPosition of peak emission in the dense core | Peak bbPeak flux, total flux, and effective radius of the dense cores, as measured at 850 µm. The effective beamsize at 850 m is 14.6″. | Total bbPeak flux, total flux, and effective radius of the dense cores, as measured at 850 µm. The effective beamsize at 850 m is 14.6″. | bbPeak flux, total flux, and effective radius of the dense cores, as measured at 850 µm. The effective beamsize at 850 m is 14.6″. | Peak ccPeak flux and total flux at 450 m within the dense core boundaries defined on the 850 m image (note that the total flux may be negative in regions without a detected 450 m signal). The effective beamsize at 450 m is 9.8″. | Total ccPeak flux and total flux at 450 m within the dense core boundaries defined on the 850 m image (note that the total flux may be negative in regions without a detected 450 m signal). The effective beamsize at 450 m is 9.8″. | YSOddIs the dense core associated with a protostar in Spitzer (Megeath et al., 2012) or Herschel (Stutz et al., 2013)? | Cov.eeCO contamination: fraction of dense core footprint where CO observations exist, peak and total flux at 850 m in CO subtracted mosaic (-1 indicates null values). | PeakeeCO contamination: fraction of dense core footprint where CO observations exist, peak and total flux at 850 m in CO subtracted mosaic (-1 indicates null values). | TotaleeCO contamination: fraction of dense core footprint where CO observations exist, peak and total flux at 850 m in CO subtracted mosaic (-1 indicates null values). | TotalffBackground subtracted total flux at 850 µm. |
| MJLSG | (J2000.0) | (J2000.0) | (Jy bm-1) | (Jy) | (pc) | (Jy bm-1) | (Jy) | (Jy bm-1) | (Jy) | (Jy) | ||||
| J055424.5+014419 | L1622 | 1 | 5:54:24.60 | +01:44:19.7 | 1.200 | 4.889 | 0.121 | 4.656 | 27.708 | Y | 0.00 | -1 | -1 | 4.245 |
| J055412.3+014234 | L1622 | 2 | 5:54:12.39 | +01:42:34.7 | 0.202 | 2.013 | 0.108 | 0.985 | 10.506 | Y | 0.00 | -1 | -1 | 1.528 |
| J055440.2+015404 | L1622 | 3 | 5:54:40.21 | +01:54:04.7 | 0.138 | 1.714 | 0.135 | 0.772 | 6.288 | N | 0.00 | -1 | -1 | 0.952 |
| J055403.3+014025 | L1622 | 4 | 5:54:03.39 | +01:40:25.7 | 0.115 | 0.174 | 0.043 | 0.647 | 0.775 | N | 0.00 | -1 | -1 | 0.084 |
| J055406.1+014255 | L1622 | 5 | 5:54:06.19 | +01:42:55.7 | 0.110 | 0.665 | 0.073 | 0.730 | 3.043 | N | 0.00 | -1 | -1 | 0.387 |
| J055429.7+014737 | L1622 | 6 | 5:54:29.80 | +01:47:37.7 | 0.101 | 0.782 | 0.081 | 0.746 | 3.132 | Y | 0.00 | -1 | -1 | 0.432 |
| J055453.4+015837 | L1622 | 7 | 5:54:53.41 | +01:58:37.7 | 0.088 | 0.273 | 0.057 | 0.608 | 0.978 | N | 0.00 | -1 | -1 | 0.121 |
| J055440.0+014340 | L1622 | 8 | 5:54:40.00 | +01:43:40.7 | 0.088 | 0.241 | 0.060 | 0.604 | 0.369 | N | 0.00 | -1 | -1 | 0.090 |
| J055421.7+014210 | L1622 | 9 | 5:54:21.79 | +01:42:10.7 | 0.080 | 0.370 | 0.063 | 0.875 | 1.608 | N | 0.00 | -1 | -1 | 0.176 |
| J055419.9+015040 | L1622 | 10 | 5:54:19.99 | +01:50:40.7 | 0.080 | 0.234 | 0.054 | 0.712 | 1.233 | Y | 0.00 | -1 | -1 | 0.091 |
| J055428.1+014716 | L1622 | 11 | 5:54:28.20 | +01:47:16.7 | 0.074 | 0.143 | 0.042 | 0.514 | 0.524 | N | 0.00 | -1 | -1 | 0.031 |
| J055426.3+014152 | L1622 | 12 | 5:54:26.40 | +01:41:52.7 | 0.063 | 0.155 | 0.051 | 0.610 | 0.497 | N | 0.00 | -1 | -1 | 0.036 |
| J055418.1+014913 | L1622 | 13 | 5:54:18.19 | +01:49:13.7 | 0.062 | 0.248 | 0.061 | 0.726 | 1.283 | Y | 0.00 | -1 | -1 | 0.100 |
| J055426.9+015213 | L1622 | 14 | 5:54:27.00 | +01:52:13.7 | 0.057 | 0.093 | 0.042 | 0.610 | 0.396 | N | 0.00 | -1 | -1 | 0.031 |
| J055459.6+020401 | L1622 | 15 | 5:54:59.62 | +02:04:01.7 | 0.057 | 0.082 | 0.044 | 0.744 | -0.016 | N | 0.00 | -1 | -1 | -0.004 |
| J055445.6+014940 | L1622 | 16 | 5:54:45.61 | +01:49:40.7 | 0.056 | 0.103 | 0.047 | 0.740 | 0.456 | N | 0.00 | -1 | -1 | 0.025 |
| J055355.5+014110 | L1622 | 17 | 5:53:55.58 | +01:41:10.7 | 0.053 | 0.185 | 0.064 | 0.683 | 1.411 | N | 0.00 | -1 | -1 | 0.001 |
| J055431.1+014858 | L1622 | 18 | 5:54:31.20 | +01:48:58.7 | 0.049 | 0.084 | 0.042 | 0.554 | 0.325 | N | 0.00 | -1 | -1 | 0.003 |
| J055415.5+014046 | L1622 | 19 | 5:54:15.59 | +01:40:46.7 | 0.049 | 0.100 | 0.048 | 0.625 | 0.428 | N | 0.00 | -1 | -1 | 0.021 |
| J055507.8+014513 | L1622 | 20 | 5:55:07.82 | +01:45:13.7 | 0.045 | 0.027 | 0.026 | 0.491 | 0.046 | N | 0.00 | -1 | -1 | 0.003 |
| J055429.7+015340 | L1622 | 21 | 5:54:29.80 | +01:53:40.7 | 0.045 | 0.114 | 0.055 | 0.625 | 0.395 | N | 0.00 | -1 | -1 | 0.005 |
| J055441.6+014046 | L1622 | 22 | 5:54:41.60 | +01:40:46.7 | 0.045 | 0.103 | 0.048 | 0.573 | 0.440 | N | 0.00 | -1 | -1 | 0.007 |
| J055509.6+015637 | L1622 | 23 | 5:55:09.62 | +01:56:37.7 | 0.044 | 0.027 | 0.025 | 0.458 | -0.045 | N | 0.00 | -1 | -1 | 0.003 |
| J055505.2+020040 | L1622 | 24 | 5:55:05.22 | +02:00:40.7 | 0.044 | 0.104 | 0.048 | 0.677 | 0.496 | N | 0.00 | -1 | -1 | 0.032 |
| J055443.6+015040 | L1622 | 25 | 5:54:43.60 | +01:50:40.7 | 0.042 | 0.042 | 0.031 | 0.567 | 0.109 | N | 0.00 | -1 | -1 | 0.004 |
| J055408.5+015046 | L1622 | 26 | 5:54:08.59 | +01:50:46.7 | 0.042 | 0.033 | 0.028 | 0.545 | 0.122 | N | 0.00 | -1 | -1 | 0.003 |
| J055452.0+015734 | L1622 | 27 | 5:54:52.01 | +01:57:34.7 | 0.041 | 0.077 | 0.046 | 0.630 | 0.171 | N | 0.00 | -1 | -1 | -0.010 |
| J055435.0+015210 | L1622 | 28 | 5:54:35.00 | +01:52:10.7 | 0.041 | 0.085 | 0.046 | 0.654 | 0.461 | N | 0.00 | -1 | -1 | 0.004 |
| J055451.8+014513 | L1622 | 29 | 5:54:51.81 | +01:45:13.7 | 0.038 | 0.055 | 0.037 | 0.515 | 0.237 | N | 0.00 | -1 | -1 | 0.002 |
| J054705.0+002145 | N2068/2071 | 1 | 5:47:05.00 | +00:21:45.1 | 7.459 | 46.389 | 0.180 | 28.247 | 320.114 | Y | 1.00 | 7.277 | 42.283 | 43.382 |
| J054608.6-001044 | N2068/2071 | 2 | 5:46:08.61 | -00:10:44.6 | 2.736 | 5.122 | 0.084 | 7.017 | 25.257 | Y | 0.00 | -1 | -1 | 4.465 |
| J054607.4-001335 | N2068/2071 | 3 | 5:46:07.41 | -00:13:35.5 | 1.484 | 7.711 | 0.113 | 7.586 | 53.072 | Y | 0.00 | -1 | -1 | 6.846 |
| J054724.9+002100 | N2068/2071 | 4 | 5:47:25.00 | +00:21:00.1 | 1.469 | 7.594 | 0.130 | 6.047 | 50.139 | Y | 1.00 | 1.474 | 7.676 | 6.116 |
| J054631.2-000235 | N2068/2071 | 5 | 5:46:31.21 | -00:02:35.7 | 1.452 | 4.287 | 0.109 | 5.995 | 22.861 | N | 0.00 | -1 | -1 | 3.707 |
| J054628.0-000053 | N2068/2071 | 6 | 5:46:28.01 | -00:00:53.7 | 1.234 | 4.674 | 0.093 | 3.937 | 26.024 | Y | 0.00 | -1 | -1 | 4.023 |
| J054647.6+000027 | N2068/2071 | 7 | 5:46:47.60 | +00:00:27.2 | 1.121 | 6.530 | 0.126 | 4.019 | 48.016 | Y | 0.00 | -1 | -1 | 5.510 |
| J054628.4+001927 | N2068/2071 | 8 | 5:46:28.40 | +00:19:27.1 | 1.021 | 2.611 | 0.074 | 3.203 | 12.709 | Y | 1.00 | 1.023 | 2.630 | 2.307 |
| J054710.7+002112 | N2068/2071 | 9 | 5:47:10.80 | +00:21:12.1 | 0.899 | 2.301 | 0.079 | 3.767 | 17.659 | Y | 1.00 | 0.883 | 2.207 | 1.870 |
| J054701.1+002621 | N2068/2071 | 10 | 5:47:01.20 | +00:26:21.1 | 0.804 | 3.428 | 0.130 | 2.657 | 16.280 | Y | 0.84 | 0.764 | 2.995 | 2.857 |
| J054608.4-000959 | N2068/2071 | 11 | 5:46:08.41 | -00:09:59.6 | 0.764 | 2.885 | 0.073 | 3.087 | 20.289 | Y | 0.00 | -1 | -1 | 1.574 |
| J054650.0+000203 | N2068/2071 | 12 | 5:46:50.00 | +00:02:03.2 | 0.675 | 6.225 | 0.121 | 2.715 | 48.999 | N | 0.00 | -1 | -1 | 5.416 |
| J054610.2-001217 | N2068/2071 | 13 | 5:46:10.21 | -00:12:17.6 | 0.666 | 1.373 | 0.068 | 2.129 | 7.426 | Y | 0.00 | -1 | -1 | 1.029 |
| J054639.6+000112 | N2068/2071 | 14 | 5:46:39.60 | +00:01:12.2 | 0.659 | 2.165 | 0.071 | 2.885 | 14.478 | Y | 0.00 | -1 | -1 | 1.804 |
| J054638.0+000036 | N2068/2071 | 15 | 5:46:38.00 | +00:00:36.2 | 0.637 | 2.429 | 0.056 | 2.325 | 16.487 | Y | 0.00 | -1 | -1 | 1.391 |
| J054607.8-001153 | N2068/2071 | 16 | 5:46:07.81 | -00:11:53.6 | 0.631 | 1.943 | 0.060 | 2.308 | 13.678 | N | 0.00 | -1 | -1 | 0.924 |
| J054603.8-001450 | N2068/2071 | 17 | 5:46:03.81 | -00:14:50.5 | 0.594 | 1.407 | 0.074 | 2.650 | 7.729 | Y | 0.00 | -1 | -1 | 1.177 |
| J054648.2+000133 | N2068/2071 | 18 | 5:46:48.21 | +00:01:33.2 | 0.587 | 6.701 | 0.101 | 2.457 | 52.950 | Y | 0.00 | -1 | -1 | 2.746 |
| J054706.5+002239 | N2068/2071 | 19 | 5:47:06.60 | +00:22:39.1 | 0.573 | 4.093 | 0.072 | 1.443 | 20.561 | Y | 1.00 | 0.416 | 3.060 | 1.848 |
| J054807.8+003351 | N2068/2071 | 20 | 5:48:07.80 | +00:33:51.1 | 0.572 | 1.198 | 0.089 | 1.790 | 5.914 | Y | 0.00 | -1 | -1 | 0.950 |
| J054737.1+002006 | N2068/2071 | 21 | 5:47:37.20 | +00:20:06.1 | 0.528 | 2.037 | 0.077 | 2.695 | 16.638 | Y | 1.00 | 0.524 | 2.007 | 1.645 |
| J054643.0+000048 | N2068/2071 | 22 | 5:46:43.00 | +00:00:48.2 | 0.527 | 3.580 | 0.074 | 2.099 | 27.452 | Y | 0.00 | -1 | -1 | 1.027 |
| J054608.0-001220 | N2068/2071 | 23 | 5:46:08.01 | -00:12:20.6 | 0.518 | 0.971 | 0.040 | 1.719 | 5.744 | Y | 0.00 | -1 | -1 | 0.312 |
| J054606.2-000935 | N2068/2071 | 24 | 5:46:06.21 | -00:09:35.6 | 0.446 | 3.096 | 0.123 | 1.452 | 18.379 | Y | 0.00 | -1 | -1 | 2.365 |
| J054640.6+000033 | N2068/2071 | 25 | 5:46:40.61 | +00:00:33.2 | 0.429 | 2.240 | 0.058 | 1.754 | 16.919 | N | 0.00 | -1 | -1 | -0.051 |
| J054627.0+000109 | N2068/2071 | 26 | 5:46:27.01 | +00:01:09.2 | 0.415 | 1.668 | 0.064 | 1.391 | 10.701 | N | 0.00 | -1 | -1 | 1.289 |
| J054732.7+002024 | N2068/2071 | 27 | 5:47:32.80 | +00:20:24.1 | 0.407 | 1.132 | 0.059 | 1.707 | 9.052 | Y | 1.00 | 0.407 | 1.121 | 0.795 |
| J054645.8+000721 | N2068/2071 | 28 | 5:46:45.80 | +00:07:21.2 | 0.394 | 3.573 | 0.111 | 1.628 | 27.688 | N | 0.00 | -1 | -1 | 2.980 |
| J054624.4-000002 | N2068/2071 | 29 | 5:46:24.41 | -00:00:02.7 | 0.381 | 3.059 | 0.096 | 1.286 | 20.452 | N | 0.00 | -1 | -1 | 2.500 |
| J054635.4+000030 | N2068/2071 | 30 | 5:46:35.41 | +00:00:30.2 | 0.380 | 1.939 | 0.083 | 1.458 | 13.511 | N | 0.00 | -1 | -1 | 1.514 |
| J054628.2-000135 | N2068/2071 | 31 | 5:46:28.21 | -00:01:35.7 | 0.378 | 2.004 | 0.066 | 1.275 | 10.651 | N | 0.00 | -1 | -1 | 1.423 |
| J054706.8+001230 | N2068/2071 | 32 | 5:47:06.80 | +00:12:30.2 | 0.377 | 1.807 | 0.082 | 1.302 | 12.402 | N | 1.00 | 0.378 | 1.809 | 1.493 |
| J054743.6+003821 | N2068/2071 | 33 | 5:47:43.60 | +00:38:21.1 | 0.370 | 1.080 | 0.070 | 1.224 | 5.612 | Y | 0.00 | -1 | -1 | 0.818 |
| J054629.6+002012 | N2068/2071 | 34 | 5:46:29.60 | +00:20:12.1 | 0.367 | 2.730 | 0.087 | 1.230 | 13.842 | N | 1.00 | 0.369 | 2.764 | 2.221 |
| J054605.0-001417 | N2068/2071 | 35 | 5:46:05.01 | -00:14:17.5 | 0.356 | 1.079 | 0.052 | 1.567 | 6.254 | Y | 0.00 | -1 | -1 | 0.530 |
| J054745.2+003842 | N2068/2071 | 36 | 5:47:45.20 | +00:38:42.1 | 0.354 | 1.054 | 0.074 | 1.111 | 5.761 | N | 0.00 | -1 | -1 | 0.801 |
| J054613.2-000605 | N2068/2071 | 37 | 5:46:13.21 | -00:06:05.7 | 0.350 | 0.666 | 0.063 | 1.581 | 5.214 | Y | 0.00 | -1 | -1 | 0.443 |
| J054645.2+000018 | N2068/2071 | 38 | 5:46:45.20 | +00:00:18.3 | 0.347 | 1.149 | 0.045 | 1.337 | 9.250 | N | 0.00 | -1 | -1 | -0.100 |
| J054647.2+000724 | N2068/2071 | 39 | 5:46:47.20 | +00:07:24.2 | 0.344 | 1.547 | 0.075 | 1.272 | 11.869 | N | 0.00 | -1 | -1 | 1.196 |
| J054701.8+001806 | N2068/2071 | 40 | 5:47:01.80 | +00:18:06.1 | 0.339 | 2.369 | 0.098 | 1.152 | 14.131 | Y | 1.00 | 0.333 | 2.312 | 1.903 |
| J054702.3+002048 | N2068/2071 | 41 | 5:47:02.40 | +00:20:48.1 | 0.338 | 2.358 | 0.069 | 0.871 | 8.079 | N | 1.00 | 0.292 | 1.512 | 0.864 |
| J054712.8+002221 | N2068/2071 | 42 | 5:47:12.80 | +00:22:21.1 | 0.318 | 1.169 | 0.060 | 1.363 | 8.162 | N | 1.00 | 0.319 | 1.081 | 0.766 |
| J054716.1+002124 | N2068/2071 | 43 | 5:47:16.20 | +00:21:24.1 | 0.313 | 1.288 | 0.074 | 1.242 | 8.314 | N | 1.00 | 0.311 | 1.283 | 1.007 |
| J054633.6-000008 | N2068/2071 | 44 | 5:46:33.61 | -00:00:08.7 | 0.310 | 0.906 | 0.049 | 1.329 | 6.665 | Y | 0.00 | -1 | -1 | 0.542 |
| J054627.6+000133 | N2068/2071 | 45 | 5:46:27.61 | +00:01:33.2 | 0.290 | 1.068 | 0.071 | 1.087 | 7.002 | N | 0.00 | -1 | -1 | 0.821 |
| J054632.4-000041 | N2068/2071 | 46 | 5:46:32.41 | -00:00:41.7 | 0.290 | 0.692 | 0.045 | 0.998 | 4.565 | N | 0.00 | -1 | -1 | 0.511 |
| J054657.2+002009 | N2068/2071 | 47 | 5:46:57.20 | +00:20:09.1 | 0.271 | 2.319 | 0.097 | 0.528 | 4.479 | N | 1.00 | 0.185 | 1.271 | 1.817 |
| J054735.3+002021 | N2068/2071 | 48 | 5:47:35.40 | +00:20:21.1 | 0.253 | 0.552 | 0.040 | 1.176 | 4.598 | N | 1.00 | 0.252 | 0.546 | 0.309 |
| J054725.1+003506 | N2068/2071 | 49 | 5:47:25.20 | +00:35:06.1 | 0.247 | 1.606 | 0.102 | 0.662 | 7.059 | N | 0.00 | -1 | -1 | 1.277 |
| J054726.2+001957 | N2068/2071 | 50 | 5:47:26.20 | +00:19:57.1 | 0.245 | 1.229 | 0.079 | 1.018 | 7.898 | N | 1.00 | 0.243 | 1.220 | 0.905 |
| J054606.2-001214 | N2068/2071 | 51 | 5:46:06.21 | -00:12:14.6 | 0.242 | 0.807 | 0.051 | 0.893 | 4.558 | N | 0.00 | -1 | -1 | 0.306 |
| J054729.6+002039 | N2068/2071 | 52 | 5:47:29.60 | +00:20:39.1 | 0.233 | 0.891 | 0.056 | 0.927 | 6.157 | N | 1.00 | 0.223 | 0.856 | 0.464 |
| J054636.2+000548 | N2068/2071 | 53 | 5:46:36.20 | +00:05:48.2 | 0.223 | 1.242 | 0.092 | 0.871 | 7.612 | N | 0.00 | -1 | -1 | 0.907 |
| J054712.1+002303 | N2068/2071 | 54 | 5:47:12.20 | +00:23:03.1 | 0.220 | 1.554 | 0.068 | 0.863 | 9.323 | N | 1.00 | 0.217 | 1.571 | 0.988 |
| J054715.6+001842 | N2068/2071 | 55 | 5:47:15.60 | +00:18:42.1 | 0.214 | 1.955 | 0.100 | 0.852 | 13.147 | N | 1.00 | 0.214 | 1.985 | 1.468 |
| J054654.8+002254 | N2068/2071 | 56 | 5:46:54.80 | +00:22:54.1 | 0.213 | 0.768 | 0.055 | 0.752 | 4.888 | N | 1.00 | 0.216 | 0.807 | 0.355 |
| J054706.5+002315 | N2068/2071 | 57 | 5:47:06.60 | +00:23:15.1 | 0.212 | 0.509 | 0.042 | 0.744 | 2.879 | N | 1.00 | 0.174 | 0.326 | 0.186 |
| J054655.2+002336 | N2068/2071 | 58 | 5:46:55.20 | +00:23:36.1 | 0.211 | 2.148 | 0.089 | 0.780 | 12.780 | Y | 1.00 | 0.214 | 2.193 | 1.404 |
| J054705.0+001503 | N2068/2071 | 59 | 5:47:05.00 | +00:15:03.1 | 0.210 | 2.004 | 0.098 | 0.949 | 16.976 | N | 1.00 | 0.206 | 1.961 | 1.591 |
| J054613.8-000526 | N2068/2071 | 60 | 5:46:13.81 | -00:05:26.7 | 0.206 | 0.773 | 0.075 | 0.775 | 5.170 | Y | 0.00 | -1 | -1 | 0.540 |
| J054657.3+002357 | N2068/2071 | 61 | 5:46:57.40 | +00:23:57.1 | 0.200 | 0.522 | 0.046 | 0.825 | 3.408 | Y | 1.00 | 0.203 | 0.541 | 0.187 |
| J054629.2+002109 | N2068/2071 | 62 | 5:46:29.20 | +00:21:09.1 | 0.198 | 0.629 | 0.045 | 0.819 | 3.612 | N | 1.00 | 0.199 | 0.631 | 0.192 |
| J054705.6+001321 | N2068/2071 | 63 | 5:47:05.60 | +00:13:21.2 | 0.197 | 0.523 | 0.047 | 0.832 | 3.826 | N | 1.00 | 0.197 | 0.520 | 0.365 |
| J054612.6-000953 | N2068/2071 | 64 | 5:46:12.61 | -00:09:53.6 | 0.194 | 1.361 | 0.085 | 0.734 | 8.294 | N | 0.00 | -1 | -1 | 0.986 |
| J054632.5+002739 | N2068/2071 | 65 | 5:46:32.60 | +00:27:39.1 | 0.189 | 1.320 | 0.090 | 0.784 | 5.034 | N | 1.00 | 0.188 | 1.297 | 1.047 |
| J054628.4+002142 | N2068/2071 | 66 | 5:46:28.40 | +00:21:42.1 | 0.187 | 0.646 | 0.059 | 0.743 | 3.635 | N | 1.00 | 0.187 | 0.647 | 0.384 |
| J054710.7+002330 | N2068/2071 | 67 | 5:47:10.80 | +00:23:30.1 | 0.187 | 1.239 | 0.068 | 0.636 | 5.247 | N | 1.00 | 0.179 | 0.910 | 0.741 |
| J054724.9+001848 | N2068/2071 | 68 | 5:47:25.00 | +00:18:48.1 | 0.185 | 0.526 | 0.058 | 0.824 | 3.501 | N | 1.00 | 0.187 | 0.538 | 0.373 |
| J054604.4-001214 | N2068/2071 | 69 | 5:46:04.41 | -00:12:14.6 | 0.171 | 0.549 | 0.067 | 0.557 | 2.479 | N | 0.00 | -1 | -1 | 0.317 |
| J054758.7+001703 | N2068/2071 | 70 | 5:47:58.80 | +00:17:03.1 | 0.167 | 0.739 | 0.074 | 0.763 | 4.463 | N | 0.00 | -1 | -1 | 0.503 |
| J054659.6+002309 | N2068/2071 | 71 | 5:46:59.60 | +00:23:09.1 | 0.167 | 0.794 | 0.054 | 0.795 | 5.859 | N | 1.00 | 0.170 | 0.838 | 0.422 |
| J054637.9+002706 | N2068/2071 | 72 | 5:46:38.00 | +00:27:06.1 | 0.165 | 1.218 | 0.092 | 0.743 | 3.971 | N | 1.00 | 0.165 | 1.211 | 0.863 |
| J054740.8+004012 | N2068/2071 | 73 | 5:47:40.80 | +00:40:12.1 | 0.161 | 0.828 | 0.077 | 0.519 | 4.636 | N | 0.00 | -1 | -1 | 0.565 |
| J054643.4-000147 | N2068/2071 | 74 | 5:46:43.41 | -00:01:47.7 | 0.161 | 1.001 | 0.089 | 0.650 | 4.202 | N | 0.00 | -1 | -1 | 0.670 |
| J054711.0+001324 | N2068/2071 | 75 | 5:47:11.00 | +00:13:24.2 | 0.160 | 0.883 | 0.075 | 0.685 | 7.092 | N | 1.00 | 0.158 | 0.863 | 0.607 |
| J054759.6+003533 | N2068/2071 | 76 | 5:47:59.60 | +00:35:33.1 | 0.153 | 0.679 | 0.080 | 0.686 | 4.072 | Y | 0.00 | -1 | -1 | 0.473 |
| J054735.2+004130 | N2068/2071 | 77 | 5:47:35.20 | +00:41:30.1 | 0.150 | 0.431 | 0.067 | 0.526 | 1.867 | N | 0.00 | -1 | -1 | 0.256 |
| J054734.9+003545 | N2068/2071 | 78 | 5:47:35.00 | +00:35:45.1 | 0.148 | 0.976 | 0.087 | 0.497 | 5.070 | N | 0.00 | -1 | -1 | 0.719 |
| J054658.4+002430 | N2068/2071 | 79 | 5:46:58.40 | +00:24:30.1 | 0.147 | 0.593 | 0.061 | 0.714 | 4.107 | N | 1.00 | 0.155 | 0.638 | 0.372 |
| J054623.2-001326 | N2068/2071 | 80 | 5:46:23.21 | -00:13:26.6 | 0.145 | 0.981 | 0.093 | 0.523 | 5.144 | N | 0.00 | -1 | -1 | 0.622 |
| J054712.6+001536 | N2068/2071 | 81 | 5:47:12.60 | +00:15:36.1 | 0.138 | 0.385 | 0.054 | 0.771 | 2.947 | N | 1.00 | 0.138 | 0.398 | 0.218 |
| J054705.0+001700 | N2068/2071 | 82 | 5:47:05.00 | +00:17:00.1 | 0.137 | 0.553 | 0.059 | 0.582 | 4.524 | N | 1.00 | 0.138 | 0.567 | 0.374 |
| J054722.4+000657 | N2068/2071 | 83 | 5:47:22.40 | +00:06:57.2 | 0.136 | 1.166 | 0.100 | 0.591 | 8.672 | N | 0.00 | -1 | -1 | 0.816 |
| J054718.4+002242 | N2068/2071 | 84 | 5:47:18.40 | +00:22:42.1 | 0.135 | 1.000 | 0.079 | 0.544 | 6.444 | N | 1.00 | 0.140 | 1.043 | 0.577 |
| J054712.7+004327 | N2068/2071 | 85 | 5:47:12.80 | +00:43:27.1 | 0.129 | 0.187 | 0.053 | 0.487 | 0.700 | N | 0.00 | -1 | -1 | 0.074 |
| J054640.2+000418 | N2068/2071 | 86 | 5:46:40.20 | +00:04:18.2 | 0.127 | 0.375 | 0.060 | 0.633 | 2.410 | Y | 0.00 | -1 | -1 | 0.244 |
| J054720.2+001606 | N2068/2071 | 87 | 5:47:20.20 | +00:16:06.1 | 0.124 | 0.504 | 0.071 | 0.558 | 3.612 | N | 1.00 | 0.124 | 0.500 | 0.277 |
| J054629.2-001544 | N2068/2071 | 88 | 5:46:29.21 | -00:15:44.5 | 0.124 | 0.466 | 0.063 | 0.492 | 2.555 | N | 0.00 | -1 | -1 | 0.318 |
| J054722.7+001539 | N2068/2071 | 89 | 5:47:22.80 | +00:15:39.1 | 0.121 | 0.500 | 0.058 | 0.587 | 3.942 | N | 1.00 | 0.125 | 0.517 | 0.271 |
| J054710.8+001551 | N2068/2071 | 90 | 5:47:10.80 | +00:15:51.1 | 0.120 | 0.415 | 0.057 | 0.606 | 3.312 | N | 1.00 | 0.122 | 0.432 | 0.245 |
| J054652.9+002221 | N2068/2071 | 91 | 5:46:53.00 | +00:22:21.1 | 0.119 | 0.389 | 0.053 | 0.577 | 2.583 | Y | 1.00 | 0.130 | 0.447 | 0.235 |
| J054742.8+003612 | N2068/2071 | 92 | 5:47:42.80 | +00:36:12.1 | 0.117 | 1.235 | 0.111 | 0.498 | 5.783 | N | 0.00 | -1 | -1 | 0.751 |
| J054619.6-000520 | N2068/2071 | 93 | 5:46:19.61 | -00:05:20.7 | 0.114 | 0.096 | 0.030 | 0.334 | 0.017 | N | 0.00 | -1 | -1 | 0.052 |
| J054635.2+002442 | N2068/2071 | 94 | 5:46:35.20 | +00:24:42.1 | 0.113 | 0.733 | 0.081 | 0.655 | 4.139 | N | 1.00 | 0.110 | 0.715 | 0.390 |
| J054718.5+001842 | N2068/2071 | 95 | 5:47:18.60 | +00:18:42.1 | 0.108 | 0.303 | 0.050 | 0.575 | 1.921 | N | 1.00 | 0.106 | 0.292 | 0.153 |
| J054651.4+000909 | N2068/2071 | 96 | 5:46:51.40 | +00:09:09.2 | 0.108 | 0.782 | 0.091 | 0.550 | 6.190 | N | 0.00 | -1 | -1 | 0.435 |
| J054717.1+002336 | N2068/2071 | 97 | 5:47:17.20 | +00:23:36.1 | 0.106 | 0.328 | 0.049 | 0.489 | 2.026 | N | 1.00 | 0.107 | 0.327 | 0.146 |
| J054722.7+002015 | N2068/2071 | 98 | 5:47:22.80 | +00:20:15.1 | 0.104 | 0.178 | 0.037 | 0.447 | 1.110 | N | 1.00 | 0.102 | 0.170 | 0.076 |
| J054731.1+004006 | N2068/2071 | 99 | 5:47:31.20 | +00:40:06.1 | 0.104 | 0.622 | 0.077 | 0.393 | 3.564 | N | 0.00 | -1 | -1 | 0.352 |
| J054737.1+001851 | N2068/2071 | 100 | 5:47:37.20 | +00:18:51.1 | 0.102 | 0.547 | 0.068 | 0.504 | 4.085 | N | 1.00 | 0.106 | 0.577 | 0.329 |
| J054741.2+002703 | N2068/2071 | 101 | 5:47:41.20 | +00:27:03.1 | 0.101 | 0.354 | 0.062 | 0.359 | 1.847 | N | 0.00 | -1 | -1 | 0.204 |
| J054620.2-000044 | N2068/2071 | 102 | 5:46:20.21 | -00:00:44.7 | 0.099 | 0.538 | 0.083 | 0.490 | 3.864 | N | 0.00 | -1 | -1 | 0.267 |
| J054736.3+003827 | N2068/2071 | 103 | 5:47:36.40 | +00:38:27.1 | 0.096 | 0.428 | 0.063 | 0.406 | 2.265 | N | 0.00 | -1 | -1 | 0.162 |
| J054744.9+001945 | N2068/2071 | 104 | 5:47:45.00 | +00:19:45.1 | 0.096 | 0.204 | 0.044 | 0.388 | 0.833 | N | 1.00 | 0.088 | 0.169 | 0.071 |
| J054616.6-000905 | N2068/2071 | 105 | 5:46:16.61 | -00:09:05.6 | 0.095 | 0.194 | 0.047 | 0.401 | 1.117 | N | 0.00 | -1 | -1 | 0.082 |
| J054723.1+002236 | N2068/2071 | 106 | 5:47:23.20 | +00:22:36.1 | 0.093 | 0.268 | 0.049 | 0.447 | 1.361 | N | 1.00 | 0.097 | 0.287 | 0.125 |
| J054723.9+001042 | N2068/2071 | 107 | 5:47:24.00 | +00:10:42.2 | 0.091 | 0.628 | 0.084 | 0.503 | 3.817 | N | 0.83 | 0.088 | 0.567 | 0.354 |
| J054610.0-000547 | N2068/2071 | 108 | 5:46:10.01 | -00:05:47.7 | 0.091 | 0.353 | 0.066 | 0.510 | 1.984 | N | 0.00 | -1 | -1 | 0.180 |
| J054628.6+000424 | N2068/2071 | 109 | 5:46:28.60 | +00:04:24.2 | 0.090 | 0.439 | 0.065 | 0.492 | 2.786 | N | 0.00 | -1 | -1 | 0.254 |
| J054625.1+002506 | N2068/2071 | 110 | 5:46:25.20 | +00:25:06.1 | 0.090 | 0.444 | 0.076 | 0.587 | 1.354 | N | 1.00 | 0.088 | 0.429 | 0.222 |
| J054714.2+000906 | N2068/2071 | 111 | 5:47:14.20 | +00:09:06.2 | 0.088 | 0.092 | 0.038 | 0.354 | 0.444 | N | 0.24 | 0.088 | 0.083 | 0.043 |
| J054634.2+002333 | N2068/2071 | 112 | 5:46:34.20 | +00:23:33.1 | 0.087 | 0.652 | 0.080 | 0.679 | 4.139 | N | 1.00 | 0.087 | 0.656 | 0.287 |
| J054742.4+001957 | N2068/2071 | 113 | 5:47:42.40 | +00:19:57.1 | 0.086 | 0.398 | 0.060 | 0.441 | 2.008 | N | 1.00 | 0.085 | 0.392 | 0.188 |
| J054616.4-000035 | N2068/2071 | 114 | 5:46:16.41 | -00:00:35.7 | 0.086 | 0.243 | 0.056 | 0.439 | 1.659 | N | 0.00 | -1 | -1 | 0.127 |
| J054732.6+000518 | N2068/2071 | 115 | 5:47:32.60 | +00:05:18.2 | 0.085 | 0.496 | 0.081 | 0.440 | 2.987 | N | 0.00 | -1 | -1 | 0.251 |
| J054624.2+002242 | N2068/2071 | 116 | 5:46:24.20 | +00:22:42.1 | 0.084 | 0.559 | 0.080 | 0.625 | 3.177 | N | 1.00 | 0.085 | 0.576 | 0.288 |
| J054721.8+000539 | N2068/2071 | 117 | 5:47:21.80 | +00:05:39.2 | 0.084 | 0.622 | 0.096 | 0.423 | 4.228 | N | 0.00 | -1 | -1 | 0.316 |
| J054707.2+000045 | N2068/2071 | 118 | 5:47:07.20 | +00:00:45.2 | 0.082 | 0.158 | 0.053 | 0.348 | 0.866 | N | 0.00 | -1 | -1 | 0.060 |
| J054754.1+001809 | N2068/2071 | 119 | 5:47:54.20 | +00:18:09.1 | 0.082 | 0.600 | 0.084 | 0.580 | 3.281 | N | 0.00 | -1 | -1 | 0.318 |
| J054724.3+001512 | N2068/2071 | 120 | 5:47:24.40 | +00:15:12.1 | 0.082 | 0.467 | 0.080 | 0.450 | 2.862 | N | 1.00 | 0.081 | 0.464 | 0.189 |
| J054734.0+001724 | N2068/2071 | 121 | 5:47:34.00 | +00:17:24.1 | 0.081 | 0.268 | 0.060 | 0.382 | 1.603 | N | 1.00 | 0.080 | 0.262 | 0.157 |
| J054747.9+001924 | N2068/2071 | 122 | 5:47:48.00 | +00:19:24.1 | 0.081 | 0.209 | 0.054 | 0.374 | 0.885 | N | 0.92 | 0.073 | 0.161 | 0.066 |
| J054603.8-001620 | N2068/2071 | 123 | 5:46:03.81 | -00:16:20.5 | 0.080 | 0.324 | 0.061 | 0.437 | 1.541 | N | 0.00 | -1 | -1 | 0.122 |
| J054749.1+001924 | N2068/2071 | 124 | 5:47:49.20 | +00:19:24.1 | 0.080 | 0.149 | 0.044 | 0.430 | 0.467 | N | 0.71 | 0.070 | 0.102 | 0.022 |
| J054538.9+002900 | N2068/2071 | 125 | 5:45:39.00 | +00:29:00.0 | 0.079 | 0.319 | 0.070 | 0.681 | 1.686 | N | 0.00 | -1 | -1 | 0.186 |
| J054744.5+000921 | N2068/2071 | 126 | 5:47:44.60 | +00:09:21.2 | 0.079 | 0.137 | 0.047 | 0.358 | 1.029 | N | 0.00 | -1 | -1 | 0.058 |
| J054735.3+003739 | N2068/2071 | 127 | 5:47:35.40 | +00:37:39.1 | 0.078 | 0.255 | 0.050 | 0.353 | 1.363 | N | 0.00 | -1 | -1 | 0.108 |
| J054613.3+002354 | N2068/2071 | 128 | 5:46:13.40 | +00:23:54.1 | 0.077 | 0.166 | 0.055 | 0.610 | 0.606 | N | 0.00 | -1 | -1 | 0.045 |
| J054737.1+003803 | N2068/2071 | 129 | 5:47:37.20 | +00:38:03.1 | 0.077 | 0.140 | 0.037 | 0.331 | 0.894 | N | 0.00 | -1 | -1 | 0.033 |
| J054739.7+001415 | N2068/2071 | 130 | 5:47:39.80 | +00:14:15.1 | 0.076 | 0.414 | 0.084 | 0.365 | 2.430 | N | 0.09 | 0.076 | 0.400 | 0.157 |
| J054701.5+002457 | N2068/2071 | 131 | 5:47:01.60 | +00:24:57.1 | 0.075 | 0.227 | 0.049 | 0.435 | 1.001 | N | 1.00 | 0.071 | 0.231 | 0.095 |
| J054703.4-000244 | N2068/2071 | 132 | 5:47:03.40 | -00:02:44.7 | 0.075 | 0.306 | 0.060 | 0.399 | 2.119 | N | 0.00 | -1 | -1 | 0.151 |
| J054722.7+004412 | N2068/2071 | 133 | 5:47:22.80 | +00:44:12.1 | 0.075 | 0.643 | 0.091 | 0.339 | 3.010 | N | 0.00 | -1 | -1 | 0.393 |
| J054627.8+000342 | N2068/2071 | 134 | 5:46:27.80 | +00:03:42.2 | 0.074 | 0.123 | 0.043 | 0.444 | 0.713 | N | 0.00 | -1 | -1 | 0.027 |
| J054614.6+002312 | N2068/2071 | 135 | 5:46:14.60 | +00:23:12.1 | 0.073 | 0.246 | 0.056 | 0.801 | 1.327 | N | 0.19 | 0.073 | 0.229 | 0.104 |
| J054748.3+001612 | N2068/2071 | 136 | 5:47:48.40 | +00:16:12.1 | 0.072 | 0.323 | 0.071 | 0.449 | 1.526 | N | 0.06 | 0.072 | 0.316 | 0.136 |
| J054557.4-001523 | N2068/2071 | 137 | 5:45:57.41 | -00:15:23.5 | 0.072 | 0.267 | 0.058 | 0.435 | -0.051 | N | 0.00 | -1 | -1 | 0.112 |
| J054651.6-000135 | N2068/2071 | 138 | 5:46:51.60 | -00:01:35.7 | 0.071 | 0.191 | 0.059 | 0.417 | 0.429 | N | 0.00 | -1 | -1 | 0.086 |
| J054621.5+002615 | N2068/2071 | 139 | 5:46:21.60 | +00:26:15.1 | 0.071 | 0.264 | 0.062 | 0.767 | 1.437 | N | 0.00 | -1 | -1 | 0.114 |
| J054712.4+002836 | N2068/2071 | 140 | 5:47:12.40 | +00:28:36.1 | 0.070 | 0.348 | 0.078 | 0.357 | 1.717 | N | 0.00 | -1 | -1 | 0.138 |
| J054654.4+000442 | N2068/2071 | 141 | 5:46:54.40 | +00:04:42.2 | 0.070 | 0.495 | 0.083 | 0.396 | 2.851 | N | 0.00 | -1 | -1 | 0.255 |
| J054708.3+002503 | N2068/2071 | 142 | 5:47:08.40 | +00:25:03.1 | 0.070 | 0.252 | 0.055 | 0.372 | 1.252 | N | 1.00 | 0.077 | 0.286 | 0.112 |
| J054616.0+002233 | N2068/2071 | 143 | 5:46:16.00 | +00:22:33.1 | 0.069 | 0.174 | 0.050 | 0.562 | 1.039 | N | 0.93 | 0.064 | 0.137 | 0.083 |
| J054738.3+001803 | N2068/2071 | 144 | 5:47:38.40 | +00:18:03.1 | 0.069 | 0.112 | 0.036 | 0.493 | 0.722 | N | 1.00 | 0.069 | 0.113 | 0.053 |
| J054646.2+000936 | N2068/2071 | 145 | 5:46:46.20 | +00:09:36.2 | 0.069 | 0.330 | 0.070 | 0.508 | 2.316 | N | 0.00 | -1 | -1 | 0.150 |
| J054641.6+000309 | N2068/2071 | 146 | 5:46:41.60 | +00:03:09.2 | 0.068 | 0.092 | 0.038 | 0.394 | 0.613 | N | 0.00 | -1 | -1 | 0.043 |
| J054553.6-001259 | N2068/2071 | 147 | 5:45:53.61 | -00:12:59.5 | 0.068 | 0.158 | 0.046 | 0.426 | 0.586 | N | 0.00 | -1 | -1 | 0.064 |
| J054714.9+002009 | N2068/2071 | 148 | 5:47:15.00 | +00:20:09.1 | 0.068 | 0.116 | 0.043 | 0.467 | 0.999 | N | 1.00 | 0.069 | 0.133 | 0.044 |
| J054741.6+001803 | N2068/2071 | 149 | 5:47:41.60 | +00:18:03.1 | 0.068 | 0.105 | 0.036 | 0.480 | 0.592 | N | 1.00 | 0.067 | 0.103 | 0.051 |
| J054728.0+004103 | N2068/2071 | 150 | 5:47:28.00 | +00:41:03.1 | 0.066 | 0.080 | 0.036 | 0.274 | 0.385 | N | 0.00 | -1 | -1 | 0.010 |
| J054620.7+002854 | N2068/2071 | 151 | 5:46:20.80 | +00:28:54.1 | 0.065 | 0.368 | 0.074 | 0.714 | 1.720 | N | 0.00 | -1 | -1 | 0.192 |
| J054743.6+003039 | N2068/2071 | 152 | 5:47:43.60 | +00:30:39.1 | 0.064 | 0.250 | 0.063 | 0.320 | 0.794 | N | 0.00 | -1 | -1 | 0.101 |
| J054645.6+000330 | N2068/2071 | 153 | 5:46:45.60 | +00:03:30.2 | 0.064 | 0.205 | 0.055 | 0.417 | 1.421 | N | 0.00 | -1 | -1 | 0.096 |
| J054709.6+001821 | N2068/2071 | 154 | 5:47:09.60 | +00:18:21.1 | 0.064 | 0.142 | 0.045 | 0.401 | 0.913 | N | 1.00 | 0.067 | 0.149 | 0.057 |
| J054735.8+000633 | N2068/2071 | 155 | 5:47:35.80 | +00:06:33.2 | 0.064 | 0.426 | 0.085 | 0.490 | 2.593 | N | 0.00 | -1 | -1 | 0.140 |
| J054735.5+003900 | N2068/2071 | 156 | 5:47:35.60 | +00:39:00.1 | 0.064 | 0.135 | 0.041 | 0.314 | 0.618 | N | 0.00 | -1 | -1 | 0.048 |
| J054755.1+001945 | N2068/2071 | 157 | 5:47:55.20 | +00:19:45.1 | 0.064 | 0.400 | 0.084 | 0.462 | 2.496 | N | 0.00 | -1 | -1 | 0.152 |
| J054731.8+001621 | N2068/2071 | 158 | 5:47:31.80 | +00:16:21.1 | 0.064 | 0.303 | 0.072 | 0.399 | 1.582 | N | 1.00 | 0.063 | 0.301 | 0.119 |
| J054618.4-001023 | N2068/2071 | 159 | 5:46:18.41 | -00:10:23.6 | 0.063 | 0.180 | 0.057 | 0.357 | 0.728 | N | 0.00 | -1 | -1 | 0.083 |
| J054748.6+003842 | N2068/2071 | 160 | 5:47:48.60 | +00:38:42.1 | 0.062 | 0.229 | 0.060 | 0.416 | 1.115 | N | 0.00 | -1 | -1 | 0.064 |
| J054857.9+001418 | N2068/2071 | 161 | 5:48:58.00 | +00:14:18.1 | 0.062 | 0.105 | 0.053 | 0.454 | 0.398 | N | 0.00 | -1 | -1 | 0.011 |
| J054746.3+001724 | N2068/2071 | 162 | 5:47:46.40 | +00:17:24.1 | 0.061 | 0.244 | 0.057 | 0.408 | 1.193 | N | 0.35 | 0.061 | 0.225 | 0.118 |
| J054616.2-001150 | N2068/2071 | 163 | 5:46:16.21 | -00:11:50.6 | 0.061 | 0.216 | 0.057 | 0.433 | 0.663 | N | 0.00 | -1 | -1 | 0.073 |
| J054713.2+002645 | N2068/2071 | 164 | 5:47:13.20 | +00:26:45.1 | 0.061 | 0.094 | 0.038 | 0.401 | 0.615 | N | 0.00 | -1 | -1 | 0.032 |
| J054715.7+004212 | N2068/2071 | 165 | 5:47:15.80 | +00:42:12.1 | 0.061 | 0.213 | 0.060 | 0.337 | 1.118 | N | 0.00 | -1 | -1 | 0.068 |
| J054803.7+001703 | N2068/2071 | 166 | 5:48:03.80 | +00:17:03.1 | 0.061 | 0.129 | 0.048 | 0.428 | 0.735 | N | 0.00 | -1 | -1 | 0.029 |
| J054648.8+001006 | N2068/2071 | 167 | 5:46:48.80 | +00:10:06.2 | 0.060 | 0.122 | 0.044 | 0.494 | 0.681 | N | 0.00 | -1 | -1 | 0.045 |
| J054715.0+000736 | N2068/2071 | 168 | 5:47:15.00 | +00:07:36.2 | 0.059 | 0.232 | 0.062 | 0.348 | 1.423 | N | 0.00 | -1 | -1 | 0.078 |
| J054534.9+003048 | N2068/2071 | 169 | 5:45:35.00 | +00:30:48.0 | 0.059 | 0.347 | 0.078 | 0.665 | 1.066 | N | 0.00 | -1 | -1 | 0.151 |
| J054714.8+001451 | N2068/2071 | 170 | 5:47:14.80 | +00:14:51.1 | 0.059 | 0.098 | 0.040 | 0.416 | 0.701 | N | 1.00 | 0.061 | 0.100 | 0.027 |
| J054716.2+000900 | N2068/2071 | 171 | 5:47:16.20 | +00:09:00.2 | 0.059 | 0.065 | 0.037 | 0.351 | 0.481 | N | 0.98 | 0.049 | 0.036 | 0.013 |
| J054626.7+002709 | N2068/2071 | 172 | 5:46:26.80 | +00:27:09.1 | 0.058 | 0.077 | 0.038 | 0.441 | 0.284 | N | 0.80 | 0.050 | 0.063 | 0.023 |
| J054815.7+001745 | N2068/2071 | 173 | 5:48:15.80 | +00:17:45.1 | 0.058 | 0.217 | 0.061 | 0.380 | 1.187 | N | 0.00 | -1 | -1 | 0.066 |
| J054622.2+002342 | N2068/2071 | 174 | 5:46:22.20 | +00:23:42.1 | 0.058 | 0.136 | 0.048 | 0.620 | 0.673 | N | 1.00 | 0.057 | 0.134 | 0.041 |
| J054553.8-001035 | N2068/2071 | 175 | 5:45:53.81 | -00:10:35.6 | 0.057 | 0.148 | 0.051 | 0.514 | 0.685 | N | 0.00 | -1 | -1 | 0.032 |
| J054620.8+000215 | N2068/2071 | 176 | 5:46:20.81 | +00:02:15.2 | 0.057 | 0.125 | 0.051 | 0.469 | 0.564 | N | 0.00 | -1 | -1 | 0.048 |
| J054748.7+001357 | N2068/2071 | 177 | 5:47:48.80 | +00:13:57.2 | 0.056 | 0.223 | 0.065 | 0.306 | 0.925 | N | 0.00 | -1 | -1 | 0.103 |
| J054556.0-000808 | N2068/2071 | 178 | 5:45:56.01 | -00:08:08.6 | 0.056 | 0.085 | 0.043 | 0.378 | 0.362 | N | 0.00 | -1 | -1 | 0.033 |
| J054559.2-001114 | N2068/2071 | 179 | 5:45:59.21 | -00:11:14.6 | 0.055 | 0.132 | 0.047 | 0.337 | 0.547 | N | 0.00 | -1 | -1 | 0.055 |
| J054731.1+001724 | N2068/2071 | 180 | 5:47:31.20 | +00:17:24.1 | 0.055 | 0.044 | 0.030 | 0.350 | 0.216 | N | 1.00 | 0.054 | 0.041 | 0.007 |
| J054628.4-002414 | N2068/2071 | 181 | 5:46:28.41 | -00:24:14.3 | 0.055 | 0.051 | 0.032 | 0.472 | 0.257 | N | 0.00 | -1 | -1 | 0.004 |
| J054733.7+000657 | N2068/2071 | 182 | 5:47:33.80 | +00:06:57.2 | 0.055 | 0.105 | 0.047 | 0.339 | 0.759 | N | 0.00 | -1 | -1 | 0.017 |
| J054701.6-000238 | N2068/2071 | 183 | 5:47:01.60 | -00:02:38.7 | 0.055 | 0.042 | 0.028 | 0.314 | 0.298 | N | 0.00 | -1 | -1 | 0.002 |
| J054743.2+003718 | N2068/2071 | 184 | 5:47:43.20 | +00:37:18.1 | 0.055 | 0.100 | 0.040 | 0.323 | 0.733 | N | 0.00 | -1 | -1 | 0.045 |
| J054747.0+004054 | N2068/2071 | 185 | 5:47:47.00 | +00:40:54.1 | 0.055 | 0.274 | 0.071 | 0.337 | 1.588 | Y | 0.00 | -1 | -1 | 0.104 |
| J054709.1+002600 | N2068/2071 | 186 | 5:47:09.20 | +00:26:00.1 | 0.055 | 0.184 | 0.054 | 0.353 | 1.052 | N | 0.88 | 0.054 | 0.158 | 0.061 |
| J054615.4+002415 | N2068/2071 | 187 | 5:46:15.40 | +00:24:15.1 | 0.054 | 0.040 | 0.029 | 0.672 | 0.327 | N | 0.00 | -1 | -1 | 0.005 |
| J054543.8+002839 | N2068/2071 | 188 | 5:45:43.80 | +00:28:39.1 | 0.054 | 0.111 | 0.048 | 0.585 | 0.624 | N | 0.00 | -1 | -1 | 0.028 |
| J054746.6+002815 | N2068/2071 | 189 | 5:47:46.60 | +00:28:15.1 | 0.054 | 0.198 | 0.061 | 0.312 | 1.255 | N | 0.00 | -1 | -1 | 0.067 |
| J054645.2+000606 | N2068/2071 | 190 | 5:46:45.20 | +00:06:06.2 | 0.054 | 0.094 | 0.045 | 0.413 | 0.810 | N | 0.00 | -1 | -1 | 0.015 |
| J054637.2-000120 | N2068/2071 | 191 | 5:46:37.21 | -00:01:20.7 | 0.054 | 0.189 | 0.062 | 0.465 | 0.850 | N | 0.00 | -1 | -1 | 0.043 |
| J054644.0-000617 | N2068/2071 | 192 | 5:46:44.01 | -00:06:17.7 | 0.054 | 0.050 | 0.037 | 0.300 | -0.041 | N | 0.00 | -1 | -1 | 0.001 |
| J054702.2+000215 | N2068/2071 | 193 | 5:47:02.20 | +00:02:15.2 | 0.054 | 0.176 | 0.056 | 0.358 | 0.830 | N | 0.00 | -1 | -1 | 0.065 |
| J054722.1+002648 | N2068/2071 | 194 | 5:47:22.20 | +00:26:48.1 | 0.054 | 0.338 | 0.080 | 0.409 | 1.951 | N | 0.20 | 0.054 | 0.323 | 0.123 |
| J054721.1+001248 | N2068/2071 | 195 | 5:47:21.20 | +00:12:48.2 | 0.053 | 0.088 | 0.047 | 0.348 | 0.726 | N | 1.00 | 0.053 | 0.089 | 0.022 |
| J054748.0+004342 | N2068/2071 | 196 | 5:47:48.00 | +00:43:42.1 | 0.053 | 0.152 | 0.056 | 0.342 | 0.805 | N | 0.00 | -1 | -1 | 0.057 |
| J054606.4+002557 | N2068/2071 | 197 | 5:46:06.40 | +00:25:57.1 | 0.053 | 0.239 | 0.074 | 0.664 | 1.419 | N | 0.00 | -1 | -1 | 0.067 |
| J054628.4+002630 | N2068/2071 | 198 | 5:46:28.40 | +00:26:30.1 | 0.053 | 0.055 | 0.038 | 0.448 | 0.085 | N | 1.00 | 0.050 | 0.052 | -0.013 |
| J054748.6+000842 | N2068/2071 | 199 | 5:47:48.60 | +00:08:42.2 | 0.053 | 0.169 | 0.058 | 0.341 | 1.102 | N | 0.00 | -1 | -1 | 0.059 |
| J054646.6+002545 | N2068/2071 | 200 | 5:46:46.60 | +00:25:45.1 | 0.052 | 0.100 | 0.040 | 0.466 | 0.431 | N | 1.00 | 0.053 | 0.102 | 0.035 |
| J054805.5+001654 | N2068/2071 | 201 | 5:48:05.60 | +00:16:54.1 | 0.052 | 0.105 | 0.041 | 0.363 | 0.463 | N | 0.00 | -1 | -1 | 0.041 |
| J054739.6+002639 | N2068/2071 | 202 | 5:47:39.60 | +00:26:39.1 | 0.052 | 0.066 | 0.034 | 0.246 | 0.274 | N | 0.00 | -1 | -1 | 0.016 |
| J054618.0+000124 | N2068/2071 | 203 | 5:46:18.01 | +00:01:24.2 | 0.052 | 0.173 | 0.058 | 0.354 | 1.061 | N | 0.00 | -1 | -1 | 0.061 |
| J054654.1+003724 | N2068/2071 | 204 | 5:46:54.20 | +00:37:24.1 | 0.052 | 0.142 | 0.048 | 0.354 | 0.694 | N | 0.00 | -1 | -1 | 0.059 |
| J054739.3+000936 | N2068/2071 | 205 | 5:47:39.40 | +00:09:36.2 | 0.052 | 0.116 | 0.055 | 0.334 | 0.410 | N | 0.00 | -1 | -1 | 0.006 |
| J054619.4+000327 | N2068/2071 | 206 | 5:46:19.41 | +00:03:27.2 | 0.052 | 0.090 | 0.043 | 0.335 | 0.319 | N | 0.00 | -1 | -1 | 0.008 |
| J054648.9+003042 | N2068/2071 | 207 | 5:46:49.00 | +00:30:42.1 | 0.052 | 0.157 | 0.053 | 0.374 | 0.802 | N | 0.26 | 0.052 | 0.150 | 0.051 |
| J054622.0+000442 | N2068/2071 | 208 | 5:46:22.01 | +00:04:42.2 | 0.052 | 0.083 | 0.041 | 0.398 | 0.438 | N | 0.00 | -1 | -1 | 0.019 |
| J054759.0+004630 | N2068/2071 | 209 | 5:47:59.00 | +00:46:30.1 | 0.052 | 0.086 | 0.043 | 0.334 | 0.424 | N | 0.00 | -1 | -1 | 0.022 |
| J054708.5+004524 | N2068/2071 | 210 | 5:47:08.60 | +00:45:24.1 | 0.052 | 0.035 | 0.033 | 0.224 | 0.155 | N | 0.00 | -1 | -1 | 0.007 |
| J054807.6+002718 | N2068/2071 | 211 | 5:48:07.60 | +00:27:18.1 | 0.052 | 0.124 | 0.050 | 0.338 | 0.773 | N | 0.00 | -1 | -1 | 0.034 |
| J054601.0-001247 | N2068/2071 | 212 | 5:46:01.01 | -00:12:47.6 | 0.051 | 0.073 | 0.036 | 0.435 | 0.157 | N | 0.00 | -1 | -1 | 0.016 |
| J054811.7+001803 | N2068/2071 | 213 | 5:48:11.80 | +00:18:03.1 | 0.051 | 0.141 | 0.054 | 0.388 | 0.848 | N | 0.00 | -1 | -1 | 0.030 |
| J054713.8+001151 | N2068/2071 | 214 | 5:47:13.80 | +00:11:51.2 | 0.051 | 0.073 | 0.041 | 0.295 | 0.491 | N | 1.00 | 0.049 | 0.066 | 0.005 |
| J054651.5+002730 | N2068/2071 | 215 | 5:46:51.60 | +00:27:30.1 | 0.051 | 0.112 | 0.050 | 0.360 | 0.436 | N | 1.00 | 0.050 | 0.109 | 0.024 |
| J054604.8-000641 | N2068/2071 | 216 | 5:46:04.81 | -00:06:41.7 | 0.051 | 0.032 | 0.029 | 0.343 | 0.086 | N | 0.00 | -1 | -1 | 0.001 |
| J054613.5+002757 | N2068/2071 | 217 | 5:46:13.60 | +00:27:57.1 | 0.051 | 0.123 | 0.057 | 0.518 | 0.006 | N | 0.00 | -1 | -1 | 0.002 |
| J054608.0-000650 | N2068/2071 | 218 | 5:46:08.01 | -00:06:50.7 | 0.050 | 0.099 | 0.047 | 0.474 | 0.206 | N | 0.00 | -1 | -1 | 0.026 |
| J054756.6+003333 | N2068/2071 | 219 | 5:47:56.60 | +00:33:33.1 | 0.050 | 0.101 | 0.050 | 0.284 | 0.670 | N | 0.00 | -1 | -1 | 0.022 |
| J054742.7+001839 | N2068/2071 | 220 | 5:47:42.80 | +00:18:39.1 | 0.050 | 0.047 | 0.030 | 0.321 | 0.089 | N | 1.00 | 0.051 | 0.050 | 0.009 |
| J054616.0+000857 | N2068/2071 | 221 | 5:46:16.00 | +00:08:57.2 | 0.050 | 0.127 | 0.055 | 0.353 | 0.016 | N | 0.00 | -1 | -1 | 0.024 |
| J054541.6+002830 | N2068/2071 | 222 | 5:45:41.60 | +00:28:30.1 | 0.050 | 0.059 | 0.035 | 0.558 | 0.320 | N | 0.00 | -1 | -1 | 0.005 |
| J054725.5+002845 | N2068/2071 | 223 | 5:47:25.60 | +00:28:45.1 | 0.050 | 0.109 | 0.045 | 0.376 | 0.584 | N | 0.00 | -1 | -1 | 0.041 |
| J054654.9+003318 | N2068/2071 | 224 | 5:46:55.00 | +00:33:18.1 | 0.049 | 0.085 | 0.047 | 0.294 | 0.476 | N | 0.00 | -1 | -1 | 0.017 |
| J054756.9+002230 | N2068/2071 | 225 | 5:47:57.00 | +00:22:30.1 | 0.049 | 0.196 | 0.064 | 0.389 | 1.073 | N | 0.00 | -1 | -1 | 0.069 |
| J054645.1+002454 | N2068/2071 | 226 | 5:46:45.20 | +00:24:54.1 | 0.049 | 0.408 | 0.087 | 0.573 | 2.030 | N | 1.00 | 0.049 | 0.421 | 0.093 |
| J054856.7+001424 | N2068/2071 | 227 | 5:48:56.79 | +00:14:24.1 | 0.049 | 0.102 | 0.047 | 0.387 | 0.510 | N | 0.00 | -1 | -1 | 0.026 |
| J054620.4-000241 | N2068/2071 | 228 | 5:46:20.41 | -00:02:41.7 | 0.048 | 0.065 | 0.038 | 0.310 | 0.332 | N | 0.00 | -1 | -1 | 0.017 |
| J054744.7+000818 | N2068/2071 | 229 | 5:47:44.80 | +00:08:18.2 | 0.048 | 0.079 | 0.040 | 0.463 | 0.381 | N | 0.00 | -1 | -1 | 0.016 |
| J054553.2-001329 | N2068/2071 | 230 | 5:45:53.22 | -00:13:29.5 | 0.048 | 0.035 | 0.027 | 0.377 | 0.166 | N | 0.00 | -1 | -1 | 0.001 |
| J054623.4-002250 | N2068/2071 | 231 | 5:46:23.41 | -00:22:50.4 | 0.048 | 0.089 | 0.042 | 0.446 | 0.412 | N | 0.00 | -1 | -1 | 0.011 |
| J054706.1+003206 | N2068/2071 | 232 | 5:47:06.20 | +00:32:06.1 | 0.048 | 0.112 | 0.057 | 0.314 | 0.360 | N | 0.00 | -1 | -1 | 0.006 |
| J054814.6+004221 | N2068/2071 | 233 | 5:48:14.60 | +00:42:21.1 | 0.048 | 0.032 | 0.032 | 0.266 | 0.085 | N | 0.00 | -1 | -1 | -0.000 |
| J054554.8-001002 | N2068/2071 | 234 | 5:45:54.81 | -00:10:02.6 | 0.048 | 0.107 | 0.047 | 0.364 | 0.565 | N | 0.00 | -1 | -1 | 0.035 |
| J054659.3+003721 | N2068/2071 | 235 | 5:46:59.40 | +00:37:21.1 | 0.048 | 0.109 | 0.047 | 0.274 | 0.391 | N | 0.00 | -1 | -1 | 0.027 |
| J054629.8+001724 | N2068/2071 | 236 | 5:46:29.80 | +00:17:24.1 | 0.048 | 0.112 | 0.052 | 0.472 | 0.301 | N | 1.00 | 0.042 | 0.080 | 0.006 |
| J054656.6+000648 | N2068/2071 | 237 | 5:46:56.60 | +00:06:48.2 | 0.048 | 0.049 | 0.036 | 0.275 | 0.307 | N | 0.00 | -1 | -1 | 0.008 |
| J054742.7+001554 | N2068/2071 | 238 | 5:47:42.80 | +00:15:54.1 | 0.047 | 0.051 | 0.038 | 0.347 | 0.285 | N | 0.52 | 0.047 | 0.038 | 0.000 |
| J054531.3+003645 | N2068/2071 | 239 | 5:45:31.40 | +00:36:45.0 | 0.047 | 0.049 | 0.035 | 0.399 | 0.083 | N | 0.00 | -1 | -1 | 0.010 |
| J054708.4+001851 | N2068/2071 | 240 | 5:47:08.40 | +00:18:51.1 | 0.047 | 0.052 | 0.031 | 0.328 | 0.250 | N | 1.00 | 0.049 | 0.054 | 0.007 |
| J054650.3+005236 | N2068/2071 | 241 | 5:46:50.39 | +00:52:36.1 | 0.047 | 0.062 | 0.043 | 0.265 | 0.285 | N | 0.00 | -1 | -1 | 0.009 |
| J054616.9+002351 | N2068/2071 | 242 | 5:46:17.00 | +00:23:51.1 | 0.047 | 0.040 | 0.028 | 0.520 | 0.013 | N | 0.29 | 0.047 | 0.035 | 0.002 |
| J054751.6+004554 | N2068/2071 | 243 | 5:47:51.60 | +00:45:54.1 | 0.047 | 0.088 | 0.047 | 0.275 | 0.397 | N | 0.00 | -1 | -1 | 0.007 |
| J054614.2-000250 | N2068/2071 | 244 | 5:46:14.21 | -00:02:50.7 | 0.047 | 0.187 | 0.067 | 0.458 | 1.002 | N | 0.00 | -1 | -1 | 0.029 |
| J054701.4-000053 | N2068/2071 | 245 | 5:47:01.40 | -00:00:53.7 | 0.047 | 0.044 | 0.033 | 0.405 | 0.322 | N | 0.00 | -1 | -1 | 0.009 |
| J054728.7+004548 | N2068/2071 | 246 | 5:47:28.80 | +00:45:48.1 | 0.047 | 0.050 | 0.033 | 0.257 | 0.269 | N | 0.00 | -1 | -1 | 0.007 |
| J054655.3+002909 | N2068/2071 | 247 | 5:46:55.40 | +00:29:09.1 | 0.046 | 0.056 | 0.036 | 0.433 | 0.260 | N | 0.81 | 0.040 | 0.043 | 0.015 |
| J054551.1+002545 | N2068/2071 | 248 | 5:45:51.20 | +00:25:45.1 | 0.046 | 0.139 | 0.056 | 0.631 | 0.666 | N | 0.00 | -1 | -1 | 0.026 |
| J054800.0+002539 | N2068/2071 | 249 | 5:48:00.00 | +00:25:39.1 | 0.046 | 0.089 | 0.047 | 0.305 | 0.426 | N | 0.00 | -1 | -1 | 0.025 |
| J054619.0+000703 | N2068/2071 | 250 | 5:46:19.00 | +00:07:03.2 | 0.045 | 0.047 | 0.032 | 0.308 | 0.099 | N | 0.00 | -1 | -1 | 0.015 |
| J054825.7+001618 | N2068/2071 | 251 | 5:48:25.80 | +00:16:18.1 | 0.045 | 0.064 | 0.038 | 0.316 | 0.272 | N | 0.00 | -1 | -1 | 0.008 |
| J054533.4+002918 | N2068/2071 | 252 | 5:45:33.40 | +00:29:18.0 | 0.045 | 0.033 | 0.030 | 0.510 | 0.296 | N | 0.00 | -1 | -1 | 0.014 |
| J054556.0-001329 | N2068/2071 | 253 | 5:45:56.01 | -00:13:29.5 | 0.045 | 0.106 | 0.052 | 0.427 | 0.471 | N | 0.00 | -1 | -1 | 0.026 |
| J054613.0-001302 | N2068/2071 | 254 | 5:46:13.01 | -00:13:02.6 | 0.045 | 0.041 | 0.032 | 0.356 | 0.351 | N | 0.00 | -1 | -1 | 0.007 |
| J054558.6+002424 | N2068/2071 | 255 | 5:45:58.60 | +00:24:24.1 | 0.045 | 0.057 | 0.039 | 0.549 | -0.035 | N | 0.00 | -1 | -1 | 0.009 |
| J054732.6+004409 | N2068/2071 | 256 | 5:47:32.60 | +00:44:09.1 | 0.045 | 0.049 | 0.035 | 0.311 | 0.174 | N | 0.00 | -1 | -1 | -0.004 |
| J054720.4+004300 | N2068/2071 | 257 | 5:47:20.40 | +00:43:00.1 | 0.045 | 0.105 | 0.052 | 0.252 | 0.383 | N | 0.00 | -1 | -1 | 0.015 |
| J054624.0+000542 | N2068/2071 | 258 | 5:46:24.01 | +00:05:42.2 | 0.045 | 0.170 | 0.066 | 0.343 | 0.828 | N | 0.00 | -1 | -1 | 0.009 |
| J054712.7+004209 | N2068/2071 | 259 | 5:47:12.80 | +00:42:09.1 | 0.045 | 0.085 | 0.038 | 0.277 | 0.247 | N | 0.00 | -1 | -1 | 0.023 |
| J054527.9+002927 | N2068/2071 | 260 | 5:45:28.00 | +00:29:27.0 | 0.044 | 0.098 | 0.049 | 0.559 | 0.376 | N | 0.00 | -1 | -1 | 0.021 |
| J054800.2+003806 | N2068/2071 | 261 | 5:48:00.20 | +00:38:06.1 | 0.044 | 0.181 | 0.067 | 0.332 | 0.880 | N | 0.00 | -1 | -1 | 0.023 |
| J054636.8+000309 | N2068/2071 | 262 | 5:46:36.81 | +00:03:09.2 | 0.044 | 0.064 | 0.039 | 0.296 | 0.127 | N | 0.00 | -1 | -1 | 0.007 |
| J054710.6+000451 | N2068/2071 | 263 | 5:47:10.60 | +00:04:51.2 | 0.044 | 0.178 | 0.061 | 0.350 | 1.042 | N | 0.00 | -1 | -1 | 0.033 |
| J054618.2+001239 | N2068/2071 | 264 | 5:46:18.20 | +00:12:39.1 | 0.044 | 0.038 | 0.030 | 0.387 | 0.169 | N | 0.00 | -1 | -1 | 0.004 |
| J054705.3+003521 | N2068/2071 | 265 | 5:47:05.40 | +00:35:21.1 | 0.044 | 0.109 | 0.051 | 0.362 | 0.395 | N | 0.00 | -1 | -1 | 0.009 |
| J054622.4-000356 | N2068/2071 | 266 | 5:46:22.41 | -00:03:56.7 | 0.044 | 0.094 | 0.049 | 0.421 | 0.446 | N | 0.00 | -1 | -1 | 0.008 |
| J054800.4+004654 | N2068/2071 | 267 | 5:48:00.40 | +00:46:54.1 | 0.044 | 0.074 | 0.042 | 0.238 | 0.382 | N | 0.00 | -1 | -1 | 0.023 |
| J054629.6+001251 | N2068/2071 | 268 | 5:46:29.60 | +00:12:51.1 | 0.044 | 0.036 | 0.032 | 0.334 | 0.064 | N | 0.00 | -1 | -1 | 0.006 |
| J054738.5+004930 | N2068/2071 | 269 | 5:47:38.60 | +00:49:30.1 | 0.044 | 0.078 | 0.044 | 0.329 | 0.276 | N | 0.00 | -1 | -1 | 0.011 |
| J054649.6+001948 | N2068/2071 | 270 | 5:46:49.60 | +00:19:48.1 | 0.043 | 0.040 | 0.036 | 0.400 | 0.231 | N | 1.00 | 0.041 | 0.034 | 0.004 |
| J054546.2+002527 | N2068/2071 | 271 | 5:45:46.20 | +00:25:27.1 | 0.043 | 0.088 | 0.049 | 0.506 | 0.246 | N | 0.00 | -1 | -1 | 0.014 |
| J054700.3+003921 | N2068/2071 | 272 | 5:47:00.40 | +00:39:21.1 | 0.043 | 0.097 | 0.049 | 0.273 | 0.388 | N | 0.00 | -1 | -1 | 0.023 |
| J054608.4+002245 | N2068/2071 | 273 | 5:46:08.40 | +00:22:45.1 | 0.043 | 0.055 | 0.036 | 0.565 | 0.225 | N | 0.00 | -1 | -1 | -0.003 |
| J054620.6+002433 | N2068/2071 | 274 | 5:46:20.60 | +00:24:33.1 | 0.043 | 0.095 | 0.049 | 0.567 | 0.359 | N | 0.18 | 0.041 | 0.090 | 0.003 |
| J054629.0+000239 | N2068/2071 | 275 | 5:46:29.01 | +00:02:39.2 | 0.043 | 0.035 | 0.028 | 0.343 | 0.057 | N | 0.00 | -1 | -1 | 0.008 |
| J054645.1+005127 | N2068/2071 | 276 | 5:46:45.19 | +00:51:27.1 | 0.043 | 0.120 | 0.057 | 0.325 | 0.517 | N | 0.00 | -1 | -1 | 0.012 |
| J054754.7+001633 | N2068/2071 | 277 | 5:47:54.80 | +00:16:33.1 | 0.043 | 0.068 | 0.039 | 0.334 | 0.220 | N | 0.00 | -1 | -1 | 0.010 |
| J054756.8+004200 | N2068/2071 | 278 | 5:47:56.80 | +00:42:00.1 | 0.042 | 0.045 | 0.036 | 0.302 | 0.219 | N | 0.00 | -1 | -1 | -0.003 |
| J054704.2+000500 | N2068/2071 | 279 | 5:47:04.20 | +00:05:00.2 | 0.042 | 0.095 | 0.044 | 0.250 | 0.551 | N | 0.00 | -1 | -1 | 0.029 |
| J054749.6+003503 | N2068/2071 | 280 | 5:47:49.60 | +00:35:03.1 | 0.042 | 0.087 | 0.046 | 0.240 | 0.413 | N | 0.00 | -1 | -1 | 0.018 |
| J054553.4-000247 | N2068/2071 | 281 | 5:45:53.41 | -00:02:47.7 | 0.042 | 0.027 | 0.025 | 0.263 | 0.112 | N | 0.00 | -1 | -1 | 0.001 |
| J054701.5+003739 | N2068/2071 | 282 | 5:47:01.60 | +00:37:39.1 | 0.042 | 0.100 | 0.042 | 0.310 | 0.488 | N | 0.00 | -1 | -1 | 0.043 |
| J054735.5+004009 | N2068/2071 | 283 | 5:47:35.60 | +00:40:09.1 | 0.041 | 0.068 | 0.039 | 0.358 | 0.481 | N | 0.00 | -1 | -1 | 0.015 |
| J054810.8+003833 | N2068/2071 | 284 | 5:48:10.80 | +00:38:33.1 | 0.041 | 0.078 | 0.049 | 0.301 | 0.245 | N | 0.00 | -1 | -1 | -0.004 |
| J054824.3+001515 | N2068/2071 | 285 | 5:48:24.40 | +00:15:15.1 | 0.041 | 0.070 | 0.048 | 0.324 | 0.249 | N | 0.00 | -1 | -1 | 0.004 |
| J054630.6+000912 | N2068/2071 | 286 | 5:46:30.60 | +00:09:12.2 | 0.041 | 0.091 | 0.047 | 0.354 | 0.264 | N | 0.00 | -1 | -1 | 0.011 |
| J054641.9+002809 | N2068/2071 | 287 | 5:46:42.00 | +00:28:09.1 | 0.041 | 0.102 | 0.049 | 0.393 | 0.563 | N | 1.00 | 0.040 | 0.101 | 0.027 |
| J054756.8+004436 | N2068/2071 | 288 | 5:47:56.80 | +00:44:36.1 | 0.041 | 0.138 | 0.057 | 0.293 | 0.769 | N | 0.00 | -1 | -1 | 0.029 |
| J054631.4+000806 | N2068/2071 | 289 | 5:46:31.40 | +00:08:06.2 | 0.040 | 0.036 | 0.032 | 0.337 | 0.105 | N | 0.00 | -1 | -1 | 0.001 |
| J054710.5+004154 | N2068/2071 | 290 | 5:47:10.60 | +00:41:54.1 | 0.040 | 0.071 | 0.043 | 0.329 | 0.454 | N | 0.00 | -1 | -1 | 0.004 |
| J054731.8+002230 | N2068/2071 | 291 | 5:47:31.80 | +00:22:30.1 | 0.040 | 0.082 | 0.049 | 0.320 | 0.366 | N | 0.47 | 0.035 | 0.057 | 0.004 |
| J054752.8+005215 | N2068/2071 | 292 | 5:47:52.80 | +00:52:15.1 | 0.040 | 0.037 | 0.032 | 0.272 | 0.115 | N | 0.00 | -1 | -1 | 0.010 |
| J054653.5+004739 | N2068/2071 | 293 | 5:46:53.60 | +00:47:39.1 | 0.040 | 0.157 | 0.067 | 0.269 | 0.825 | N | 0.00 | -1 | -1 | 0.004 |
| J054643.0+001354 | N2068/2071 | 294 | 5:46:43.00 | +00:13:54.1 | 0.040 | 0.062 | 0.039 | 0.300 | 0.224 | N | 0.00 | -1 | -1 | 0.001 |
| J054731.0+000915 | N2068/2071 | 295 | 5:47:31.00 | +00:09:15.2 | 0.040 | 0.106 | 0.056 | 0.352 | 0.424 | N | 0.00 | -1 | -1 | -0.005 |
| J054606.0-000350 | N2068/2071 | 296 | 5:46:06.01 | -00:03:50.7 | 0.040 | 0.043 | 0.036 | 0.391 | 0.358 | N | 0.00 | -1 | -1 | 0.010 |
| J054650.2+000403 | N2068/2071 | 297 | 5:46:50.20 | +00:04:03.2 | 0.040 | 0.064 | 0.036 | 0.360 | 0.278 | N | 0.00 | -1 | -1 | 0.013 |
| J054705.8+000724 | N2068/2071 | 298 | 5:47:05.80 | +00:07:24.2 | 0.039 | 0.045 | 0.034 | 0.249 | 0.151 | N | 0.00 | -1 | -1 | 0.004 |
| J054716.4+000300 | N2068/2071 | 299 | 5:47:16.40 | +00:03:00.2 | 0.039 | 0.044 | 0.040 | 0.266 | 0.239 | N | 0.00 | -1 | -1 | -0.001 |
| J054813.8+004227 | N2068/2071 | 300 | 5:48:13.80 | +00:42:27.1 | 0.039 | 0.037 | 0.031 | 0.285 | 0.148 | N | 0.00 | -1 | -1 | 0.003 |
| J054721.0+002518 | N2068/2071 | 301 | 5:47:21.00 | +00:25:18.1 | 0.039 | 0.034 | 0.034 | 0.315 | 0.205 | N | 0.00 | -1 | -1 | 0.006 |
| J054640.0+000833 | N2068/2071 | 302 | 5:46:40.00 | +00:08:33.2 | 0.039 | 0.091 | 0.046 | 0.379 | 0.554 | N | 0.00 | -1 | -1 | 0.015 |
| J054637.2+000951 | N2068/2071 | 303 | 5:46:37.20 | +00:09:51.2 | 0.039 | 0.055 | 0.039 | 0.308 | 0.369 | N | 0.00 | -1 | -1 | 0.000 |
| J054620.0-001532 | N2068/2071 | 304 | 5:46:20.01 | -00:15:32.5 | 0.039 | 0.070 | 0.042 | 0.420 | 0.364 | N | 0.00 | -1 | -1 | 0.004 |
| J054738.5+002109 | N2068/2071 | 305 | 5:47:38.60 | +00:21:09.1 | 0.038 | 0.034 | 0.028 | 0.295 | 0.159 | N | 1.00 | 0.034 | 0.023 | 0.001 |
| J054757.6+003445 | N2068/2071 | 306 | 5:47:57.60 | +00:34:45.1 | 0.038 | 0.019 | 0.023 | 0.206 | 0.128 | N | 0.00 | -1 | -1 | 0.003 |
| J054800.6+004218 | N2068/2071 | 307 | 5:48:00.60 | +00:42:18.1 | 0.038 | 0.176 | 0.072 | 0.397 | 0.880 | N | 0.00 | -1 | -1 | 0.032 |
| J054540.7+002718 | N2068/2071 | 308 | 5:45:40.80 | +00:27:18.1 | 0.038 | 0.043 | 0.033 | 0.501 | 0.246 | N | 0.00 | -1 | -1 | 0.009 |
| J054611.2-001529 | N2068/2071 | 309 | 5:46:11.21 | -00:15:29.5 | 0.037 | 0.044 | 0.035 | 0.371 | 0.281 | N | 0.00 | -1 | -1 | 0.010 |
| J054541.1+003342 | N2068/2071 | 310 | 5:45:41.20 | +00:33:42.0 | 0.037 | 0.048 | 0.036 | 0.623 | 0.058 | N | 0.00 | -1 | -1 | 0.002 |
| J054639.6+001033 | N2068/2071 | 311 | 5:46:39.60 | +00:10:33.2 | 0.037 | 0.101 | 0.054 | 0.338 | 0.335 | N | 0.00 | -1 | -1 | 0.007 |
| J054623.0+001012 | N2068/2071 | 312 | 5:46:23.00 | +00:10:12.2 | 0.036 | 0.156 | 0.066 | 0.364 | 0.436 | N | 0.00 | -1 | -1 | -0.001 |
| J054541.5+003436 | N2068/2071 | 313 | 5:45:41.60 | +00:34:36.0 | 0.036 | 0.057 | 0.038 | 0.512 | 0.253 | N | 0.00 | -1 | -1 | -0.004 |
| J054650.5+003730 | N2068/2071 | 314 | 5:46:50.60 | +00:37:30.1 | 0.036 | 0.053 | 0.038 | 0.225 | 0.268 | N | 0.00 | -1 | -1 | 0.001 |
| J054644.4+001051 | N2068/2071 | 315 | 5:46:44.40 | +00:10:51.2 | 0.036 | 0.046 | 0.033 | 0.281 | 0.142 | N | 0.00 | -1 | -1 | 0.010 |
| J054708.9+004000 | N2068/2071 | 316 | 5:47:09.00 | +00:40:00.1 | 0.035 | 0.032 | 0.030 | 0.229 | 0.128 | N | 0.00 | -1 | -1 | 0.001 |
| J054721.9-000011 | N2068/2071 | 317 | 5:47:22.00 | -00:00:11.7 | 0.035 | 0.057 | 0.041 | 0.240 | 0.229 | N | 0.00 | -1 | -1 | 0.002 |
| J054645.4+002148 | N2068/2071 | 318 | 5:46:45.40 | +00:21:48.1 | 0.035 | 0.101 | 0.056 | 0.486 | 0.466 | N | 1.00 | 0.036 | 0.104 | 0.004 |
| J054643.2+001633 | N2068/2071 | 319 | 5:46:43.20 | +00:16:33.1 | 0.035 | 0.085 | 0.055 | 0.505 | 0.246 | N | 1.00 | 0.036 | 0.069 | -0.004 |
| J054748.2+002712 | N2068/2071 | 320 | 5:47:48.20 | +00:27:12.1 | 0.034 | 0.053 | 0.041 | 0.307 | 0.136 | N | 0.00 | -1 | -1 | -0.003 |
| J054655.8+000548 | N2068/2071 | 321 | 5:46:55.80 | +00:05:48.2 | 0.033 | 0.038 | 0.031 | 0.279 | 0.076 | N | 0.00 | -1 | -1 | -0.000 |
| J054751.6+002957 | N2068/2071 | 322 | 5:47:51.60 | +00:29:57.1 | 0.031 | 0.076 | 0.047 | 0.302 | 0.309 | N | 0.00 | -1 | -1 | -0.004 |
| J054144.5-015542 | N2023/2024 | 1 | 5:41:44.52 | -01:55:42.3 | 11.411 | 119.522 | 0.243 | 40.454 | 1116.167 | Y | 1.00 | 11.363 | 117.244 | 103.124 |
| J054143.1-015424 | N2023/2024 | 2 | 5:41:43.11 | -01:54:24.3 | 9.003 | 69.367 | 0.163 | 44.982 | 668.055 | Y | 1.00 | 9.003 | 69.169 | 53.174 |
| J054145.3-015603 | N2023/2024 | 3 | 5:41:45.32 | -01:56:03.3 | 7.782 | 62.851 | 0.180 | 31.886 | 637.744 | Y | 1.00 | 7.713 | 61.004 | 58.741 |
| J054144.3-015445 | N2023/2024 | 4 | 5:41:44.31 | -01:54:45.3 | 6.177 | 36.634 | 0.108 | 32.889 | 325.548 | Y | 1.00 | 6.144 | 36.347 | 17.159 |
| J054125.1-021806 | N2023/2024 | 5 | 5:41:25.11 | -02:18:06.3 | 2.743 | 6.701 | 0.090 | 9.067 | 43.467 | Y | 0.00 | -1 | -1 | 6.105 |
| J054137.3-021718 | N2023/2024 | 6 | 5:41:37.31 | -02:17:18.3 | 1.396 | 10.207 | 0.130 | 3.846 | 77.904 | Y | 0.00 | -1 | -1 | 7.934 |
| J054245.3-011612 | N2023/2024 | 7 | 5:42:45.31 | -01:16:12.6 | 1.313 | 2.999 | 0.102 | 3.146 | 14.129 | Y | 0.00 | -1 | -1 | 2.626 |
| J054126.5-021818 | N2023/2024 | 8 | 5:41:26.51 | -02:18:18.3 | 1.150 | 5.675 | 0.091 | 4.874 | 43.424 | Y | 0.00 | -1 | -1 | 3.378 |
| J054203.1-020236 | N2023/2024 | 9 | 5:42:03.13 | -02:02:36.3 | 0.868 | 3.702 | 0.105 | 3.633 | 32.296 | N | 1.00 | 0.866 | 3.682 | 3.192 |
| J054129.7-022118 | N2023/2024 | 10 | 5:41:29.71 | -02:21:18.3 | 0.862 | 4.307 | 0.104 | 3.254 | 29.660 | Y | 0.00 | -1 | -1 | 2.967 |
| J054140.5-021703 | N2023/2024 | 11 | 5:41:40.52 | -02:17:03.3 | 0.842 | 11.120 | 0.115 | 3.474 | 89.741 | N | 0.00 | -1 | -1 | 3.612 |
| J054227.9-012000 | N2023/2024 | 12 | 5:42:27.91 | -01:20:00.6 | 0.833 | 3.135 | 0.105 | 3.004 | 17.754 | Y | 0.00 | -1 | -1 | 2.692 |
| J054202.7-020745 | N2023/2024 | 13 | 5:42:02.73 | -02:07:45.3 | 0.819 | 2.918 | 0.106 | 2.970 | 20.203 | Y | 0.00 | -1 | -1 | 2.499 |
| J054149.7-015742 | N2023/2024 | 14 | 5:41:49.72 | -01:57:42.3 | 0.812 | 11.758 | 0.128 | 4.468 | 135.584 | Y | 1.00 | 0.817 | 11.899 | 10.015 |
| J054351.4-010251 | N2023/2024 | 15 | 5:43:51.48 | -01:02:51.8 | 0.779 | 1.805 | 0.088 | 3.620 | 10.371 | N | 0.00 | -1 | -1 | 1.510 |
| J054144.1-015254 | N2023/2024 | 16 | 5:41:44.11 | -01:52:54.3 | 0.726 | 10.033 | 0.126 | 3.540 | 97.943 | Y | 1.00 | 0.735 | 9.411 | 8.880 |
| J054113.0-014748 | N2023/2024 | 17 | 5:41:13.10 | -01:47:48.3 | 0.593 | 5.342 | 0.114 | 2.604 | 47.424 | N | 1.00 | 0.586 | 5.202 | 4.138 |
| J054138.7-021745 | N2023/2024 | 18 | 5:41:38.72 | -02:17:45.3 | 0.547 | 3.903 | 0.082 | 2.100 | 31.512 | N | 0.00 | -1 | -1 | 3.189 |
| J054137.7-015551 | N2023/2024 | 19 | 5:41:37.71 | -01:55:51.3 | 0.523 | 4.558 | 0.067 | 2.499 | 41.948 | N | 1.00 | 0.488 | 4.242 | -0.266 |
| J054111.8-014809 | N2023/2024 | 20 | 5:41:11.90 | -01:48:09.3 | 0.502 | 2.916 | 0.101 | 2.251 | 26.531 | N | 1.00 | 0.501 | 2.875 | 2.352 |
| J054126.7-014451 | N2023/2024 | 21 | 5:41:26.70 | -01:44:51.4 | 0.499 | 3.436 | 0.090 | 2.251 | 27.172 | N | 1.00 | 0.493 | 3.285 | 1.967 |
| J054141.9-021615 | N2023/2024 | 22 | 5:41:41.92 | -02:16:15.3 | 0.489 | 6.878 | 0.127 | 2.089 | 50.897 | Y | 0.00 | -1 | -1 | 5.815 |
| J054125.7-021927 | N2023/2024 | 23 | 5:41:25.71 | -02:19:27.3 | 0.407 | 2.528 | 0.071 | 1.669 | 20.279 | N | 0.00 | -1 | -1 | 0.940 |
| J054136.7-014930 | N2023/2024 | 24 | 5:41:36.71 | -01:49:30.3 | 0.398 | 3.665 | 0.102 | 2.033 | 33.021 | N | 1.00 | 0.390 | 3.381 | 3.076 |
| J054128.7-022006 | N2023/2024 | 25 | 5:41:28.71 | -02:20:06.3 | 0.382 | 2.056 | 0.059 | 1.541 | 15.435 | N | 0.00 | -1 | -1 | 0.561 |
| J054144.1-021706 | N2023/2024 | 26 | 5:41:44.12 | -02:17:06.3 | 0.376 | 3.410 | 0.104 | 1.457 | 26.470 | N | 0.00 | -1 | -1 | 2.739 |
| J054125.5-021603 | N2023/2024 | 27 | 5:41:25.51 | -02:16:03.3 | 0.375 | 4.215 | 0.107 | 1.466 | 33.152 | Y | 0.00 | -1 | -1 | 3.285 |
| J054149.5-015939 | N2023/2024 | 28 | 5:41:49.52 | -01:59:39.3 | 0.372 | 1.826 | 0.067 | 1.855 | 19.966 | Y | 1.00 | 0.380 | 1.888 | 1.220 |
| J054231.1-012045 | N2023/2024 | 29 | 5:42:31.11 | -01:20:45.6 | 0.372 | 3.703 | 0.131 | 1.081 | 21.888 | N | 0.00 | -1 | -1 | 3.006 |
| J054126.3-021615 | N2023/2024 | 30 | 5:41:26.31 | -02:16:15.3 | 0.364 | 1.661 | 0.064 | 1.489 | 13.349 | N | 0.00 | -1 | -1 | 0.829 |
| J054107.0-022724 | N2023/2024 | 31 | 5:41:07.09 | -02:27:24.3 | 0.362 | 3.043 | 0.122 | 1.190 | 20.146 | N | 0.00 | -1 | -1 | 2.575 |
| J054058.6-020839 | N2023/2024 | 32 | 5:40:58.69 | -02:08:39.3 | 0.352 | 4.587 | 0.122 | 1.156 | 30.162 | N | 0.00 | -1 | -1 | 3.659 |
| J054125.1-021721 | N2023/2024 | 33 | 5:41:25.11 | -02:17:21.3 | 0.341 | 3.496 | 0.093 | 1.352 | 26.072 | Y | 0.00 | -1 | -1 | 1.897 |
| J054130.3-022012 | N2023/2024 | 34 | 5:41:30.31 | -02:20:12.3 | 0.341 | 1.418 | 0.053 | 1.328 | 11.356 | N | 0.00 | -1 | -1 | 0.369 |
| J054139.7-013554 | N2023/2024 | 35 | 5:41:39.71 | -01:35:54.4 | 0.311 | 2.546 | 0.094 | 1.379 | 20.428 | N | 0.00 | -1 | -1 | 2.058 |
| J054124.3-014436 | N2023/2024 | 36 | 5:41:24.30 | -01:44:36.4 | 0.303 | 1.554 | 0.067 | 1.290 | 12.991 | N | 1.00 | 0.289 | 1.461 | 0.726 |
| J054138.1-015100 | N2023/2024 | 37 | 5:41:38.11 | -01:51:00.3 | 0.303 | 2.578 | 0.077 | 1.388 | 25.264 | N | 1.00 | 0.301 | 2.633 | 1.611 |
| J054113.8-014703 | N2023/2024 | 38 | 5:41:13.90 | -01:47:03.4 | 0.303 | 0.902 | 0.046 | 1.521 | 8.291 | Y | 1.00 | 0.303 | 0.906 | 0.108 |
| J054122.5-014254 | N2023/2024 | 39 | 5:41:22.50 | -01:42:54.4 | 0.302 | 2.818 | 0.113 | 1.405 | 24.838 | N | 0.71 | 0.296 | 2.495 | 2.119 |
| J054135.3-015127 | N2023/2024 | 40 | 5:41:35.31 | -01:51:27.3 | 0.286 | 2.694 | 0.099 | 1.349 | 24.780 | N | 1.00 | 0.282 | 2.603 | 2.239 |
| J054124.1-015048 | N2023/2024 | 41 | 5:41:24.10 | -01:50:48.3 | 0.282 | 2.246 | 0.102 | 1.262 | 14.528 | N | 1.00 | 0.281 | 2.001 | 1.719 |
| J054133.3-014951 | N2023/2024 | 42 | 5:41:33.31 | -01:49:51.3 | 0.278 | 2.302 | 0.088 | 1.193 | 20.316 | N | 1.00 | 0.255 | 2.084 | 1.848 |
| J054138.5-015033 | N2023/2024 | 43 | 5:41:38.51 | -01:50:33.3 | 0.269 | 1.620 | 0.066 | 1.190 | 14.225 | N | 1.00 | 0.257 | 1.558 | 1.039 |
| J054053.6-022703 | N2023/2024 | 44 | 5:40:53.68 | -02:27:03.3 | 0.259 | 2.166 | 0.095 | 0.893 | 13.455 | Y | 0.00 | -1 | -1 | 1.736 |
| J054136.3-013745 | N2023/2024 | 45 | 5:41:36.31 | -01:37:45.4 | 0.256 | 0.752 | 0.068 | 1.168 | 6.159 | N | 0.00 | -1 | -1 | 0.559 |
| J054112.0-014630 | N2023/2024 | 46 | 5:41:12.10 | -01:46:30.4 | 0.253 | 2.830 | 0.106 | 1.265 | 24.906 | N | 1.00 | 0.259 | 2.754 | 1.994 |
| J054130.9-021903 | N2023/2024 | 47 | 5:41:30.91 | -02:19:03.3 | 0.250 | 1.997 | 0.075 | 0.850 | 13.890 | N | 0.00 | -1 | -1 | 0.872 |
| J054055.0-022751 | N2023/2024 | 48 | 5:40:55.08 | -02:27:51.3 | 0.250 | 3.201 | 0.119 | 0.852 | 21.077 | N | 0.00 | -1 | -1 | 2.465 |
| J054129.5-022318 | N2023/2024 | 49 | 5:41:29.51 | -02:23:18.3 | 0.245 | 0.840 | 0.066 | 0.897 | 5.614 | Y | 0.00 | -1 | -1 | 0.568 |
| J054153.5-020021 | N2023/2024 | 50 | 5:41:53.52 | -02:00:21.3 | 0.244 | 2.438 | 0.089 | 1.269 | 25.334 | N | 1.00 | 0.251 | 2.534 | 1.891 |
| J054121.5-014203 | N2023/2024 | 51 | 5:41:21.50 | -01:42:03.4 | 0.242 | 0.972 | 0.061 | 1.179 | 8.473 | N | 0.22 | 0.242 | 0.911 | 0.639 |
| J054100.2-020909 | N2023/2024 | 52 | 5:41:00.29 | -02:09:09.3 | 0.242 | 2.996 | 0.115 | 0.835 | 18.942 | N | 0.00 | -1 | -1 | 2.261 |
| J054322.9-011351 | N2023/2024 | 53 | 5:43:22.90 | -01:13:51.6 | 0.233 | 0.869 | 0.071 | 0.660 | 4.324 | N | 0.00 | -1 | -1 | 0.668 |
| J054138.5-013621 | N2023/2024 | 54 | 5:41:38.51 | -01:36:21.4 | 0.227 | 1.214 | 0.074 | 1.093 | 10.799 | N | 0.00 | -1 | -1 | 0.871 |
| J054133.5-022054 | N2023/2024 | 55 | 5:41:33.51 | -02:20:54.3 | 0.227 | 0.718 | 0.062 | 0.889 | 5.329 | N | 0.00 | -1 | -1 | 0.456 |
| J054128.1-022057 | N2023/2024 | 56 | 5:41:28.11 | -02:20:57.3 | 0.226 | 1.677 | 0.072 | 0.906 | 12.307 | N | 0.00 | -1 | -1 | 0.558 |
| J054058.4-020727 | N2023/2024 | 57 | 5:40:58.49 | -02:07:27.3 | 0.226 | 1.178 | 0.077 | 0.739 | 7.499 | N | 0.00 | -1 | -1 | 0.876 |
| J054304.3-011548 | N2023/2024 | 58 | 5:43:04.31 | -01:15:48.6 | 0.213 | 0.833 | 0.064 | 0.544 | 3.437 | Y | 0.00 | -1 | -1 | 0.548 |
| J054109.2-014539 | N2023/2024 | 59 | 5:41:09.30 | -01:45:39.4 | 0.213 | 1.128 | 0.077 | 0.901 | 8.944 | N | 0.69 | 0.202 | 0.927 | 0.642 |
| J054123.1-014339 | N2023/2024 | 60 | 5:41:23.10 | -01:43:39.4 | 0.212 | 0.760 | 0.051 | 0.942 | 7.070 | N | 1.00 | 0.206 | 0.720 | 0.201 |
| J054127.5-022354 | N2023/2024 | 61 | 5:41:27.51 | -02:23:54.3 | 0.205 | 1.852 | 0.092 | 0.779 | 14.581 | N | 0.00 | -1 | -1 | 1.397 |
| J054305.3-011845 | N2023/2024 | 62 | 5:43:05.31 | -01:18:45.5 | 0.198 | 2.708 | 0.136 | 0.596 | 14.580 | N | 0.00 | -1 | -1 | 2.043 |
| J054210.9-020418 | N2023/2024 | 63 | 5:42:10.94 | -02:04:18.2 | 0.186 | 0.631 | 0.068 | 0.822 | 5.276 | N | 0.40 | 0.186 | 0.581 | 0.404 |
| J054122.9-014521 | N2023/2024 | 64 | 5:41:22.90 | -01:45:21.4 | 0.185 | 1.117 | 0.067 | 0.795 | 9.345 | N | 1.00 | 0.176 | 1.056 | 0.585 |
| J054127.5-014800 | N2023/2024 | 65 | 5:41:27.50 | -01:48:00.3 | 0.177 | 0.641 | 0.062 | 0.855 | 6.183 | N | 1.00 | 0.175 | 0.652 | 0.410 |
| J054233.1-012536 | N2023/2024 | 66 | 5:42:33.11 | -01:25:36.5 | 0.172 | 1.008 | 0.089 | 0.822 | 6.699 | N | 0.00 | -1 | -1 | 0.744 |
| J054156.9-020054 | N2023/2024 | 67 | 5:41:56.92 | -02:00:54.3 | 0.170 | 0.892 | 0.077 | 0.890 | 8.805 | N | 1.00 | 0.178 | 0.926 | 0.584 |
| J054150.3-020021 | N2023/2024 | 68 | 5:41:50.32 | -02:00:21.3 | 0.166 | 0.398 | 0.040 | 0.898 | 3.943 | N | 1.00 | 0.164 | 0.396 | 0.221 |
| J054204.3-020142 | N2023/2024 | 69 | 5:42:04.33 | -02:01:42.3 | 0.161 | 0.983 | 0.083 | 0.751 | 8.748 | N | 1.00 | 0.162 | 0.972 | 0.630 |
| J054119.9-014224 | N2023/2024 | 70 | 5:41:19.90 | -01:42:24.4 | 0.159 | 0.468 | 0.052 | 0.808 | 4.113 | N | 0.42 | 0.159 | 0.403 | 0.255 |
| J054124.3-022857 | N2023/2024 | 71 | 5:41:24.31 | -02:28:57.3 | 0.158 | 0.648 | 0.073 | 0.675 | 4.609 | N | 0.00 | -1 | -1 | 0.414 |
| J054135.9-023000 | N2023/2024 | 72 | 5:41:35.92 | -02:30:00.3 | 0.156 | 1.594 | 0.106 | 0.678 | 8.588 | N | 0.00 | -1 | -1 | 1.120 |
| J054109.8-015803 | N2023/2024 | 73 | 5:41:09.89 | -01:58:03.3 | 0.154 | 0.902 | 0.072 | 0.691 | 6.623 | N | 0.00 | -1 | -1 | 0.579 |
| J054112.4-014400 | N2023/2024 | 74 | 5:41:12.50 | -01:44:00.4 | 0.149 | 0.986 | 0.088 | 0.594 | 7.165 | N | 0.62 | 0.149 | 0.773 | 0.678 |
| J054127.9-014827 | N2023/2024 | 75 | 5:41:27.91 | -01:48:27.3 | 0.148 | 0.449 | 0.057 | 0.760 | 4.122 | N | 1.00 | 0.150 | 0.451 | 0.287 |
| J054129.5-014518 | N2023/2024 | 76 | 5:41:29.51 | -01:45:18.4 | 0.147 | 0.809 | 0.069 | 0.626 | 6.043 | N | 1.00 | 0.145 | 0.787 | 0.531 |
| J054303.1-011630 | N2023/2024 | 77 | 5:43:03.11 | -01:16:30.6 | 0.144 | 0.561 | 0.069 | 0.431 | 2.408 | Y | 0.00 | -1 | -1 | 0.338 |
| J054131.9-022500 | N2023/2024 | 78 | 5:41:31.91 | -02:25:00.3 | 0.143 | 1.576 | 0.103 | 0.667 | 11.793 | N | 0.00 | -1 | -1 | 1.127 |
| J054131.7-022615 | N2023/2024 | 79 | 5:41:31.71 | -02:26:15.3 | 0.141 | 1.521 | 0.098 | 0.558 | 10.544 | N | 0.00 | -1 | -1 | 1.057 |
| J054138.3-013500 | N2023/2024 | 80 | 5:41:38.31 | -01:35:00.4 | 0.140 | 0.283 | 0.040 | 0.672 | 2.004 | N | 0.00 | -1 | -1 | 0.155 |
| J054346.4-010442 | N2023/2024 | 81 | 5:43:46.49 | -01:04:42.8 | 0.138 | 0.417 | 0.075 | 0.502 | 1.879 | Y | 0.00 | -1 | -1 | 0.236 |
| J054132.1-015427 | N2023/2024 | 82 | 5:41:32.11 | -01:54:27.3 | 0.136 | 0.469 | 0.059 | 0.619 | 2.775 | Y | 1.00 | 0.135 | 0.447 | 0.276 |
| J054126.1-014715 | N2023/2024 | 83 | 5:41:26.10 | -01:47:15.4 | 0.135 | 0.335 | 0.049 | 0.705 | 3.509 | N | 1.00 | 0.141 | 0.389 | 0.203 |
| J054151.5-015330 | N2023/2024 | 84 | 5:41:51.52 | -01:53:30.3 | 0.134 | 0.280 | 0.041 | 0.919 | 3.042 | N | 1.00 | 0.140 | 0.299 | 0.150 |
| J054136.5-015733 | N2023/2024 | 85 | 5:41:36.51 | -01:57:33.3 | 0.131 | 0.747 | 0.082 | 0.705 | 5.653 | N | 1.00 | 0.133 | 0.654 | 0.473 |
| J054143.1-013400 | N2023/2024 | 86 | 5:41:43.11 | -01:34:00.4 | 0.128 | 0.329 | 0.052 | 0.613 | 2.746 | N | 0.00 | -1 | -1 | 0.199 |
| J054120.5-014551 | N2023/2024 | 87 | 5:41:20.50 | -01:45:51.4 | 0.123 | 0.664 | 0.070 | 0.524 | 5.489 | N | 1.00 | 0.119 | 0.644 | 0.352 |
| J054130.5-015709 | N2023/2024 | 88 | 5:41:30.51 | -01:57:09.3 | 0.122 | 0.740 | 0.073 | 0.630 | 6.596 | N | 1.00 | 0.121 | 0.718 | 0.449 |
| J054116.6-015109 | N2023/2024 | 89 | 5:41:16.70 | -01:51:09.3 | 0.118 | 0.882 | 0.085 | 0.612 | 5.336 | N | 1.00 | 0.109 | 0.763 | 0.520 |
| J054203.7-020421 | N2023/2024 | 90 | 5:42:03.73 | -02:04:21.3 | 0.118 | 0.877 | 0.087 | 0.546 | 6.715 | N | 1.00 | 0.116 | 0.793 | 0.604 |
| J054103.6-015606 | N2023/2024 | 91 | 5:41:03.69 | -01:56:06.3 | 0.117 | 0.419 | 0.056 | 0.639 | 3.791 | N | 0.00 | -1 | -1 | 0.253 |
| J054104.8-015603 | N2023/2024 | 92 | 5:41:04.89 | -01:56:03.3 | 0.116 | 0.387 | 0.066 | 0.595 | 3.136 | N | 0.00 | -1 | -1 | 0.208 |
| J054305.9-011509 | N2023/2024 | 93 | 5:43:05.91 | -01:15:09.6 | 0.115 | 0.734 | 0.079 | 0.410 | 3.258 | N | 0.00 | -1 | -1 | 0.483 |
| J054107.2-015830 | N2023/2024 | 94 | 5:41:07.29 | -01:58:30.3 | 0.111 | 0.435 | 0.064 | 0.519 | 3.342 | N | 0.00 | -1 | -1 | 0.207 |
| J054059.4-015351 | N2023/2024 | 95 | 5:40:59.49 | -01:53:51.3 | 0.110 | 0.135 | 0.035 | 0.435 | 0.577 | N | 0.00 | -1 | -1 | 0.039 |
| J054106.0-021918 | N2023/2024 | 96 | 5:41:06.09 | -02:19:18.3 | 0.108 | 0.554 | 0.081 | 0.491 | 3.036 | N | 0.00 | -1 | -1 | 0.353 |
| J054146.7-013800 | N2023/2024 | 97 | 5:41:46.71 | -01:38:00.4 | 0.106 | 1.444 | 0.122 | 0.656 | 12.910 | N | 0.00 | -1 | -1 | 0.899 |
| J054150.7-014457 | N2023/2024 | 98 | 5:41:50.71 | -01:44:57.3 | 0.105 | 0.956 | 0.095 | 0.475 | 5.304 | N | 0.00 | -1 | -1 | 0.645 |
| J054328.1-020950 | N2023/2024 | 99 | 5:43:28.19 | -02:09:50.9 | 0.105 | 0.079 | 0.033 | 0.667 | 0.509 | N | 0.00 | -1 | -1 | -0.005 |
| J054055.4-015312 | N2023/2024 | 100 | 5:40:55.49 | -01:53:12.3 | 0.104 | 0.713 | 0.086 | 0.472 | 4.408 | N | 0.00 | -1 | -1 | 0.455 |
| J054425.7-012727 | N2023/2024 | 101 | 5:44:25.73 | -01:27:27.0 | 0.104 | 0.149 | 0.040 | 0.821 | 0.751 | N | 0.00 | -1 | -1 | 0.066 |
| J054107.4-015100 | N2023/2024 | 102 | 5:41:07.49 | -01:51:00.3 | 0.104 | 0.648 | 0.077 | 0.481 | 2.767 | N | 1.00 | 0.092 | 0.508 | 0.431 |
| J054136.1-022121 | N2023/2024 | 103 | 5:41:36.12 | -02:21:21.3 | 0.103 | 0.188 | 0.042 | 0.366 | 1.341 | N | 0.00 | -1 | -1 | 0.113 |
| J054154.7-020803 | N2023/2024 | 104 | 5:41:54.73 | -02:08:03.3 | 0.101 | 1.267 | 0.101 | 0.538 | 9.588 | N | 0.00 | -1 | -1 | 0.876 |
| J054101.4-015336 | N2023/2024 | 105 | 5:41:01.49 | -01:53:36.3 | 0.101 | 0.295 | 0.056 | 0.440 | 1.593 | N | 0.35 | 0.101 | 0.231 | 0.150 |
| J054156.7-014248 | N2023/2024 | 106 | 5:41:56.72 | -01:42:48.4 | 0.101 | 1.299 | 0.116 | 0.553 | 10.836 | N | 0.00 | -1 | -1 | 0.802 |
| J054116.6-021518 | N2023/2024 | 107 | 5:41:16.70 | -02:15:18.3 | 0.101 | 1.008 | 0.104 | 0.465 | 7.398 | N | 0.00 | -1 | -1 | 0.562 |
| J054319.7-011551 | N2023/2024 | 108 | 5:43:19.71 | -01:15:51.5 | 0.101 | 0.464 | 0.072 | 0.411 | 1.725 | N | 0.00 | -1 | -1 | 0.296 |
| J054152.3-013233 | N2023/2024 | 109 | 5:41:52.31 | -01:32:33.4 | 0.100 | 0.514 | 0.073 | 0.633 | 4.344 | N | 0.00 | -1 | -1 | 0.340 |
| J054115.2-015751 | N2023/2024 | 110 | 5:41:15.30 | -01:57:51.3 | 0.100 | 0.358 | 0.053 | 0.428 | 2.601 | N | 0.00 | -1 | -1 | 0.199 |
| J054425.7-012715 | N2023/2024 | 111 | 5:44:25.73 | -01:27:15.0 | 0.100 | 0.073 | 0.032 | 0.657 | 0.164 | N | 0.00 | -1 | -1 | -0.007 |
| J054224.9-020609 | N2023/2024 | 112 | 5:42:24.95 | -02:06:09.2 | 0.098 | 0.287 | 0.069 | 0.457 | 2.032 | N | 0.00 | -1 | -1 | 0.094 |
| J054143.7-015106 | N2023/2024 | 113 | 5:41:43.71 | -01:51:06.3 | 0.098 | 0.338 | 0.058 | 0.587 | 3.362 | N | 1.00 | 0.102 | 0.356 | 0.166 |
| J054112.6-015812 | N2023/2024 | 114 | 5:41:12.70 | -01:58:12.3 | 0.096 | 0.300 | 0.044 | 0.415 | 1.555 | Y | 0.00 | -1 | -1 | 0.112 |
| J054305.1-011712 | N2023/2024 | 115 | 5:43:05.11 | -01:17:12.5 | 0.096 | 0.434 | 0.065 | 0.450 | 2.085 | N | 0.00 | -1 | -1 | 0.260 |
| J054247.7-020845 | N2023/2024 | 116 | 5:42:47.76 | -02:08:45.1 | 0.095 | 0.538 | 0.073 | 0.662 | 4.508 | N | 0.00 | -1 | -1 | 0.325 |
| J054105.6-014503 | N2023/2024 | 117 | 5:41:05.69 | -01:45:03.4 | 0.095 | 0.729 | 0.091 | 0.524 | 4.321 | N | 0.09 | 0.095 | 0.687 | 0.372 |
| J054215.9-013321 | N2023/2024 | 118 | 5:42:15.92 | -01:33:21.4 | 0.095 | 0.427 | 0.072 | 0.596 | 3.740 | N | 0.00 | -1 | -1 | 0.240 |
| J054122.7-015806 | N2023/2024 | 119 | 5:41:22.70 | -01:58:06.3 | 0.094 | 0.440 | 0.074 | 0.473 | 3.502 | N | 0.91 | 0.083 | 0.304 | 0.201 |
| J054146.5-021918 | N2023/2024 | 120 | 5:41:46.52 | -02:19:18.3 | 0.093 | 0.231 | 0.055 | 0.311 | 1.466 | N | 0.00 | -1 | -1 | 0.079 |
| J054212.3-020206 | N2023/2024 | 121 | 5:42:12.33 | -02:02:06.2 | 0.093 | 0.421 | 0.069 | 0.537 | 3.140 | N | 1.00 | 0.089 | 0.395 | 0.225 |
| J054122.3-015333 | N2023/2024 | 122 | 5:41:22.30 | -01:53:33.3 | 0.093 | 0.329 | 0.057 | 0.264 | 0.844 | N | 1.00 | 0.058 | 0.139 | 0.176 |
| J054119.7-022115 | N3/2024 | 123 | 5:41:19.70 | -02:21:15.3 | 0.093 | 0.683 | 0.079 | 0.406 | 3.721 | N | 0.00 | -1 | -1 | 0.399 |
| J054238.3-020412 | N2023/2024 | 124 | 5:42:38.35 | -02:04:12.2 | 0.092 | 0.348 | 0.059 | 0.512 | 2.658 | N | 0.00 | -1 | -1 | 0.154 |
| J054129.5-021703 | N2023/2024 | 125 | 5:41:29.51 | -02:17:03.3 | 0.092 | 0.529 | 0.069 | 0.589 | 4.788 | N | 0.00 | -1 | -1 | 0.278 |
| J054119.5-014521 | N2023/2024 | 126 | 5:41:19.50 | -01:45:21.4 | 0.091 | 0.228 | 0.039 | 0.483 | 1.972 | N | 1.00 | 0.089 | 0.217 | 0.055 |
| J054133.5-022700 | N2023/2024 | 127 | 5:41:33.52 | -02:27:00.3 | 0.091 | 0.308 | 0.063 | 0.363 | 1.903 | N | 0.00 | -1 | -1 | 0.120 |
| J054326.3-020947 | N2023/2024 | 128 | 5:43:26.39 | -02:09:48.0 | 0.090 | 0.161 | 0.044 | 0.697 | 1.177 | N | 0.00 | -1 | -1 | 0.051 |
| J054131.7-022300 | N2023/2024 | 129 | 5:41:31.71 | -02:23:00.3 | 0.090 | 0.202 | 0.043 | 0.434 | 1.610 | N | 0.00 | -1 | -1 | 0.100 |
| J054126.1-015209 | N2023/2024 | 130 | 5:41:26.10 | -01:52:09.3 | 0.089 | 0.576 | 0.074 | 0.399 | 2.543 | N | 1.00 | 0.084 | 0.450 | 0.341 |
| J054317.9-011833 | N2023/2024 | 131 | 5:43:17.91 | -01:18:33.5 | 0.087 | 0.486 | 0.080 | 0.415 | 2.742 | N | 0.00 | -1 | -1 | 0.262 |
| J054103.4-015157 | N2023/2024 | 132 | 5:41:03.49 | -01:51:57.3 | 0.086 | 0.441 | 0.070 | 0.348 | 1.056 | N | 1.00 | 0.081 | 0.277 | 0.237 |
| J054129.9-021157 | N2023/2024 | 133 | 5:41:29.91 | -02:11:57.3 | 0.086 | 0.711 | 0.089 | 0.453 | 5.522 | N | 0.00 | -1 | -1 | 0.415 |
| J054132.3-022742 | N2023/2024 | 134 | 5:41:32.31 | -02:27:42.3 | 0.086 | 0.353 | 0.066 | 0.359 | 2.479 | N | 0.00 | -1 | -1 | 0.171 |
| J054254.3-013627 | N2023/2024 | 135 | 5:42:54.33 | -01:36:27.3 | 0.084 | 0.210 | 0.061 | 0.485 | 1.058 | N | 0.00 | -1 | -1 | 0.086 |
| J054312.9-021051 | N2023/2024 | 136 | 5:43:12.98 | -02:10:51.0 | 0.084 | 0.181 | 0.047 | 0.657 | 1.009 | N | 0.00 | -1 | -1 | 0.073 |
| J054313.3-015851 | N2023/2024 | 137 | 5:43:13.37 | -01:58:51.1 | 0.084 | 0.268 | 0.064 | 0.540 | 2.152 | N | 0.00 | -1 | -1 | 0.146 |
| J054236.3-020451 | N2023/2024 | 138 | 5:42:36.35 | -02:04:51.2 | 0.083 | 0.268 | 0.055 | 0.571 | 1.908 | N | 0.00 | -1 | -1 | 0.133 |
| J054249.1-012457 | N2023/2024 | 139 | 5:42:49.12 | -01:24:57.4 | 0.082 | 0.407 | 0.068 | 0.353 | 0.527 | N | 0.00 | -1 | -1 | 0.260 |
| J054140.1-014412 | N2023/2024 | 140 | 5:41:40.11 | -01:44:12.4 | 0.082 | 0.712 | 0.086 | 0.417 | 5.205 | N | 0.51 | 0.082 | 0.467 | 0.507 |
| J054317.9-021059 | N2023/2024 | 141 | 5:43:17.99 | -02:10:60.0 | 0.082 | 0.166 | 0.046 | 0.587 | 0.823 | N | 0.00 | -1 | -1 | 0.050 |
| J054042.8-015230 | N2023/2024 | 142 | 5:40:42.88 | -01:52:30.3 | 0.082 | 0.086 | 0.038 | 0.344 | 0.262 | N | 0.00 | -1 | -1 | 0.021 |
| J054058.4-022718 | N2023/2024 | 143 | 5:40:58.48 | -02:27:18.3 | 0.081 | 0.186 | 0.047 | 0.369 | 1.201 | N | 0.00 | -1 | -1 | 0.082 |
| J054134.5-014548 | N2023/2024 | 144 | 5:41:34.51 | -01:45:48.4 | 0.080 | 0.190 | 0.048 | 0.348 | 1.344 | N | 1.00 | 0.074 | 0.179 | 0.098 |
| J054043.6-015457 | N2023/2024 | 145 | 5:40:43.68 | -01:54:57.3 | 0.080 | 0.266 | 0.060 | 0.496 | 1.484 | N | 0.00 | -1 | -1 | 0.125 |
| J054115.4-022824 | N2023/2024 | 146 | 5:41:15.50 | -02:28:24.3 | 0.080 | 0.467 | 0.073 | 0.388 | 3.051 | N | 0.00 | -1 | -1 | 0.250 |
| J054113.2-022021 | N2023/2024 | 147 | 5:41:13.30 | -02:20:21.3 | 0.079 | 0.169 | 0.046 | 0.334 | 0.983 | N | 0.00 | -1 | -1 | 0.084 |
| J054120.5-022003 | N2023/2024 | 148 | 5:41:20.50 | -02:20:03.3 | 0.079 | 0.178 | 0.043 | 0.328 | 1.192 | N | 0.00 | -1 | -1 | 0.063 |
| J054105.4-011803 | N2023/2024 | 149 | 5:41:05.50 | -01:18:03.7 | 0.079 | 0.414 | 0.072 | 0.542 | 2.217 | N | 0.00 | -1 | -1 | 0.222 |
| J054153.1-015251 | N2023/2024 | 150 | 5:41:53.12 | -01:52:51.3 | 0.078 | 0.641 | 0.083 | 0.414 | 3.448 | N | 1.00 | 0.074 | 0.562 | 0.349 |
| J054140.9-015942 | N2023/2024 | 151 | 5:41:40.91 | -01:59:42.3 | 0.078 | 0.217 | 0.049 | 0.258 | -0.276 | N | 1.00 | 0.051 | 0.109 | 0.111 |
| J054114.8-015118 | N2023/2024 | 152 | 5:41:14.90 | -01:51:18.3 | 0.078 | 0.246 | 0.050 | 0.324 | 0.933 | N | 1.00 | 0.061 | 0.133 | 0.115 |
| J054226.1-020430 | N2023/2024 | 153 | 5:42:26.14 | -02:04:30.2 | 0.078 | 0.228 | 0.056 | 0.583 | 1.711 | N | 0.00 | -1 | -1 | 0.128 |
| J054322.1-020941 | N2023/2024 | 154 | 5:43:22.19 | -02:09:42.0 | 0.078 | 0.140 | 0.044 | 0.576 | 0.788 | N | 0.00 | -1 | -1 | 0.041 |
| J054057.8-015406 | N2023/2024 | 155 | 5:40:57.89 | -01:54:06.3 | 0.078 | 0.258 | 0.066 | 0.416 | 1.198 | N | 0.00 | -1 | -1 | 0.082 |
| J054220.3-015506 | N2023/2024 | 156 | 5:42:20.33 | -01:55:06.2 | 0.078 | 0.132 | 0.043 | 0.548 | 1.158 | N | 0.00 | -1 | -1 | 0.052 |
| J054134.5-021433 | N2023/2024 | 157 | 5:41:34.51 | -02:14:33.3 | 0.076 | 0.143 | 0.044 | 0.389 | 1.096 | N | 0.00 | -1 | -1 | 0.076 |
| J054156.9-015024 | N2023/2024 | 158 | 5:41:56.92 | -01:50:24.3 | 0.076 | 0.302 | 0.064 | 0.447 | 1.482 | N | 0.99 | 0.056 | 0.072 | 0.171 |
| J054120.7-015421 | N2023/2024 | 159 | 5:41:20.70 | -01:54:21.3 | 0.076 | 0.170 | 0.045 | 0.256 | 0.572 | N | 1.00 | 0.059 | 0.107 | 0.095 |
| J054004.0-021645 | N2023/2024 | 160 | 5:40:04.04 | -02:16:45.2 | 0.076 | 0.049 | 0.029 | 0.386 | 0.097 | N | 0.00 | -1 | -1 | 0.011 |
| J054118.7-021200 | N2023/2024 | 161 | 5:41:18.70 | -02:12:00.3 | 0.075 | 0.403 | 0.079 | 0.364 | 2.208 | N | 0.00 | -1 | -1 | 0.187 |
| J054228.7-020457 | N2023/2024 | 162 | 5:42:28.75 | -02:04:57.2 | 0.075 | 0.192 | 0.052 | 0.397 | 1.522 | N | 0.00 | -1 | -1 | 0.085 |
| J054139.1-014548 | N2023/2024 | 163 | 5:41:39.11 | -01:45:48.4 | 0.075 | 0.171 | 0.052 | 0.294 | 0.737 | N | 1.00 | 0.067 | 0.109 | 0.083 |
| J054014.2-012957 | N2023/2024 | 164 | 5:40:14.29 | -01:29:57.4 | 0.075 | 0.087 | 0.039 | 0.509 | 0.219 | N | 0.00 | -1 | -1 | -0.005 |
| J054436.6-011027 | N2023/2024 | 165 | 5:44:36.69 | -01:10:27.4 | 0.074 | 0.390 | 0.072 | 0.401 | 1.799 | N | 0.00 | -1 | -1 | 0.200 |
| J054148.1-021933 | N2023/2024 | 166 | 5:41:48.13 | -02:19:33.3 | 0.074 | 0.393 | 0.088 | 0.361 | 2.293 | N | 0.00 | -1 | -1 | 0.119 |
| J054118.9-014657 | N2023/2024 | 167 | 5:41:18.90 | -01:46:57.4 | 0.073 | 0.455 | 0.075 | 0.433 | 3.504 | N | 1.00 | 0.063 | 0.411 | 0.175 |
| J054117.9-022206 | N2023/2024 | 168 | 5:41:17.90 | -02:22:06.3 | 0.073 | 0.340 | 0.068 | 0.358 | 2.137 | N | 0.00 | -1 | -1 | 0.147 |
| J054120.3-022751 | N2023/2024 | 169 | 5:41:20.30 | -02:27:51.3 | 0.073 | 0.400 | 0.079 | 0.366 | 2.340 | N | 0.00 | -1 | -1 | 0.178 |
| J054110.0-015315 | N2023/2024 | 170 | 5:41:10.10 | -01:53:15.3 | 0.073 | 0.333 | 0.069 | 0.350 | 0.666 | N | 1.00 | 0.061 | 0.209 | 0.137 |
| J054119.3-015215 | N2023/2024 | 171 | 5:41:19.30 | -01:52:15.3 | 0.072 | 0.294 | 0.059 | 0.314 | 1.296 | N | 1.00 | 0.062 | 0.232 | 0.115 |
| J054113.8-022039 | N2023/2024 | 172 | 5:41:13.90 | -02:20:39.3 | 0.072 | 0.111 | 0.041 | 0.297 | 0.412 | N | 0.00 | -1 | -1 | 0.035 |
| J054105.6-015348 | N2023/2024 | 173 | 5:41:05.69 | -01:53:48.3 | 0.072 | 0.247 | 0.056 | 0.434 | 0.612 | N | 1.00 | 0.045 | 0.048 | 0.088 |
| J054155.3-015412 | N2023/2024 | 174 | 5:41:55.32 | -01:54:12.3 | 0.070 | 0.269 | 0.057 | 0.418 | 2.309 | N | 1.00 | 0.070 | 0.278 | 0.119 |
| J054157.9-014530 | N2023/2024 | 175 | 5:41:57.92 | -01:45:30.3 | 0.070 | 0.329 | 0.070 | 0.419 | 2.153 | N | 0.00 | -1 | -1 | 0.153 |
| J054047.8-020745 | N2023/2024 | 176 | 5:40:47.88 | -02:07:45.3 | 0.070 | 0.524 | 0.094 | 0.337 | 2.448 | N | 0.00 | -1 | -1 | 0.244 |
| J054326.3-011445 | N2023/2024 | 177 | 5:43:26.31 | -01:14:45.5 | 0.070 | 0.255 | 0.059 | 0.350 | 1.179 | N | 0.00 | -1 | -1 | 0.128 |
| J054039.6-015551 | N2023/2024 | 178 | 5:40:39.68 | -01:55:51.3 | 0.069 | 0.104 | 0.040 | 0.307 | 0.280 | N | 0.00 | -1 | -1 | 0.036 |
| J054126.7-020200 | N2023/2024 | 179 | 5:41:26.71 | -02:02:00.3 | 0.069 | 0.620 | 0.096 | 0.403 | 4.427 | N | 0.37 | 0.069 | 0.546 | 0.273 |
| J054040.4-015627 | N2023/2024 | 180 | 5:40:40.48 | -01:56:27.3 | 0.069 | 0.239 | 0.071 | 0.314 | 0.756 | N | 0.00 | -1 | -1 | 0.056 |
| J054144.9-014742 | N2023/2024 | 181 | 5:41:44.91 | -01:47:42.3 | 0.069 | 0.608 | 0.093 | 0.410 | 3.787 | N | 1.00 | 0.059 | 0.517 | 0.314 |
| J054104.8-015815 | N2023/2024 | 182 | 5:41:04.89 | -01:58:15.3 | 0.069 | 0.125 | 0.042 | 0.317 | 0.496 | N | 0.00 | -1 | -1 | 0.027 |
| J054132.7-014703 | N2023/2024 | 183 | 5:41:32.71 | -01:47:03.3 | 0.068 | 0.248 | 0.059 | 0.267 | 0.905 | N | 1.00 | 0.058 | 0.183 | 0.105 |
| J054121.7-021109 | N2023/2024 | 184 | 5:41:21.70 | -02:11:09.3 | 0.068 | 0.124 | 0.051 | 0.274 | 0.534 | N | 0.00 | -1 | -1 | 0.031 |
| J054215.7-020445 | N2023/2024 | 185 | 5:42:15.74 | -02:04:45.2 | 0.068 | 0.297 | 0.067 | 0.441 | 2.579 | N | 0.00 | -1 | -1 | 0.150 |
| J054054.6-021748 | N2023/2024 | 186 | 5:40:54.68 | -02:17:48.3 | 0.068 | 0.310 | 0.072 | 0.328 | 1.613 | N | 0.00 | -1 | -1 | 0.097 |
| J054119.7-014848 | N2023/2024 | 187 | 5:41:19.70 | -01:48:48.3 | 0.068 | 0.130 | 0.040 | 0.335 | 0.706 | N | 1.00 | 0.055 | 0.098 | 0.049 |
| J054153.9-014724 | N2023/2024 | 188 | 5:41:53.92 | -01:47:24.3 | 0.068 | 0.337 | 0.070 | 0.344 | 1.770 | N | 0.00 | -1 | -1 | 0.130 |
| J054242.9-020745 | N2023/2024 | 189 | 5:42:42.96 | -02:07:45.2 | 0.068 | 0.478 | 0.079 | 0.551 | 3.824 | N | 0.00 | -1 | -1 | 0.231 |
| J054043.2-015542 | N2023/2024 | 190 | 5:40:43.28 | -01:55:42.3 | 0.068 | 0.085 | 0.034 | 0.308 | 0.196 | N | 0.00 | -1 | -1 | 0.032 |
| J054312.1-020915 | N2023/2024 | 191 | 5:43:12.18 | -02:09:15.0 | 0.068 | 0.093 | 0.045 | 0.514 | 0.736 | N | 0.00 | -1 | -1 | 0.018 |
| J054159.3-014836 | N2023/2024 | 192 | 5:41:59.32 | -01:48:36.3 | 0.068 | 0.366 | 0.075 | 0.422 | 2.915 | N | 0.00 | -1 | -1 | 0.156 |
| J054043.6-014924 | N2023/2024 | 193 | 5:40:43.68 | -01:49:24.3 | 0.067 | 0.195 | 0.051 | 0.420 | 0.305 | N | 0.00 | -1 | -1 | 0.068 |
| J054136.5-023103 | N2023/2024 | 194 | 5:41:36.52 | -02:31:03.3 | 0.067 | 0.140 | 0.046 | 0.315 | 0.521 | N | 0.00 | -1 | -1 | 0.029 |
| J054118.9-014633 | N2023/2024 | 195 | 5:41:18.90 | -01:46:33.4 | 0.067 | 0.112 | 0.034 | 0.395 | 0.962 | N | 1.00 | 0.068 | 0.115 | 0.037 |
| J054150.9-014403 | N2023/2024 | 196 | 5:41:50.91 | -01:44:03.4 | 0.067 | 0.194 | 0.054 | 0.380 | 1.433 | N | 0.00 | -1 | -1 | 0.080 |
| J054252.9-011521 | N2023/2024 | 197 | 5:42:52.91 | -01:15:21.6 | 0.067 | 0.270 | 0.072 | 0.317 | 1.419 | N | 0.00 | -1 | -1 | 0.078 |
| J054044.6-015209 | N2023/2024 | 198 | 5:40:44.68 | -01:52:09.3 | 0.066 | 0.083 | 0.039 | 0.352 | 0.573 | N | 0.00 | -1 | -1 | 0.034 |
| J054044.0-014903 | N2023/2024 | 199 | 5:40:44.08 | -01:49:03.3 | 0.066 | 0.133 | 0.042 | 0.305 | 0.307 | N | 0.00 | -1 | -1 | 0.049 |
| J054254.7-012530 | N2023/2024 | 200 | 5:42:54.72 | -01:25:30.4 | 0.066 | 0.281 | 0.062 | 0.346 | 0.340 | N | 0.00 | -1 | -1 | 0.134 |
| J054113.6-015615 | N2023/2024 | 201 | 5:41:13.70 | -01:56:15.3 | 0.066 | 0.118 | 0.043 | 0.352 | 1.205 | N | 0.98 | 0.052 | 0.071 | 0.041 |
| J054136.5-023218 | N2023/2024 | 202 | 5:41:36.52 | -02:32:18.3 | 0.066 | 0.107 | 0.046 | 0.354 | 0.406 | N | 0.00 | -1 | -1 | 0.021 |
| J054329.5-011503 | N2023/2024 | 203 | 5:43:29.51 | -01:15:03.5 | 0.066 | 0.172 | 0.057 | 0.335 | 0.775 | N | 0.00 | -1 | -1 | 0.046 |
| J054057.8-022542 | N2023/2024 | 204 | 5:40:57.88 | -02:25:42.3 | 0.066 | 0.351 | 0.071 | 0.293 | 1.699 | N | 0.00 | -1 | -1 | 0.120 |
| J054300.7-011445 | N2023/2024 | 205 | 5:43:00.71 | -01:14:45.6 | 0.065 | 0.114 | 0.039 | 0.332 | 0.540 | N | 0.00 | -1 | -1 | 0.055 |
| J054118.3-020715 | N2023/2024 | 206 | 5:41:18.30 | -02:07:15.3 | 0.065 | 0.112 | 0.045 | 0.226 | 0.533 | N | 0.00 | -1 | -1 | 0.050 |
| J054111.8-015554 | N2023/2024 | 207 | 5:41:11.90 | -01:55:54.3 | 0.065 | 0.323 | 0.068 | 0.377 | 1.728 | N | 0.48 | 0.059 | 0.213 | 0.133 |
| J054114.4-015206 | N2023/2024 | 208 | 5:41:14.50 | -01:52:06.3 | 0.065 | 0.040 | 0.031 | 0.283 | 0.030 | N | 1.00 | 0.062 | 0.032 | 0.009 |
| J054118.9-014924 | N2023/2024 | 209 | 5:41:18.90 | -01:49:24.3 | 0.065 | 0.243 | 0.057 | 0.376 | 1.156 | N | 1.00 | 0.064 | 0.195 | 0.067 |
| J054046.6-015321 | N2023/2024 | 210 | 5:40:46.68 | -01:53:21.3 | 0.064 | 0.335 | 0.069 | 0.495 | 1.392 | N | 0.00 | -1 | -1 | 0.159 |
| J054210.3-015233 | N2023/2024 | 211 | 5:42:10.33 | -01:52:33.3 | 0.064 | 0.142 | 0.047 | 0.441 | 1.328 | N | 0.00 | -1 | -1 | 0.033 |
| J054100.8-015909 | N2023/2024 | 212 | 5:41:00.89 | -01:59:09.3 | 0.064 | 0.268 | 0.066 | 0.397 | 1.491 | N | 0.00 | -1 | -1 | 0.136 |
| J054055.4-011300 | N2023/2024 | 213 | 5:40:55.50 | -01:13:00.8 | 0.064 | 0.093 | 0.050 | 0.502 | 0.474 | N | 0.00 | -1 | -1 | 0.023 |
| J054231.1-012224 | N2023/2024 | 214 | 5:42:31.11 | -01:22:24.5 | 0.064 | 0.263 | 0.065 | 0.428 | 1.609 | N | 0.00 | -1 | -1 | 0.082 |
| J054156.7-014742 | N2023/2024 | 215 | 5:41:56.72 | -01:47:42.3 | 0.064 | 0.196 | 0.050 | 0.366 | 1.172 | N | 0.00 | -1 | -1 | 0.070 |
| J054148.9-021406 | N2023/2024 | 216 | 5:41:48.92 | -02:14:06.3 | 0.063 | 0.105 | 0.047 | 0.334 | 0.746 | N | 0.00 | -1 | -1 | 0.028 |
| J054050.2-014700 | N2023/2024 | 217 | 5:40:50.29 | -01:47:00.3 | 0.063 | 0.056 | 0.032 | 0.261 | 0.014 | N | 0.00 | -1 | -1 | 0.012 |
| J054112.6-015424 | N2023/2024 | 218 | 5:41:12.70 | -01:54:24.3 | 0.063 | 0.129 | 0.044 | 0.374 | 1.007 | N | 1.00 | 0.062 | 0.126 | 0.056 |
| J054056.0-014906 | N2023/2024 | 219 | 5:40:56.09 | -01:49:06.3 | 0.063 | 0.329 | 0.074 | 0.341 | 1.342 | N | 1.00 | 0.052 | 0.211 | 0.121 |
| J054140.5-012839 | N2023/2024 | 220 | 5:41:40.51 | -01:28:39.5 | 0.063 | 0.212 | 0.062 | 0.495 | 1.486 | N | 0.00 | -1 | -1 | 0.070 |
| J054127.7-021300 | N2023/2024 | 221 | 5:41:27.71 | -02:13:00.3 | 0.062 | 0.113 | 0.042 | 0.341 | 0.789 | N | 0.00 | -1 | -1 | 0.020 |
| J054107.6-015639 | N2023/2024 | 222 | 5:41:07.69 | -01:56:39.3 | 0.062 | 0.140 | 0.045 | 0.311 | 0.781 | N | 0.00 | -1 | -1 | 0.044 |
| J054151.9-014833 | N2023/2024 | 223 | 5:41:51.92 | -01:48:33.3 | 0.062 | 0.403 | 0.078 | 0.432 | 2.829 | N | 0.96 | 0.040 | 0.120 | 0.195 |
| J054051.0-014500 | N2023/2024 | 224 | 5:40:51.09 | -01:45:00.4 | 0.062 | 0.049 | 0.031 | 0.296 | 0.214 | N | 0.00 | -1 | -1 | 0.012 |
| J054126.3-015457 | N2023/2024 | 225 | 5:41:26.31 | -01:54:57.3 | 0.062 | 0.248 | 0.058 | 0.367 | 1.573 | N | 1.00 | 0.060 | 0.193 | 0.110 |
| J054107.8-023051 | N2023/2024 | 226 | 5:41:07.89 | -02:30:51.3 | 0.061 | 0.256 | 0.070 | 0.271 | 0.664 | N | 0.00 | -1 | -1 | 0.080 |
| J054017.2-023039 | N2023/2024 | 227 | 5:40:17.24 | -02:30:39.2 | 0.061 | 0.054 | 0.033 | 0.283 | -0.054 | N | 0.00 | -1 | -1 | 0.015 |
| J054108.4-021309 | N2023/2024 | 228 | 5:41:08.49 | -02:13:09.3 | 0.061 | 0.369 | 0.081 | 0.307 | 1.094 | N | 0.00 | -1 | -1 | 0.124 |
| J054141.1-023433 | N2023/2024 | 229 | 5:41:41.12 | -02:34:33.3 | 0.061 | 0.257 | 0.072 | 0.327 | 0.517 | N | 0.00 | -1 | -1 | 0.052 |
| J054436.2-011206 | N2023/2024 | 230 | 5:44:36.29 | -01:12:06.3 | 0.060 | 0.093 | 0.043 | 0.372 | 0.470 | N | 0.00 | -1 | -1 | 0.032 |
| J054100.8-021900 | N2023/2024 | 231 | 5:41:00.89 | -02:19:00.3 | 0.060 | 0.146 | 0.053 | 0.302 | 0.842 | N | 0.00 | -1 | -1 | 0.029 |
| J054053.0-015112 | N2023/2024 | 232 | 5:40:53.09 | -01:51:12.3 | 0.060 | 0.204 | 0.067 | 0.387 | 0.648 | N | 0.09 | 0.060 | 0.177 | 0.058 |
| J054053.6-015206 | N2023/2024 | 233 | 5:40:53.69 | -01:52:06.3 | 0.060 | 0.137 | 0.049 | 0.356 | 0.629 | N | 0.00 | -1 | -1 | 0.046 |
| J054113.2-013954 | N2023/2024 | 234 | 5:41:13.30 | -01:39:54.4 | 0.060 | 0.236 | 0.060 | 0.388 | 1.919 | N | 0.00 | -1 | -1 | 0.096 |
| J054128.7-021524 | N2023/2024 | 235 | 5:41:28.71 | -02:15:24.3 | 0.060 | 0.093 | 0.036 | 0.399 | 0.890 | N | 0.00 | -1 | -1 | 0.017 |
| J054059.8-021621 | N2023/2024 | 236 | 5:40:59.89 | -02:16:21.3 | 0.060 | 0.204 | 0.060 | 0.267 | 0.671 | N | 0.00 | -1 | -1 | 0.091 |
| J054118.1-022409 | N2023/2024 | 237 | 5:41:18.10 | -02:24:09.3 | 0.060 | 0.341 | 0.084 | 0.357 | 1.225 | N | 0.00 | -1 | -1 | 0.070 |
| J054216.3-020036 | N2023/2024 | 238 | 5:42:16.33 | -02:00:36.2 | 0.060 | 0.058 | 0.040 | 0.360 | 0.215 | N | 1.00 | 0.057 | 0.049 | 0.004 |
| J054248.3-020454 | N2023/2024 | 239 | 5:42:48.36 | -02:04:54.1 | 0.060 | 0.113 | 0.047 | 0.380 | 0.889 | N | 0.00 | -1 | -1 | 0.046 |
| J054047.2-014512 | N2023/2024 | 240 | 5:40:47.29 | -01:45:12.3 | 0.059 | 0.116 | 0.046 | 0.349 | 0.404 | N | 0.00 | -1 | -1 | 0.037 |
| J054052.0-014454 | N2023/2024 | 241 | 5:40:52.09 | -01:44:54.4 | 0.059 | 0.140 | 0.052 | 0.361 | 0.514 | N | 0.00 | -1 | -1 | 0.032 |
| J054119.5-020709 | N2023/2024 | 242 | 5:41:19.50 | -02:07:09.3 | 0.059 | 0.132 | 0.049 | 0.319 | 0.553 | N | 0.00 | -1 | -1 | 0.029 |
| J054051.6-014803 | N2023/2024 | 243 | 5:40:51.69 | -01:48:03.3 | 0.059 | 0.117 | 0.048 | 0.282 | 0.221 | N | 0.00 | -1 | -1 | 0.038 |
| J054231.3-021918 | N2023/2024 | 244 | 5:42:31.36 | -02:19:18.2 | 0.059 | 0.112 | 0.051 | 0.443 | 0.331 | N | 0.00 | -1 | -1 | 0.014 |
| J054333.9-011539 | N2023/2024 | 245 | 5:43:33.91 | -01:15:39.5 | 0.059 | 0.253 | 0.059 | 0.422 | 1.343 | N | 0.00 | -1 | -1 | 0.134 |
| J054137.3-021212 | N2023/2024 | 246 | 5:41:37.31 | -02:12:12.3 | 0.059 | 0.228 | 0.068 | 0.353 | 1.278 | N | 0.00 | -1 | -1 | 0.040 |
| J054045.8-013736 | N2023/2024 | 247 | 5:40:45.89 | -01:37:36.4 | 0.058 | 0.095 | 0.046 | 0.353 | 0.480 | N | 0.00 | -1 | -1 | 0.017 |
| J054348.4-010409 | N2023/2024 | 248 | 5:43:48.48 | -01:04:09.8 | 0.058 | 0.162 | 0.052 | 0.323 | 0.423 | N | 0.00 | -1 | -1 | 0.046 |
| J054200.9-015818 | N2023/2024 | 249 | 5:42:00.92 | -01:58:18.3 | 0.058 | 0.336 | 0.072 | 0.431 | 1.744 | N | 1.00 | 0.054 | 0.299 | 0.130 |
| J054128.7-021239 | N2023/2024 | 250 | 5:41:28.71 | -02:12:39.3 | 0.058 | 0.073 | 0.035 | 0.258 | 0.531 | N | 0.00 | -1 | -1 | 0.009 |
| J054138.3-013145 | N2023/2024 | 251 | 5:41:38.31 | -01:31:45.5 | 0.058 | 0.204 | 0.058 | 0.420 | 1.122 | N | 0.00 | -1 | -1 | 0.094 |
| J054426.4-011051 | N2023/2024 | 252 | 5:44:26.49 | -01:10:51.4 | 0.058 | 0.234 | 0.070 | 0.342 | 0.999 | N | 0.00 | -1 | -1 | 0.081 |
| J054216.7-014900 | N2023/2024 | 253 | 5:42:16.73 | -01:49:00.3 | 0.057 | 0.062 | 0.035 | 0.442 | 0.357 | N | 0.00 | -1 | -1 | 0.008 |
| J054302.7-015824 | N2023/2024 | 254 | 5:43:02.76 | -01:58:24.1 | 0.057 | 0.319 | 0.077 | 0.426 | 2.011 | N | 0.00 | -1 | -1 | 0.113 |
| J054430.1-012103 | N2023/2024 | 255 | 5:44:30.11 | -01:21:03.1 | 0.057 | 0.136 | 0.050 | 0.387 | 0.842 | N | 0.00 | -1 | -1 | 0.032 |
| J054109.2-014924 | N2023/2024 | 256 | 5:41:09.30 | -01:49:24.3 | 0.057 | 0.055 | 0.033 | 0.295 | 0.267 | N | 1.00 | 0.055 | 0.048 | 0.018 |
| J054120.5-022509 | N2023/2024 | 257 | 5:41:20.50 | -02:25:09.3 | 0.057 | 0.159 | 0.056 | 0.349 | 0.919 | N | 0.00 | -1 | -1 | 0.031 |
| J054125.7-021412 | N2023/2024 | 258 | 5:41:25.71 | -02:14:12.3 | 0.057 | 0.132 | 0.044 | 0.343 | 1.140 | N | 0.00 | -1 | -1 | 0.037 |
| J054053.2-014845 | N2023/2024 | 259 | 5:40:53.29 | -01:48:45.3 | 0.057 | 0.093 | 0.038 | 0.336 | 0.167 | N | 0.76 | 0.051 | 0.036 | 0.026 |
| J054127.9-015830 | N2023/2024 | 260 | 5:41:27.91 | -01:58:30.3 | 0.057 | 0.233 | 0.064 | 0.314 | 1.393 | N | 1.00 | 0.055 | 0.165 | 0.077 |
| J054140.3-013357 | N2023/2024 | 261 | 5:41:40.31 | -01:33:57.4 | 0.057 | 0.177 | 0.054 | 0.399 | 1.143 | N | 0.00 | -1 | -1 | 0.051 |
| J054138.9-022909 | N2023/2024 | 262 | 5:41:38.92 | -02:29:09.3 | 0.057 | 0.063 | 0.036 | 0.254 | 0.271 | N | 0.00 | -1 | -1 | 0.015 |
| J054102.0-011748 | N2023/2024 | 263 | 5:41:02.10 | -01:17:48.7 | 0.056 | 0.139 | 0.049 | 0.390 | 0.919 | N | 0.00 | -1 | -1 | 0.042 |
| J054314.5-020912 | N2023/2024 | 264 | 5:43:14.58 | -02:09:12.0 | 0.056 | 0.065 | 0.035 | 0.403 | 0.352 | N | 0.00 | -1 | -1 | 0.015 |
| J054102.2-015512 | N2023/2024 | 265 | 5:41:02.29 | -01:55:12.3 | 0.056 | 0.210 | 0.059 | 0.288 | 0.924 | N | 0.00 | -1 | -1 | 0.056 |
| J054207.3-015215 | N2023/2024 | 266 | 5:42:07.32 | -01:52:15.3 | 0.056 | 0.116 | 0.043 | 0.398 | 1.058 | N | 0.00 | -1 | -1 | 0.034 |
| J054202.3-014933 | N2023/2024 | 267 | 5:42:02.32 | -01:49:33.3 | 0.056 | 0.108 | 0.043 | 0.332 | 0.449 | N | 0.00 | -1 | -1 | 0.041 |
| J054035.6-015936 | N2023/2024 | 268 | 5:40:35.68 | -01:59:36.3 | 0.056 | 0.140 | 0.043 | 0.320 | 0.379 | N | 0.00 | -1 | -1 | 0.063 |
| J054120.5-015724 | N2023/2024 | 269 | 5:41:20.50 | -01:57:24.3 | 0.056 | 0.139 | 0.047 | 0.331 | 0.883 | N | 1.00 | 0.053 | 0.119 | 0.040 |
| J054132.9-014009 | N2023/2024 | 270 | 5:41:32.91 | -01:40:09.4 | 0.055 | 0.245 | 0.067 | 0.396 | 1.795 | N | 0.00 | -1 | -1 | 0.122 |
| J054206.1-021409 | N2023/2024 | 271 | 5:42:06.14 | -02:14:09.2 | 0.055 | 0.076 | 0.041 | 0.308 | 0.526 | N | 0.00 | -1 | -1 | 0.016 |
| J054251.9-011803 | N2023/2024 | 272 | 5:42:51.91 | -01:18:03.6 | 0.055 | 0.189 | 0.056 | 0.291 | 0.548 | N | 0.00 | -1 | -1 | 0.077 |
| J054121.1-020639 | N2023/2024 | 273 | 5:41:21.10 | -02:06:39.3 | 0.055 | 0.174 | 0.052 | 0.302 | 1.130 | N | 0.00 | -1 | -1 | 0.056 |
| J054132.7-021509 | N2023/2024 | 274 | 5:41:32.71 | -02:15:09.3 | 0.055 | 0.078 | 0.038 | 0.307 | 0.860 | N | 0.00 | -1 | -1 | 0.014 |
| J054205.9-020603 | N2023/2024 | 275 | 5:42:05.93 | -02:06:03.3 | 0.055 | 0.314 | 0.071 | 0.400 | 2.610 | N | 0.07 | 0.055 | 0.304 | 0.137 |
| J054214.9-014851 | N2023/2024 | 276 | 5:42:14.93 | -01:48:51.3 | 0.055 | 0.093 | 0.041 | 0.444 | 0.431 | N | 0.00 | -1 | -1 | 0.022 |
| J054212.9-014857 | N2023/2024 | 277 | 5:42:12.93 | -01:48:57.3 | 0.055 | 0.088 | 0.043 | 0.337 | 0.292 | N | 0.00 | -1 | -1 | 0.007 |
| J054043.4-015621 | N2023/2024 | 278 | 5:40:43.48 | -01:56:21.3 | 0.055 | 0.046 | 0.029 | 0.287 | 0.180 | N | 0.00 | -1 | -1 | 0.006 |
| J054407.8-011227 | N2023/2024 | 279 | 5:44:07.90 | -01:12:27.5 | 0.055 | 0.062 | 0.042 | 0.259 | 0.213 | N | 0.00 | -1 | -1 | -0.002 |
| J054117.9-020048 | N2023/2024 | 280 | 5:41:17.90 | -02:00:48.3 | 0.055 | 0.237 | 0.064 | 0.242 | 1.081 | N | 0.00 | -1 | -1 | 0.091 |
| J054036.8-015851 | N2023/2024 | 281 | 5:40:36.88 | -01:58:51.3 | 0.055 | 0.103 | 0.046 | 0.318 | 0.373 | N | 0.00 | -1 | -1 | 0.029 |
| J054056.4-014824 | N2023/2024 | 282 | 5:40:56.49 | -01:48:24.3 | 0.055 | 0.116 | 0.045 | 0.277 | 0.467 | N | 1.00 | 0.044 | 0.046 | 0.033 |
| J054051.2-014709 | N2023/2024 | 283 | 5:40:51.29 | -01:47:09.3 | 0.055 | 0.174 | 0.057 | 0.420 | 0.541 | N | 0.00 | -1 | -1 | 0.046 |
| J054116.2-022109 | N2023/2024 | 284 | 5:41:16.30 | -02:21:09.3 | 0.055 | 0.085 | 0.038 | 0.267 | 0.134 | N | 0.00 | -1 | -1 | 0.026 |
| J054049.0-014645 | N2023/2024 | 285 | 5:40:49.09 | -01:46:45.3 | 0.055 | 0.086 | 0.038 | 0.318 | 0.427 | N | 0.00 | -1 | -1 | 0.025 |
| J054222.1-020821 | N2023/2024 | 286 | 5:42:22.15 | -02:08:21.2 | 0.055 | 0.043 | 0.031 | 0.331 | 0.261 | N | 0.00 | -1 | -1 | 0.016 |
| J054252.9-020921 | N2023/2024 | 287 | 5:42:52.97 | -02:09:21.1 | 0.055 | 0.050 | 0.030 | 0.449 | 0.217 | N | 0.00 | -1 | -1 | 0.005 |
| J054129.1-023324 | N2023/2024 | 288 | 5:41:29.11 | -02:33:24.3 | 0.054 | 0.092 | 0.047 | 0.214 | 0.087 | N | 0.00 | -1 | -1 | -0.005 |
| J054038.8-014348 | N2023/2024 | 289 | 5:40:38.88 | -01:43:48.3 | 0.054 | 0.130 | 0.058 | 0.437 | 0.559 | N | 0.00 | -1 | -1 | 0.034 |
| J054208.5-015836 | N2023/2024 | 290 | 5:42:08.53 | -01:58:36.3 | 0.054 | 0.100 | 0.052 | 0.538 | 0.405 | N | 1.00 | 0.052 | 0.093 | 0.012 |
| J054217.9-015912 | N2023/2024 | 291 | 5:42:17.93 | -01:59:12.2 | 0.054 | 0.219 | 0.058 | 0.431 | 1.283 | N | 1.00 | 0.051 | 0.192 | 0.099 |
| J054138.5-013903 | N2023/2024 | 292 | 5:41:38.51 | -01:39:03.4 | 0.054 | 0.367 | 0.084 | 0.461 | 2.099 | N | 0.00 | -1 | -1 | 0.124 |
| J054254.7-020924 | N2023/2024 | 293 | 5:42:54.77 | -02:09:24.1 | 0.054 | 0.111 | 0.052 | 0.366 | 0.362 | N | 0.00 | -1 | -1 | 0.020 |
| J054202.1-015603 | N2023/2024 | 294 | 5:42:02.12 | -01:56:03.3 | 0.054 | 0.134 | 0.050 | 0.420 | 0.813 | N | 1.00 | 0.051 | 0.131 | 0.017 |
| J054227.3-015654 | N2023/2024 | 295 | 5:42:27.34 | -01:56:54.2 | 0.054 | 0.094 | 0.045 | 0.338 | 0.235 | N | 0.00 | -1 | -1 | 0.028 |
| J054108.0-022024 | N2023/2024 | 296 | 5:41:08.09 | -02:20:24.3 | 0.054 | 0.196 | 0.056 | 0.278 | 0.802 | N | 0.00 | -1 | -1 | 0.062 |
| J054144.7-021948 | N2023/2024 | 297 | 5:41:44.72 | -02:19:48.3 | 0.054 | 0.082 | 0.040 | 0.312 | 0.724 | N | 0.00 | -1 | -1 | 0.037 |
| J054209.3-014921 | N2023/2024 | 298 | 5:42:09.32 | -01:49:21.3 | 0.054 | 0.277 | 0.073 | 0.346 | 1.437 | N | 0.00 | -1 | -1 | 0.073 |
| J054038.2-014715 | N2023/2024 | 299 | 5:40:38.28 | -01:47:15.3 | 0.054 | 0.217 | 0.061 | 0.330 | 0.597 | N | 0.00 | -1 | -1 | 0.085 |
| J054207.9-014527 | N2023/2024 | 300 | 5:42:07.92 | -01:45:27.3 | 0.054 | 0.170 | 0.057 | 0.382 | 0.739 | N | 0.00 | -1 | -1 | 0.051 |
| J054106.8-014806 | N2023/2024 | 301 | 5:41:06.90 | -01:48:06.3 | 0.054 | 0.047 | 0.029 | 0.365 | 0.286 | N | 1.00 | 0.054 | 0.047 | 0.007 |
| J054206.1-021936 | N2023/2024 | 302 | 5:42:06.14 | -02:19:36.2 | 0.053 | 0.091 | 0.049 | 0.280 | 0.522 | N | 0.00 | -1 | -1 | 0.008 |
| J054108.2-023442 | N2023/2024 | 303 | 5:41:08.29 | -02:34:42.3 | 0.053 | 0.071 | 0.041 | 0.253 | 0.099 | N | 0.00 | -1 | -1 | 0.006 |
| J054210.1-014615 | N2023/2024 | 304 | 5:42:10.12 | -01:46:15.3 | 0.053 | 0.115 | 0.051 | 0.296 | 0.282 | N | 0.00 | -1 | -1 | 0.047 |
| J054155.1-015324 | N2023/2024 | 305 | 5:41:55.12 | -01:53:24.3 | 0.053 | 0.071 | 0.034 | 0.301 | 0.488 | N | 1.00 | 0.051 | 0.072 | 0.008 |
| J054117.9-015409 | N2023/2024 | 306 | 5:41:17.90 | -01:54:09.3 | 0.053 | 0.202 | 0.058 | 0.345 | 1.464 | N | 1.00 | 0.050 | 0.174 | 0.073 |
| J054042.4-014551 | N2023/2024 | 307 | 5:40:42.49 | -01:45:51.3 | 0.053 | 0.146 | 0.055 | 0.354 | 0.710 | N | 0.00 | -1 | -1 | 0.036 |
| J054059.2-022109 | N2023/2024 | 308 | 5:40:59.28 | -02:21:09.3 | 0.053 | 0.145 | 0.056 | 0.303 | 0.549 | N | 0.00 | -1 | -1 | 0.035 |
| J054109.6-022621 | N2023/2024 | 309 | 5:41:09.69 | -02:26:21.3 | 0.053 | 0.204 | 0.065 | 0.294 | 1.168 | N | 0.00 | -1 | -1 | 0.045 |
| J054114.4-022539 | N2023/2024 | 310 | 5:41:14.50 | -02:25:39.3 | 0.053 | 0.074 | 0.038 | 0.288 | 0.574 | N | 0.00 | -1 | -1 | 0.013 |
| J054103.0-015751 | N2023/2024 | 311 | 5:41:03.09 | -01:57:51.3 | 0.053 | 0.214 | 0.061 | 0.339 | 0.632 | N | 0.00 | -1 | -1 | 0.070 |
| J054121.9-015618 | N2023/2024 | 312 | 5:41:21.90 | -01:56:18.3 | 0.052 | 0.312 | 0.073 | 0.336 | 2.658 | N | 1.00 | 0.050 | 0.311 | 0.124 |
| J054144.3-014209 | N2023/2024 | 313 | 5:41:44.31 | -01:42:09.4 | 0.052 | 0.367 | 0.080 | 0.340 | 2.216 | N | 0.00 | -1 | -1 | 0.134 |
| J054112.4-021442 | N2023/2024 | 314 | 5:41:12.50 | -02:14:42.3 | 0.052 | 0.236 | 0.072 | 0.348 | 1.077 | N | 0.00 | -1 | -1 | 0.069 |
| J054205.7-015536 | N2023/2024 | 315 | 5:42:05.73 | -01:55:36.3 | 0.052 | 0.085 | 0.043 | 0.309 | 0.263 | N | 1.00 | 0.048 | 0.074 | 0.024 |
| J054153.3-021654 | N2023/2024 | 316 | 5:41:53.33 | -02:16:54.3 | 0.052 | 0.211 | 0.066 | 0.313 | 1.312 | N | 0.00 | -1 | -1 | 0.059 |
| J054127.3-020545 | N2023/2024 | 317 | 5:41:27.31 | -02:05:45.3 | 0.052 | 0.263 | 0.076 | 0.244 | 1.209 | N | 0.00 | -1 | -1 | 0.109 |
| J054102.2-022151 | N2023/2024 | 318 | 5:41:02.29 | -02:21:51.3 | 0.052 | 0.031 | 0.027 | 0.220 | 0.137 | N | 0.00 | -1 | -1 | 0.006 |
| J054152.5-013642 | N2023/2024 | 319 | 5:41:52.51 | -01:36:42.4 | 0.052 | 0.410 | 0.092 | 0.426 | 3.199 | N | 0.00 | -1 | -1 | 0.140 |
| J054141.1-022012 | N2023/2024 | 320 | 5:41:41.12 | -02:20:12.3 | 0.052 | 0.101 | 0.042 | 0.315 | 0.380 | N | 0.00 | -1 | -1 | 0.041 |
| J054048.2-015021 | N2023/2024 | 321 | 5:40:48.29 | -01:50:21.3 | 0.052 | 0.044 | 0.034 | 0.280 | 0.209 | N | 0.00 | -1 | -1 | 0.009 |
| J054232.1-021203 | N2023/2024 | 322 | 5:42:32.15 | -02:12:03.2 | 0.052 | 0.040 | 0.032 | 0.296 | 0.109 | N | 0.00 | -1 | -1 | 0.006 |
| J054059.8-014721 | N2023/2024 | 323 | 5:40:59.89 | -01:47:21.3 | 0.051 | 0.134 | 0.053 | 0.325 | 0.560 | N | 0.96 | 0.049 | 0.112 | 0.036 |
| J054126.5-022748 | N2023/2024 | 324 | 5:41:26.51 | -02:27:48.3 | 0.051 | 0.116 | 0.046 | 0.279 | 0.683 | N | 0.00 | -1 | -1 | 0.017 |
| J054142.1-013312 | N2023/2024 | 325 | 5:41:42.11 | -01:33:12.4 | 0.051 | 0.054 | 0.030 | 0.333 | 0.472 | N | 0.00 | -1 | -1 | 0.023 |
| J054121.5-020121 | N2023/2024 | 326 | 5:41:21.50 | -02:01:21.3 | 0.051 | 0.136 | 0.049 | 0.278 | 0.567 | N | 0.00 | -1 | -1 | 0.033 |
| J054339.9-011248 | N2023/2024 | 327 | 5:43:39.90 | -01:12:48.5 | 0.051 | 0.154 | 0.057 | 0.291 | 0.625 | N | 0.00 | -1 | -1 | 0.050 |
| J054057.4-014451 | N2023/2024 | 328 | 5:40:57.49 | -01:44:51.4 | 0.051 | 0.105 | 0.051 | 0.391 | 0.561 | N | 0.00 | -1 | -1 | 0.017 |
| J054157.3-021654 | N2023/2024 | 329 | 5:41:57.33 | -02:16:54.3 | 0.051 | 0.104 | 0.043 | 0.241 | 0.602 | N | 0.00 | -1 | -1 | 0.034 |
| J054024.8-013542 | N2023/2024 | 330 | 5:40:24.88 | -01:35:42.4 | 0.051 | 0.132 | 0.054 | 0.297 | 0.314 | N | 0.00 | -1 | -1 | 0.036 |
| J054253.3-021139 | N2023/2024 | 331 | 5:42:53.37 | -02:11:39.1 | 0.051 | 0.077 | 0.045 | 0.485 | 0.299 | N | 0.00 | -1 | -1 | 0.009 |
| J054340.6-010512 | N2023/2024 | 332 | 5:43:40.69 | -01:05:12.8 | 0.051 | 0.084 | 0.043 | 0.320 | 0.417 | N | 0.00 | -1 | -1 | 0.020 |
| J054145.7-021339 | N2023/2024 | 333 | 5:41:45.72 | -02:13:39.3 | 0.050 | 0.067 | 0.037 | 0.284 | 0.380 | N | 0.00 | -1 | -1 | 0.018 |
| J054045.0-013727 | N2023/2024 | 334 | 5:40:45.09 | -01:37:27.4 | 0.050 | 0.056 | 0.038 | 0.319 | 0.179 | N | 0.00 | -1 | -1 | 0.001 |
| J054130.1-012333 | N2023/2024 | 335 | 5:41:30.10 | -01:23:33.6 | 0.050 | 0.063 | 0.040 | 0.408 | 0.249 | N | 0.00 | -1 | -1 | 0.022 |
| J054135.1-021300 | N2023/2024 | 336 | 5:41:35.11 | -02:13:00.3 | 0.050 | 0.128 | 0.052 | 0.306 | 1.004 | N | 0.00 | -1 | -1 | 0.038 |
| J054154.1-021530 | N2023/2024 | 337 | 5:41:54.13 | -02:15:30.3 | 0.050 | 0.122 | 0.053 | 0.320 | 0.885 | N | 0.00 | -1 | -1 | 0.022 |
| J054020.0-022036 | N2023/2024 | 338 | 5:40:20.05 | -02:20:36.2 | 0.050 | 0.057 | 0.040 | 0.245 | 0.073 | N | 0.00 | -1 | -1 | 0.002 |
| J054132.1-014233 | N2023/2024 | 339 | 5:41:32.11 | -01:42:33.4 | 0.050 | 0.071 | 0.036 | 0.279 | 0.352 | N | 0.99 | 0.030 | 0.005 | 0.008 |
| J054110.2-021048 | N2023/2024 | 340 | 5:41:10.29 | -02:10:48.3 | 0.049 | 0.137 | 0.056 | 0.405 | 0.923 | N | 0.00 | -1 | -1 | 0.017 |
| J054225.7-015930 | N2023/2024 | 341 | 5:42:25.74 | -01:59:30.2 | 0.049 | 0.110 | 0.047 | 0.473 | 0.682 | N | 0.66 | 0.049 | 0.065 | 0.029 |
| J054234.5-020639 | N2023/2024 | 342 | 5:42:34.55 | -02:06:39.2 | 0.049 | 0.132 | 0.054 | 0.389 | 1.151 | N | 0.00 | -1 | -1 | 0.040 |
| J054100.8-014251 | N2023/2024 | 343 | 5:41:00.89 | -01:42:51.4 | 0.049 | 0.161 | 0.059 | 0.314 | 0.697 | N | 0.00 | -1 | -1 | 0.048 |
| J054134.7-012742 | N2023/2024 | 344 | 5:41:34.70 | -01:27:42.5 | 0.049 | 0.039 | 0.030 | 0.319 | 0.175 | N | 0.00 | -1 | -1 | 0.000 |
| J054246.7-020215 | N2023/2024 | 345 | 5:42:46.75 | -02:02:15.2 | 0.049 | 0.072 | 0.037 | 0.321 | 0.319 | N | 0.00 | -1 | -1 | 0.019 |
| J054236.3-015636 | N2023/2024 | 346 | 5:42:36.34 | -01:56:36.2 | 0.049 | 0.284 | 0.081 | 0.413 | 1.862 | N | 0.00 | -1 | -1 | 0.081 |
| J054119.5-014030 | N2023/2024 | 347 | 5:41:19.50 | -01:40:30.4 | 0.049 | 0.172 | 0.061 | 0.302 | 1.147 | N | 0.00 | -1 | -1 | 0.039 |
| J054157.9-015306 | N2023/2024 | 348 | 5:41:57.92 | -01:53:06.3 | 0.049 | 0.039 | 0.027 | 0.403 | 0.403 | N | 1.00 | 0.049 | 0.042 | 0.014 |
| J054058.6-011554 | N2023/2024 | 349 | 5:40:58.70 | -01:15:54.7 | 0.048 | 0.038 | 0.030 | 0.407 | 0.247 | N | 0.00 | -1 | -1 | 0.001 |
| J054051.6-014906 | N2023/2024 | 350 | 5:40:51.69 | -01:49:06.3 | 0.048 | 0.088 | 0.043 | 0.269 | 0.343 | N | 0.00 | -1 | -1 | 0.005 |
| J054248.3-015912 | N2023/2024 | 351 | 5:42:48.35 | -01:59:12.2 | 0.048 | 0.071 | 0.044 | 0.330 | 0.221 | N | 0.00 | -1 | -1 | 0.006 |
| J054134.1-014221 | N2023/2024 | 352 | 5:41:34.11 | -01:42:21.4 | 0.048 | 0.095 | 0.042 | 0.289 | 0.227 | N | 0.07 | 0.048 | 0.085 | 0.026 |
| J054130.7-020751 | N2023/2024 | 353 | 5:41:30.71 | -02:07:51.3 | 0.048 | 0.069 | 0.041 | 0.268 | 0.337 | N | 0.00 | -1 | -1 | -0.005 |
| J054206.3-011412 | N2023/2024 | 354 | 5:42:06.30 | -01:14:12.7 | 0.048 | 0.083 | 0.048 | 0.328 | 0.183 | N | 0.00 | -1 | -1 | 0.023 |
| J054143.9-014927 | N2023/2024 | 355 | 5:41:43.91 | -01:49:27.3 | 0.048 | 0.145 | 0.048 | 0.403 | 1.622 | N | 1.00 | 0.048 | 0.154 | 0.069 |
| J054121.1-021909 | N2023/2024 | 356 | 5:41:21.10 | -02:19:09.3 | 0.048 | 0.034 | 0.027 | 0.247 | 0.193 | N | 0.00 | -1 | -1 | 0.008 |
| J054114.2-022339 | N2023/2024 | 357 | 5:41:14.30 | -02:23:39.3 | 0.048 | 0.070 | 0.040 | 0.242 | 0.407 | N | 0.00 | -1 | -1 | 0.023 |
| J054234.1-015927 | N2023/2024 | 358 | 5:42:34.14 | -01:59:27.2 | 0.047 | 0.140 | 0.055 | 0.350 | 0.544 | N | 0.00 | -1 | -1 | 0.027 |
| J054253.3-011624 | N2023/2024 | 359 | 5:42:53.31 | -01:16:24.6 | 0.047 | 0.039 | 0.030 | 0.236 | 0.131 | N | 0.00 | -1 | -1 | 0.002 |
| J054258.1-011533 | N2023/2024 | 360 | 5:42:58.11 | -01:15:33.6 | 0.047 | 0.069 | 0.038 | 0.282 | 0.339 | N | 0.00 | -1 | -1 | 0.016 |
| J054220.9-020400 | N2023/2024 | 361 | 5:42:20.94 | -02:04:00.2 | 0.047 | 0.075 | 0.040 | 0.337 | 0.589 | N | 0.00 | -1 | -1 | 0.010 |
| J054150.1-013636 | N2023/2024 | 362 | 5:41:50.11 | -01:36:36.4 | 0.047 | 0.087 | 0.040 | 0.435 | 0.907 | N | 0.00 | -1 | -1 | 0.033 |
| J054014.2-013721 | N2023/2024 | 363 | 5:40:14.28 | -01:37:21.4 | 0.047 | 0.050 | 0.034 | 0.276 | 0.057 | N | 0.00 | -1 | -1 | 0.015 |
| J054206.1-021757 | N2023/2024 | 364 | 5:42:06.14 | -02:17:57.2 | 0.047 | 0.092 | 0.050 | 0.308 | 0.413 | N | 0.00 | -1 | -1 | 0.013 |
| J054137.5-022254 | N2023/2024 | 365 | 5:41:37.52 | -02:22:54.3 | 0.047 | 0.073 | 0.035 | 0.306 | 0.563 | N | 0.00 | -1 | -1 | 0.026 |
| J054116.6-020939 | N2023/2024 | 366 | 5:41:16.70 | -02:09:39.3 | 0.047 | 0.030 | 0.027 | 0.232 | 0.242 | N | 0.00 | -1 | -1 | 0.007 |
| J054153.5-021903 | N2023/2024 | 367 | 5:41:53.53 | -02:19:03.3 | 0.047 | 0.188 | 0.073 | 0.255 | 0.821 | N | 0.00 | -1 | -1 | 0.033 |
| J054253.5-020645 | N2023/2024 | 368 | 5:42:53.56 | -02:06:45.1 | 0.047 | 0.075 | 0.046 | 0.345 | 0.504 | N | 0.00 | -1 | -1 | -0.001 |
| J054146.9-014218 | N2023/2024 | 369 | 5:41:46.91 | -01:42:18.4 | 0.047 | 0.118 | 0.049 | 0.364 | 1.051 | N | 0.00 | -1 | -1 | 0.045 |
| J054244.9-015321 | N2023/2024 | 370 | 5:42:44.94 | -01:53:21.2 | 0.047 | 0.104 | 0.048 | 0.368 | 0.174 | N | 0.00 | -1 | -1 | 0.013 |
| J054035.6-013357 | N2023/2024 | 371 | 5:40:35.69 | -01:33:57.4 | 0.047 | 0.070 | 0.040 | 0.303 | 0.305 | N | 0.00 | -1 | -1 | 0.013 |
| J054144.3-014524 | N2023/2024 | 372 | 5:41:44.31 | -01:45:24.3 | 0.047 | 0.089 | 0.041 | 0.277 | 0.464 | N | 0.27 | 0.047 | 0.040 | 0.028 |
| J054228.9-014857 | N2023/2024 | 373 | 5:42:28.93 | -01:48:57.3 | 0.047 | 0.061 | 0.042 | 0.328 | 0.237 | N | 0.00 | -1 | -1 | 0.016 |
| J054105.0-013457 | N2023/2024 | 374 | 5:41:05.10 | -01:34:57.4 | 0.046 | 0.150 | 0.057 | 0.297 | 0.584 | N | 0.00 | -1 | -1 | 0.051 |
| J054135.7-012651 | N2023/2024 | 375 | 5:41:35.70 | -01:26:51.5 | 0.046 | 0.122 | 0.053 | 0.401 | 0.622 | N | 0.00 | -1 | -1 | 0.033 |
| J054304.3-013654 | N2023/2024 | 376 | 5:43:04.33 | -01:36:54.2 | 0.046 | 0.070 | 0.039 | 0.354 | 0.144 | N | 0.00 | -1 | -1 | 0.015 |
| J054040.6-015330 | N2023/2024 | 377 | 5:40:40.68 | -01:53:30.3 | 0.046 | 0.053 | 0.034 | 0.286 | 0.109 | N | 0.00 | -1 | -1 | 0.012 |
| J054201.3-015445 | N2023/2024 | 378 | 5:42:01.32 | -01:54:45.3 | 0.046 | 0.090 | 0.042 | 0.399 | 0.655 | N | 1.00 | 0.045 | 0.091 | 0.016 |
| J054251.3-020239 | N2023/2024 | 379 | 5:42:51.36 | -02:02:39.1 | 0.046 | 0.077 | 0.040 | 0.350 | 0.550 | N | 0.00 | -1 | -1 | 0.031 |
| J054305.9-020627 | N2023/2024 | 380 | 5:43:05.97 | -02:06:27.1 | 0.046 | 0.098 | 0.043 | 0.389 | 0.570 | N | 0.00 | -1 | -1 | 0.024 |
| J054240.5-015527 | N2023/2024 | 381 | 5:42:40.54 | -01:55:27.2 | 0.046 | 0.060 | 0.040 | 0.379 | 0.425 | N | 0.00 | -1 | -1 | 0.007 |
| J054035.8-013933 | N2023/2024 | 382 | 5:40:35.89 | -01:39:33.4 | 0.046 | 0.128 | 0.059 | 0.309 | 0.292 | N | 0.00 | -1 | -1 | 0.019 |
| J054229.9-020636 | N2023/2024 | 383 | 5:42:29.95 | -02:06:36.2 | 0.046 | 0.105 | 0.047 | 0.300 | 0.555 | N | 0.00 | -1 | -1 | 0.033 |
| J054158.9-014651 | N2023/2024 | 384 | 5:41:58.92 | -01:46:51.3 | 0.046 | 0.054 | 0.032 | 0.358 | 0.362 | N | 0.00 | -1 | -1 | 0.006 |
| J054108.2-013924 | N2023/2024 | 385 | 5:41:08.30 | -01:39:24.4 | 0.046 | 0.147 | 0.061 | 0.271 | 0.425 | N | 0.00 | -1 | -1 | 0.011 |
| J054035.0-013651 | N2023/2024 | 386 | 5:40:35.09 | -01:36:51.4 | 0.046 | 0.064 | 0.038 | 0.244 | 0.156 | N | 0.00 | -1 | -1 | 0.006 |
| J054223.3-013515 | N2023/2024 | 387 | 5:42:23.32 | -01:35:15.4 | 0.045 | 0.161 | 0.059 | 0.410 | 1.018 | N | 0.00 | -1 | -1 | 0.038 |
| J054111.4-022757 | N2023/2024 | 388 | 5:41:11.49 | -02:27:57.3 | 0.045 | 0.038 | 0.032 | 0.265 | 0.207 | N | 0.00 | -1 | -1 | 0.007 |
| J054153.9-022300 | N2023/2024 | 389 | 5:41:53.93 | -02:23:00.3 | 0.045 | 0.118 | 0.057 | 0.341 | 0.493 | N | 0.00 | -1 | -1 | 0.003 |
| J054101.2-011306 | N2023/2024 | 390 | 5:41:01.30 | -01:13:06.8 | 0.045 | 0.071 | 0.040 | 0.576 | 0.387 | N | 0.00 | -1 | -1 | 0.016 |
| J054207.7-014730 | N2023/2024 | 391 | 5:42:07.72 | -01:47:30.3 | 0.045 | 0.087 | 0.044 | 0.322 | 0.473 | N | 0.00 | -1 | -1 | 0.010 |
| J054201.9-011354 | N2023/2024 | 392 | 5:42:01.90 | -01:13:54.7 | 0.045 | 0.106 | 0.044 | 0.384 | 0.311 | N | 0.00 | -1 | -1 | 0.041 |
| J054220.3-020245 | N2023/2024 | 393 | 5:42:20.34 | -02:02:45.2 | 0.045 | 0.070 | 0.042 | 0.314 | 0.390 | N | 0.00 | -1 | -1 | 0.013 |
| J054254.1-020542 | N2023/2024 | 394 | 5:42:54.16 | -02:05:42.1 | 0.045 | 0.134 | 0.054 | 0.372 | 0.807 | N | 0.00 | -1 | -1 | 0.049 |
| J054152.1-020303 | N2023/2024 | 395 | 5:41:52.12 | -02:03:03.3 | 0.045 | 0.151 | 0.056 | 0.285 | 0.701 | N | 1.00 | 0.046 | 0.150 | 0.049 |
| J054140.3-021342 | N2023/2024 | 396 | 5:41:40.32 | -02:13:42.3 | 0.045 | 0.170 | 0.056 | 0.325 | 0.784 | N | 0.00 | -1 | -1 | 0.034 |
| J054128.1-013848 | N2023/2024 | 397 | 5:41:28.10 | -01:38:48.4 | 0.045 | 0.262 | 0.070 | 0.327 | 1.289 | N | 0.00 | -1 | -1 | 0.063 |
| J054220.7-015336 | N2023/2024 | 398 | 5:42:20.73 | -01:53:36.3 | 0.045 | 0.154 | 0.065 | 0.363 | 1.314 | N | 0.00 | -1 | -1 | 0.015 |
| J054045.2-014545 | N2023/2024 | 399 | 5:40:45.29 | -01:45:45.3 | 0.045 | 0.076 | 0.043 | 0.293 | 0.411 | N | 0.00 | -1 | -1 | 0.005 |
| J054111.2-021742 | N2023/2024 | 400 | 5:41:11.30 | -02:17:42.3 | 0.045 | 0.110 | 0.058 | 0.230 | 0.168 | N | 0.00 | -1 | -1 | 0.008 |
| J054151.5-014609 | N2023/2024 | 401 | 5:41:51.51 | -01:46:09.3 | 0.045 | 0.046 | 0.032 | 0.254 | 0.133 | N | 0.00 | -1 | -1 | 0.008 |
| J054126.5-022957 | N2023/2024 | 402 | 5:41:26.51 | -02:29:57.3 | 0.044 | 0.050 | 0.035 | 0.233 | 0.181 | N | 0.00 | -1 | -1 | 0.006 |
| J054228.1-014954 | N2023/2024 | 403 | 5:42:28.13 | -01:49:54.3 | 0.044 | 0.072 | 0.046 | 0.312 | 0.166 | N | 0.00 | -1 | -1 | 0.001 |
| J054128.3-014921 | N2023/2024 | 404 | 5:41:28.30 | -01:49:21.3 | 0.044 | 0.074 | 0.043 | 0.240 | 0.204 | N | 1.00 | 0.038 | 0.041 | 0.023 |
| J054316.9-011221 | N2023/2024 | 405 | 5:43:16.90 | -01:12:21.6 | 0.044 | 0.075 | 0.040 | 0.362 | 0.405 | N | 0.00 | -1 | -1 | 0.024 |
| J054052.2-013718 | N2023/2024 | 406 | 5:40:52.29 | -01:37:18.4 | 0.044 | 0.029 | 0.029 | 0.192 | 0.084 | N | 0.00 | -1 | -1 | 0.006 |
| J054011.2-013924 | N2023/2024 | 407 | 5:40:11.28 | -01:39:24.3 | 0.044 | 0.048 | 0.034 | 0.332 | 0.222 | N | 0.00 | -1 | -1 | 0.009 |
| J054050.6-021233 | N2023/2024 | 408 | 5:40:50.68 | -02:12:33.3 | 0.044 | 0.088 | 0.041 | 0.221 | 0.144 | N | 0.00 | -1 | -1 | 0.023 |
| J054155.1-022342 | N2023/2024 | 409 | 5:41:55.13 | -02:23:42.3 | 0.044 | 0.137 | 0.056 | 0.256 | 0.680 | N | 0.00 | -1 | -1 | 0.034 |
| J054251.9-012012 | N2023/2024 | 410 | 5:42:51.91 | -01:20:12.5 | 0.044 | 0.031 | 0.030 | 0.238 | 0.143 | N | 0.00 | -1 | -1 | 0.007 |
| J054111.4-022745 | N2023/2024 | 411 | 5:41:11.49 | -02:27:45.3 | 0.044 | 0.046 | 0.033 | 0.196 | 0.262 | N | 0.00 | -1 | -1 | -0.004 |
| J054059.4-013600 | N2023/2024 | 412 | 5:40:59.49 | -01:36:00.4 | 0.044 | 0.186 | 0.066 | 0.273 | 0.924 | N | 0.00 | -1 | -1 | 0.040 |
| J054146.1-022348 | N2023/2024 | 413 | 5:41:46.12 | -02:23:48.3 | 0.044 | 0.054 | 0.039 | 0.244 | 0.410 | N | 0.00 | -1 | -1 | 0.005 |
| J054135.9-020824 | N2023/2024 | 414 | 5:41:35.91 | -02:08:24.3 | 0.044 | 0.204 | 0.064 | 0.253 | 1.114 | N | 0.00 | -1 | -1 | 0.041 |
| J054213.7-021312 | N2023/2024 | 415 | 5:42:13.74 | -02:13:12.2 | 0.044 | 0.066 | 0.042 | 0.255 | 0.259 | N | 0.00 | -1 | -1 | 0.007 |
| J054147.1-013145 | N2023/2024 | 416 | 5:41:47.11 | -01:31:45.5 | 0.044 | 0.099 | 0.044 | 0.413 | 0.600 | N | 0.00 | -1 | -1 | 0.013 |
| J054155.1-022130 | N2023/2024 | 417 | 5:41:55.13 | -02:21:30.3 | 0.044 | 0.059 | 0.040 | 0.239 | 0.313 | N | 0.00 | -1 | -1 | 0.009 |
| J054130.1-012436 | N2023/2024 | 418 | 5:41:30.10 | -01:24:36.6 | 0.044 | 0.117 | 0.052 | 0.355 | 0.860 | N | 0.00 | -1 | -1 | 0.016 |
| J054332.1-011445 | N2023/2024 | 419 | 5:43:32.10 | -01:14:45.5 | 0.044 | 0.035 | 0.028 | 0.304 | 0.150 | N | 0.00 | -1 | -1 | 0.012 |
| J054035.4-015057 | N2023/2024 | 420 | 5:40:35.48 | -01:50:57.3 | 0.044 | 0.038 | 0.032 | 0.287 | 0.156 | N | 0.00 | -1 | -1 | 0.007 |
| J054254.1-014800 | N2023/2024 | 421 | 5:42:54.14 | -01:48:00.2 | 0.043 | 0.107 | 0.058 | 0.368 | 0.313 | N | 0.00 | -1 | -1 | -0.001 |
| J054200.9-022030 | N2023/2024 | 422 | 5:42:00.93 | -02:20:30.3 | 0.043 | 0.040 | 0.032 | 0.206 | 0.161 | N | 0.00 | -1 | -1 | 0.001 |
| J054045.0-013751 | N2023/2024 | 423 | 5:40:45.09 | -01:37:51.4 | 0.043 | 0.033 | 0.031 | 0.341 | 0.140 | N | 0.00 | -1 | -1 | 0.005 |
| J054223.7-013330 | N2023/2024 | 424 | 5:42:23.72 | -01:33:30.4 | 0.043 | 0.105 | 0.048 | 0.384 | 0.712 | N | 0.00 | -1 | -1 | 0.025 |
| J054230.9-014654 | N2023/2024 | 425 | 5:42:30.93 | -01:46:54.3 | 0.043 | 0.063 | 0.039 | 0.326 | 0.126 | N | 0.00 | -1 | -1 | 0.005 |
| J054413.8-011209 | N2023/2024 | 426 | 5:44:13.90 | -01:12:09.4 | 0.043 | 0.080 | 0.044 | 0.357 | 0.454 | N | 0.00 | -1 | -1 | 0.004 |
| J054110.4-015042 | N2023/2024 | 427 | 5:41:10.50 | -01:50:42.3 | 0.043 | 0.036 | 0.027 | 0.261 | -0.010 | N | 1.00 | 0.039 | 0.025 | 0.004 |
| J054012.2-013854 | N2023/2024 | 428 | 5:40:12.28 | -01:38:54.3 | 0.043 | 0.127 | 0.058 | 0.290 | 0.089 | N | 0.00 | -1 | -1 | 0.002 |
| J054356.8-011218 | N2023/2024 | 429 | 5:43:56.90 | -01:12:18.5 | 0.043 | 0.028 | 0.028 | 0.276 | 0.075 | N | 0.00 | -1 | -1 | 0.002 |
| J054041.0-014736 | N2023/2024 | 430 | 5:40:41.08 | -01:47:36.3 | 0.043 | 0.047 | 0.033 | 0.267 | 0.198 | N | 0.00 | -1 | -1 | 0.004 |
| J054344.5-011436 | N2023/2024 | 431 | 5:43:44.50 | -01:14:36.5 | 0.043 | 0.166 | 0.065 | 0.370 | 0.757 | N | 0.00 | -1 | -1 | 0.010 |
| J054101.4-020327 | N2023/2024 | 432 | 5:41:01.49 | -02:03:27.3 | 0.043 | 0.152 | 0.064 | 0.240 | 0.555 | N | 0.00 | -1 | -1 | 0.011 |
| J054057.2-020054 | N2023/2024 | 433 | 5:40:57.29 | -02:00:54.3 | 0.043 | 0.074 | 0.041 | 0.273 | 0.294 | N | 0.00 | -1 | -1 | 0.027 |
| J054118.5-021812 | N2023/2024 | 434 | 5:41:18.50 | -02:18:12.3 | 0.043 | 0.087 | 0.045 | 0.303 | 0.517 | Y | 0.00 | -1 | -1 | 0.002 |
| J054420.6-011142 | N2023/2024 | 435 | 5:44:20.69 | -01:11:42.4 | 0.043 | 0.097 | 0.048 | 0.332 | 0.341 | N | 0.00 | -1 | -1 | 0.023 |
| J054150.9-022933 | N2023/2024 | 436 | 5:41:50.93 | -02:29:33.3 | 0.043 | 0.115 | 0.052 | 0.258 | 0.208 | N | 0.00 | -1 | -1 | 0.007 |
| J054123.2-012009 | N2023/2024 | 437 | 5:41:23.30 | -01:20:09.6 | 0.043 | 0.114 | 0.054 | 0.363 | 0.538 | N | 0.00 | -1 | -1 | 0.018 |
| J054206.9-014336 | N2023/2024 | 438 | 5:42:06.92 | -01:43:36.3 | 0.043 | 0.057 | 0.038 | 0.315 | 0.029 | N | 0.00 | -1 | -1 | 0.018 |
| J054107.2-022239 | N2023/2024 | 439 | 5:41:07.29 | -02:22:39.3 | 0.043 | 0.117 | 0.055 | 0.321 | 0.638 | N | 0.00 | -1 | -1 | -0.003 |
| J054106.6-020957 | N2023/2024 | 440 | 5:41:06.69 | -02:09:57.3 | 0.042 | 0.145 | 0.062 | 0.278 | 0.383 | N | 0.00 | -1 | -1 | 0.040 |
| J054147.1-014145 | N2023/2024 | 441 | 5:41:47.11 | -01:41:45.4 | 0.042 | 0.062 | 0.036 | 0.291 | 0.223 | N | 0.00 | -1 | -1 | 0.021 |
| J054117.0-011754 | N2023/2024 | 442 | 5:41:17.10 | -01:17:54.7 | 0.042 | 0.142 | 0.060 | 0.394 | 0.766 | N | 0.00 | -1 | -1 | 0.009 |
| J054058.0-011624 | N2023/2024 | 443 | 5:40:58.10 | -01:16:24.7 | 0.042 | 0.134 | 0.058 | 0.437 | 0.767 | N | 0.00 | -1 | -1 | 0.024 |
| J054125.3-021006 | N2023/2024 | 444 | 5:41:25.30 | -02:10:06.3 | 0.042 | 0.118 | 0.052 | 0.266 | 0.511 | N | 0.00 | -1 | -1 | 0.035 |
| J054258.7-011309 | N2023/2024 | 445 | 5:42:58.70 | -01:13:09.7 | 0.042 | 0.111 | 0.058 | 0.271 | 0.474 | N | 0.00 | -1 | -1 | 0.013 |
| J054103.0-020718 | N2023/2024 | 446 | 5:41:03.09 | -02:07:18.3 | 0.042 | 0.069 | 0.042 | 0.210 | 0.205 | N | 0.00 | -1 | -1 | 0.013 |
| J054103.6-014939 | N2023/2024 | 447 | 5:41:03.69 | -01:49:39.3 | 0.042 | 0.031 | 0.028 | 0.314 | 0.121 | N | 1.00 | 0.038 | 0.025 | 0.002 |
| J054106.2-023315 | N2023/2024 | 448 | 5:41:06.29 | -02:33:15.3 | 0.042 | 0.062 | 0.040 | 0.287 | 0.076 | N | 0.00 | -1 | -1 | 0.011 |
| J053946.8-014336 | N2023/2024 | 449 | 5:39:46.86 | -01:43:36.2 | 0.042 | 0.111 | 0.054 | 0.249 | 0.017 | N | 0.00 | -1 | -1 | 0.012 |
| J054255.1-015703 | N2023/2024 | 450 | 5:42:55.15 | -01:57:03.1 | 0.042 | 0.089 | 0.049 | 0.355 | 0.432 | N | 0.00 | -1 | -1 | 0.002 |
| J054136.3-014630 | N2023/2024 | 451 | 5:41:36.31 | -01:46:30.3 | 0.042 | 0.064 | 0.036 | 0.275 | 0.306 | N | 1.00 | 0.042 | 0.063 | 0.018 |
| J054206.5-015736 | N2023/2024 | 452 | 5:42:06.53 | -01:57:36.3 | 0.042 | 0.083 | 0.048 | 0.324 | -0.013 | N | 1.00 | 0.036 | 0.057 | 0.013 |
| J054111.2-014939 | N2023/2024 | 453 | 5:41:11.30 | -01:49:39.3 | 0.042 | 0.054 | 0.036 | 0.260 | 0.156 | N | 1.00 | 0.040 | 0.058 | 0.005 |
| J054159.5-022603 | N2023/2024 | 454 | 5:41:59.54 | -02:26:03.3 | 0.042 | 0.066 | 0.045 | 0.228 | 0.286 | N | 0.00 | -1 | -1 | 0.004 |
| J054227.3-015248 | N2023/2024 | 455 | 5:42:27.34 | -01:52:48.2 | 0.042 | 0.057 | 0.038 | 0.307 | 0.129 | N | 0.00 | -1 | -1 | 0.007 |
| J054234.9-014827 | N2023/2024 | 456 | 5:42:34.93 | -01:48:27.2 | 0.042 | 0.105 | 0.053 | 0.355 | 0.188 | N | 0.00 | -1 | -1 | 0.007 |
| J054141.9-014636 | N2023/2024 | 457 | 5:41:41.91 | -01:46:36.3 | 0.042 | 0.053 | 0.033 | 0.256 | 0.351 | N | 1.00 | 0.039 | 0.056 | 0.009 |
| J054225.5-014745 | N2023/2024 | 458 | 5:42:25.53 | -01:47:45.3 | 0.042 | 0.112 | 0.052 | 0.326 | 0.189 | N | 0.00 | -1 | -1 | 0.004 |
| J054319.3-020814 | N2023/2024 | 459 | 5:43:19.38 | -02:08:15.0 | 0.042 | 0.113 | 0.055 | 0.453 | 0.888 | N | 0.00 | -1 | -1 | 0.032 |
| J054322.9-012015 | N2023/2024 | 460 | 5:43:22.91 | -01:20:15.4 | 0.042 | 0.086 | 0.046 | 0.345 | 0.318 | N | 0.00 | -1 | -1 | 0.005 |
| J054400.0-010503 | N2023/2024 | 461 | 5:44:00.08 | -01:05:03.7 | 0.042 | 0.047 | 0.032 | 0.290 | 0.146 | N | 0.00 | -1 | -1 | 0.016 |
| J054146.7-014600 | N2023/2024 | 462 | 5:41:46.71 | -01:46:00.3 | 0.041 | 0.152 | 0.055 | 0.335 | 1.014 | N | 0.11 | 0.041 | 0.123 | 0.050 |
| J054237.1-012242 | N2023/2024 | 463 | 5:42:37.11 | -01:22:42.5 | 0.041 | 0.060 | 0.035 | 0.318 | 0.362 | N | 0.00 | -1 | -1 | 0.017 |
| J054249.7-011503 | N2023/2024 | 464 | 5:42:49.70 | -01:15:03.6 | 0.041 | 0.162 | 0.060 | 0.303 | 0.891 | N | 0.00 | -1 | -1 | 0.039 |
| J054215.1-020218 | N2023/2024 | 465 | 5:42:15.13 | -02:02:18.2 | 0.041 | 0.085 | 0.046 | 0.306 | 0.445 | N | 0.94 | 0.036 | 0.048 | 0.005 |
| J054031.6-014048 | N2023/2024 | 466 | 5:40:31.68 | -01:40:48.4 | 0.041 | 0.032 | 0.029 | 0.204 | 0.017 | N | 0.00 | -1 | -1 | 0.004 |
| J054154.7-022733 | N2023/2024 | 467 | 5:41:54.73 | -02:27:33.3 | 0.041 | 0.084 | 0.048 | 0.242 | 0.131 | N | 0.00 | -1 | -1 | 0.016 |
| J054042.8-014357 | N2023/2024 | 468 | 5:40:42.89 | -01:43:57.4 | 0.041 | 0.055 | 0.039 | 0.252 | 0.102 | N | 0.00 | -1 | -1 | 0.003 |
| J054048.0-020112 | N2023/2024 | 469 | 5:40:48.08 | -02:01:12.3 | 0.041 | 0.061 | 0.041 | 0.264 | 0.211 | N | 0.00 | -1 | -1 | 0.005 |
| J054232.3-020403 | N2023/2024 | 470 | 5:42:32.35 | -02:04:03.2 | 0.041 | 0.060 | 0.039 | 0.320 | 0.199 | N | 0.00 | -1 | -1 | 0.013 |
| J054241.5-014933 | N2023/2024 | 471 | 5:42:41.54 | -01:49:33.2 | 0.041 | 0.052 | 0.036 | 0.410 | 0.010 | N | 0.00 | -1 | -1 | 0.005 |
| J054236.1-011542 | N2023/2024 | 472 | 5:42:36.10 | -01:15:42.6 | 0.041 | 0.085 | 0.044 | 0.255 | 0.254 | N | 0.00 | -1 | -1 | 0.025 |
| J054053.2-021130 | N2023/2024 | 473 | 5:40:53.28 | -02:11:30.3 | 0.041 | 0.111 | 0.054 | 0.253 | 0.364 | N | 0.00 | -1 | -1 | 0.018 |
| J054201.1-021442 | N2023/2024 | 474 | 5:42:01.13 | -02:14:42.3 | 0.041 | 0.086 | 0.046 | 0.253 | 0.119 | N | 0.00 | -1 | -1 | 0.010 |
| J054218.9-014248 | N2023/2024 | 475 | 5:42:18.92 | -01:42:48.3 | 0.041 | 0.082 | 0.048 | 0.268 | 0.335 | N | 0.00 | -1 | -1 | 0.006 |
| J054143.9-021218 | N2023/2024 | 476 | 5:41:43.92 | -02:12:18.3 | 0.041 | 0.081 | 0.043 | 0.274 | 0.376 | N | 0.00 | -1 | -1 | 0.002 |
| J054408.9-012306 | N2023/2024 | 477 | 5:44:08.92 | -01:23:06.2 | 0.040 | 0.041 | 0.034 | 0.275 | 0.193 | N | 0.00 | -1 | -1 | 0.008 |
| J054201.5-015327 | N2023/2024 | 478 | 5:42:01.52 | -01:53:27.3 | 0.040 | 0.031 | 0.029 | 0.333 | 0.370 | N | 1.00 | 0.042 | 0.034 | 0.003 |
| J054023.8-014100 | N2023/2024 | 479 | 5:40:23.88 | -01:41:00.3 | 0.040 | 0.038 | 0.030 | 0.222 | 0.192 | N | 0.00 | -1 | -1 | -0.003 |
| J054157.9-013136 | N2023/2024 | 480 | 5:41:57.91 | -01:31:36.5 | 0.040 | 0.047 | 0.032 | 0.362 | 0.376 | N | 0.00 | -1 | -1 | 0.001 |
| J054147.5-020336 | N2023/2024 | 481 | 5:41:47.52 | -02:03:36.3 | 0.040 | 0.088 | 0.051 | 0.261 | 0.504 | N | 1.00 | 0.039 | 0.084 | 0.011 |
| J054114.4-020954 | N2023/2024 | 482 | 5:41:14.50 | -02:09:54.3 | 0.040 | 0.046 | 0.034 | 0.219 | 0.224 | N | 0.00 | -1 | -1 | 0.004 |
| J054156.3-013136 | N2023/2024 | 483 | 5:41:56.31 | -01:31:36.5 | 0.040 | 0.032 | 0.030 | 0.303 | 0.115 | N | 0.00 | -1 | -1 | -0.002 |
| J054150.3-021433 | N2023/2024 | 484 | 5:41:50.32 | -02:14:33.3 | 0.040 | 0.046 | 0.032 | 0.198 | 0.203 | N | 0.00 | -1 | -1 | 0.002 |
| J054104.0-022151 | N2023/2024 | 485 | 5:41:04.09 | -02:21:51.3 | 0.040 | 0.050 | 0.038 | 0.266 | 0.123 | N | 0.00 | -1 | -1 | 0.005 |
| J054252.9-015915 | N2023/2024 | 486 | 5:42:52.95 | -01:59:15.1 | 0.040 | 0.087 | 0.047 | 0.338 | 0.452 | N | 0.00 | -1 | -1 | 0.013 |
| J054224.5-015115 | N2023/2024 | 487 | 5:42:24.53 | -01:51:15.3 | 0.040 | 0.069 | 0.045 | 0.342 | 0.118 | N | 0.00 | -1 | -1 | 0.003 |
| J054202.5-015212 | N2023/2024 | 488 | 5:42:02.52 | -01:52:12.3 | 0.040 | 0.135 | 0.062 | 0.404 | 0.794 | N | 0.81 | 0.037 | 0.087 | 0.017 |
| J054228.1-020633 | N2023/2024 | 489 | 5:42:28.15 | -02:06:33.2 | 0.040 | 0.022 | 0.023 | 0.285 | 0.242 | N | 0.00 | -1 | -1 | 0.002 |
| J054151.1-021200 | N2023/2024 | 490 | 5:41:51.12 | -02:12:00.3 | 0.040 | 0.040 | 0.029 | 0.260 | 0.149 | N | 0.00 | -1 | -1 | 0.006 |
| J054331.9-011354 | N2023/2024 | 491 | 5:43:31.90 | -01:13:54.5 | 0.039 | 0.058 | 0.041 | 0.351 | 0.093 | N | 0.00 | -1 | -1 | 0.007 |
| J054243.9-020418 | N2023/2024 | 492 | 5:42:43.95 | -02:04:18.2 | 0.039 | 0.061 | 0.041 | 0.303 | 0.181 | N | 0.00 | -1 | -1 | -0.010 |
| J054257.5-014354 | N2023/2024 | 493 | 5:42:57.54 | -01:43:54.2 | 0.039 | 0.042 | 0.034 | 0.326 | 0.174 | N | 0.00 | -1 | -1 | 0.002 |
| J054223.5-015618 | N2023/2024 | 494 | 5:42:23.54 | -01:56:18.2 | 0.039 | 0.066 | 0.039 | 0.401 | 0.197 | N | 0.00 | -1 | -1 | 0.002 |
| J054111.8-015933 | N2023/2024 | 495 | 5:41:11.90 | -01:59:33.3 | 0.039 | 0.110 | 0.055 | 0.272 | 0.529 | N | 0.00 | -1 | -1 | 0.006 |
| J054108.0-014042 | N2023/2024 | 496 | 5:41:08.10 | -01:40:42.4 | 0.039 | 0.095 | 0.048 | 0.293 | 0.345 | N | 0.00 | -1 | -1 | 0.025 |
| J054232.7-014433 | N2023/2024 | 497 | 5:42:32.73 | -01:44:33.3 | 0.039 | 0.077 | 0.047 | 0.315 | 0.325 | N | 0.00 | -1 | -1 | 0.021 |
| J054141.5-020112 | N2023/2024 | 498 | 5:41:41.51 | -02:01:12.3 | 0.039 | 0.022 | 0.026 | 0.193 | -0.036 | N | 1.00 | 0.035 | 0.017 | -0.001 |
| J054300.1-014900 | N2023/2024 | 499 | 5:43:00.15 | -01:49:00.2 | 0.039 | 0.081 | 0.049 | 0.355 | 0.286 | N | 0.00 | -1 | -1 | -0.003 |
| J054143.1-022600 | N2023/2024 | 500 | 5:41:43.12 | -02:26:00.3 | 0.039 | 0.093 | 0.052 | 0.259 | 0.357 | N | 0.00 | -1 | -1 | 0.013 |
| J054110.4-020045 | N2023/2024 | 501 | 5:41:10.50 | -02:00:45.3 | 0.039 | 0.061 | 0.040 | 0.235 | 0.187 | N | 0.00 | -1 | -1 | 0.005 |
| J054205.3-021100 | N2023/2024 | 502 | 5:42:05.33 | -02:11:00.3 | 0.039 | 0.087 | 0.050 | 0.226 | 0.414 | N | 0.00 | -1 | -1 | 0.004 |
| J054121.9-020330 | N2023/2024 | 503 | 5:41:21.90 | -02:03:30.3 | 0.039 | 0.147 | 0.062 | 0.257 | 0.165 | N | 0.00 | -1 | -1 | 0.027 |
| J054228.3-020915 | N2023/2024 | 504 | 5:42:28.35 | -02:09:15.2 | 0.039 | 0.075 | 0.047 | 0.303 | 0.114 | N | 0.00 | -1 | -1 | 0.004 |
| J054207.9-015109 | N2023/2024 | 505 | 5:42:07.92 | -01:51:09.3 | 0.039 | 0.073 | 0.046 | 0.345 | 0.194 | N | 0.00 | -1 | -1 | 0.001 |
| J054015.8-014015 | N2023/2024 | 506 | 5:40:15.88 | -01:40:15.3 | 0.039 | 0.068 | 0.042 | 0.243 | 0.149 | N | 0.00 | -1 | -1 | 0.001 |
| J054206.3-014100 | N2023/2024 | 507 | 5:42:06.32 | -01:41:00.4 | 0.038 | 0.061 | 0.040 | 0.275 | 0.347 | N | 0.00 | -1 | -1 | 0.003 |
| J054049.6-020339 | N2023/2024 | 508 | 5:40:49.68 | -02:03:39.3 | 0.038 | 0.105 | 0.051 | 0.218 | 0.134 | N | 0.00 | -1 | -1 | 0.020 |
| J054056.0-020642 | N2023/2024 | 509 | 5:40:56.08 | -02:06:42.3 | 0.038 | 0.067 | 0.042 | 0.225 | 0.385 | N | 0.00 | -1 | -1 | 0.003 |
| J054132.3-020957 | N2023/2024 | 510 | 5:41:32.31 | -02:09:57.3 | 0.038 | 0.038 | 0.034 | 0.273 | 0.234 | N | 0.00 | -1 | -1 | 0.001 |
| J054111.4-020312 | N2023/2024 | 511 | 5:41:11.50 | -02:03:12.3 | 0.038 | 0.184 | 0.069 | 0.267 | 0.534 | N | 0.00 | -1 | -1 | 0.026 |
| J054105.6-023224 | N2023/2024 | 512 | 5:41:05.69 | -02:32:24.3 | 0.038 | 0.048 | 0.034 | 0.266 | 0.096 | N | 0.00 | -1 | -1 | 0.010 |
| J054210.9-020712 | N2023/2024 | 513 | 5:42:10.94 | -02:07:12.2 | 0.038 | 0.065 | 0.042 | 0.211 | 0.009 | N | 0.00 | -1 | -1 | 0.017 |
| J054221.5-014800 | N2023/2024 | 514 | 5:42:21.53 | -01:48:00.3 | 0.038 | 0.067 | 0.044 | 0.424 | 0.320 | N | 0.00 | -1 | -1 | 0.001 |
| J054214.3-020733 | N2023/2024 | 515 | 5:42:14.34 | -02:07:33.2 | 0.038 | 0.105 | 0.051 | 0.258 | 0.665 | N | 0.00 | -1 | -1 | 0.023 |
| J054019.6-013951 | N2023/2024 | 516 | 5:40:19.68 | -01:39:51.3 | 0.037 | 0.038 | 0.031 | 0.239 | 0.040 | N | 0.00 | -1 | -1 | 0.004 |
| J054155.9-014021 | N2023/2024 | 517 | 5:41:55.91 | -01:40:21.4 | 0.037 | 0.027 | 0.027 | 0.256 | 0.107 | N | 0.00 | -1 | -1 | -0.001 |
| J054320.7-012145 | N2023/2024 | 518 | 5:43:20.71 | -01:21:45.4 | 0.037 | 0.054 | 0.037 | 0.315 | 0.107 | N | 0.00 | -1 | -1 | 0.014 |
| J054053.4-015754 | N2023/2024 | 519 | 5:40:53.49 | -01:57:54.3 | 0.037 | 0.054 | 0.037 | 0.244 | 0.244 | N | 0.00 | -1 | -1 | 0.014 |
| J054146.7-020854 | N2023/2024 | 520 | 5:41:46.72 | -02:08:54.3 | 0.037 | 0.077 | 0.045 | 0.243 | 0.406 | N | 0.00 | -1 | -1 | 0.018 |
| J054113.6-013809 | N2023/2024 | 521 | 5:41:13.70 | -01:38:09.4 | 0.037 | 0.045 | 0.039 | 0.298 | 0.175 | N | 0.00 | -1 | -1 | 0.004 |
| J054231.9-015015 | N2023/2024 | 522 | 5:42:31.94 | -01:50:15.2 | 0.037 | 0.039 | 0.033 | 0.267 | 0.081 | N | 0.00 | -1 | -1 | -0.001 |
| J054145.7-021039 | N2023/2024 | 523 | 5:41:45.72 | -02:10:39.3 | 0.037 | 0.095 | 0.056 | 0.284 | 0.650 | N | 0.00 | -1 | -1 | -0.001 |
| J054101.0-012639 | N2023/2024 | 524 | 5:41:01.10 | -01:26:39.5 | 0.037 | 0.070 | 0.044 | 0.428 | 0.300 | N | 0.00 | -1 | -1 | 0.002 |
| J054125.9-012336 | N2023/2024 | 525 | 5:41:25.90 | -01:23:36.6 | 0.037 | 0.105 | 0.056 | 0.402 | 0.626 | N | 0.00 | -1 | -1 | 0.006 |
| J054216.5-015200 | N2023/2024 | 526 | 5:42:16.53 | -01:52:00.3 | 0.036 | 0.066 | 0.045 | 0.351 | 0.222 | N | 0.00 | -1 | -1 | 0.005 |
| J054204.3-014636 | N2023/2024 | 527 | 5:42:04.32 | -01:46:36.3 | 0.036 | 0.114 | 0.057 | 0.359 | 0.425 | N | 0.00 | -1 | -1 | 0.012 |
| J054203.3-013027 | N2023/2024 | 528 | 5:42:03.31 | -01:30:27.5 | 0.036 | 0.047 | 0.040 | 0.348 | 0.325 | N | 0.00 | -1 | -1 | -0.001 |
| J054104.0-021427 | N2023/2024 | 529 | 5:41:04.09 | -02:14:27.3 | 0.036 | 0.095 | 0.052 | 0.231 | 0.317 | N | 0.00 | -1 | -1 | 0.014 |
| J054137.3-020648 | N2023/2024 | 530 | 5:41:37.31 | -02:06:48.3 | 0.036 | 0.033 | 0.030 | 0.212 | 0.276 | N | 0.00 | -1 | -1 | 0.007 |
| J054102.8-020527 | N2023/2024 | 531 | 5:41:02.89 | -02:05:27.3 | 0.036 | 0.053 | 0.039 | 0.229 | 0.240 | N | 0.00 | -1 | -1 | -0.004 |
| J054313.7-011306 | N2023/2024 | 532 | 5:43:13.70 | -01:13:06.6 | 0.036 | 0.036 | 0.033 | 0.304 | 0.204 | N | 0.00 | -1 | -1 | 0.007 |
| J054228.7-014103 | N2023/2024 | 533 | 5:42:28.73 | -01:41:03.3 | 0.036 | 0.041 | 0.036 | 0.284 | 0.126 | N | 0.00 | -1 | -1 | 0.002 |
| J054337.7-011703 | N2023/2024 | 534 | 5:43:37.71 | -01:17:03.5 | 0.036 | 0.044 | 0.033 | 0.287 | 0.204 | N | 0.00 | -1 | -1 | 0.007 |
| J054244.5-012242 | N2023/2024 | 535 | 5:42:44.51 | -01:22:42.5 | 0.035 | 0.062 | 0.039 | 0.342 | 0.485 | N | 0.00 | -1 | -1 | 0.012 |
| J054256.5-020124 | N2023/2024 | 536 | 5:42:56.56 | -02:01:24.1 | 0.035 | 0.053 | 0.038 | 0.308 | 0.263 | N | 0.00 | -1 | -1 | 0.001 |
| J054209.5-013603 | N2023/2024 | 537 | 5:42:09.52 | -01:36:03.4 | 0.035 | 0.116 | 0.054 | 0.342 | 0.624 | N | 0.00 | -1 | -1 | 0.024 |
| J054312.1-011200 | N2023/2024 | 538 | 5:43:12.10 | -01:12:00.6 | 0.035 | 0.078 | 0.045 | 0.293 | 0.262 | N | 0.00 | -1 | -1 | -0.002 |
| J054218.5-014006 | N2023/2024 | 539 | 5:42:18.52 | -01:40:06.3 | 0.035 | 0.038 | 0.034 | 0.303 | 0.120 | N | 0.00 | -1 | -1 | 0.002 |
| J054201.1-012233 | N2023/2024 | 540 | 5:42:01.11 | -01:22:33.6 | 0.035 | 0.031 | 0.031 | 0.281 | 0.023 | N | 0.00 | -1 | -1 | 0.002 |
| J054240.1-011836 | N2023/2024 | 541 | 5:42:40.11 | -01:18:36.6 | 0.035 | 0.267 | 0.079 | 0.390 | 2.094 | N | 0.00 | -1 | -1 | 0.063 |
| J054126.7-013657 | N2023/2024 | 542 | 5:41:26.70 | -01:36:57.4 | 0.034 | 0.058 | 0.042 | 0.260 | 0.258 | N | 0.00 | -1 | -1 | -0.001 |
| J054059.0-014148 | N2023/2024 | 543 | 5:40:59.09 | -01:41:48.4 | 0.034 | 0.063 | 0.045 | 0.346 | 0.235 | N | 0.00 | -1 | -1 | 0.002 |
| J054236.7-015151 | N2023/2024 | 544 | 5:42:36.74 | -01:51:51.2 | 0.034 | 0.075 | 0.046 | 0.325 | 0.163 | N | 0.00 | -1 | -1 | 0.015 |
| J054139.1-020033 | N2023/2024 | 545 | 5:41:39.11 | -02:00:33.3 | 0.034 | 0.057 | 0.041 | 0.225 | 0.101 | N | 1.00 | 0.033 | 0.043 | 0.007 |
| J054245.7-015936 | N2023/2024 | 546 | 5:42:45.75 | -01:59:36.2 | 0.034 | 0.072 | 0.047 | 0.336 | 0.450 | N | 0.00 | -1 | -1 | 0.016 |
| J054119.7-013851 | N2023/2024 | 547 | 5:41:19.70 | -01:38:51.4 | 0.034 | 0.028 | 0.030 | 0.237 | 0.000 | N | 0.00 | -1 | -1 | 0.001 |
| J054050.6-013627 | N2023/2024 | 548 | 5:40:50.69 | -01:36:27.4 | 0.034 | 0.072 | 0.043 | 0.232 | 0.242 | N | 0.00 | -1 | -1 | 0.006 |
| J054058.0-013254 | N2023/2024 | 549 | 5:40:58.09 | -01:32:54.5 | 0.034 | 0.028 | 0.026 | 0.297 | 0.127 | N | 0.00 | -1 | -1 | 0.003 |
| J054346.3-011906 | N2023/2024 | 550 | 5:43:46.31 | -01:19:06.4 | 0.034 | 0.080 | 0.050 | 0.330 | 0.410 | N | 0.00 | -1 | -1 | 0.007 |
| J054145.3-020151 | N2023/2024 | 551 | 5:41:45.32 | -02:01:51.3 | 0.034 | 0.037 | 0.033 | 0.211 | 0.187 | N | 1.00 | 0.034 | 0.039 | 0.003 |
| J054122.3-012636 | N2023/2024 | 552 | 5:41:22.30 | -01:26:36.5 | 0.033 | 0.026 | 0.029 | 0.372 | 0.064 | N | 0.00 | -1 | -1 | 0.002 |
| J054213.7-013903 | N2023/2024 | 553 | 5:42:13.72 | -01:39:03.4 | 0.032 | 0.032 | 0.027 | 0.266 | 0.099 | N | 0.00 | -1 | -1 | 0.003 |
| J054203.7-013415 | N2023/2024 | 554 | 5:42:03.71 | -01:34:15.4 | 0.032 | 0.072 | 0.045 | 0.381 | 0.235 | N | 0.00 | -1 | -1 | 0.003 |
| J054239.9-011454 | N2023/2024 | 555 | 5:42:39.90 | -01:14:54.7 | 0.032 | 0.049 | 0.039 | 0.254 | 0.209 | N | 0.00 | -1 | -1 | 0.001 |
| J054147.5-012051 | N2023/2024 | 556 | 5:41:47.50 | -01:20:51.6 | 0.032 | 0.029 | 0.026 | 0.296 | 0.001 | N | 0.00 | -1 | -1 | 0.003 |
| J054131.7-013536 | N2023/2024 | 557 | 5:41:31.70 | -01:35:36.4 | 0.032 | 0.039 | 0.036 | 0.338 | 0.119 | N | 0.00 | -1 | -1 | -0.001 |
| J054101.6-013218 | N2023/2024 | 558 | 5:41:01.70 | -01:32:18.5 | 0.032 | 0.091 | 0.051 | 0.321 | 0.325 | N | 0.00 | -1 | -1 | 0.007 |
| J054130.5-011903 | N2023/2024 | 559 | 5:41:30.50 | -01:19:03.7 | 0.032 | 0.030 | 0.029 | 0.308 | 0.055 | N | 0.00 | -1 | -1 | 0.006 |
| J054210.7-014224 | N2023/2024 | 560 | 5:42:10.72 | -01:42:24.3 | 0.031 | 0.022 | 0.024 | 0.264 | 0.106 | N | 0.00 | -1 | -1 | 0.002 |
| J054151.9-020642 | N2023/2024 | 561 | 5:41:51.92 | -02:06:42.3 | 0.031 | 0.035 | 0.031 | 0.225 | 0.268 | N | 0.29 | 0.031 | 0.028 | 0.002 |
| J054205.9-012630 | N2023/2024 | 562 | 5:42:05.91 | -01:26:30.5 | 0.031 | 0.049 | 0.041 | 0.309 | 0.157 | N | 0.00 | -1 | -1 | -0.000 |
| J054308.7-012224 | N2023/2024 | 563 | 5:43:08.71 | -01:22:24.4 | 0.030 | 0.022 | 0.025 | 0.259 | 0.100 | N | 0.00 | -1 | -1 | -0.003 |
| J054209.1-013236 | N2023/2024 | 564 | 5:42:09.11 | -01:32:36.4 | 0.028 | 0.028 | 0.029 | 0.473 | 0.144 | N | 0.00 | -1 | -1 | -0.001 |