![[Uncaptioned image]](/html/1512.00710/assets/x1.png)
DNA is capable to recover after absorbing ultraviolet (UV) radiation, for example, by autoionization (AI). Single-wall carbon nanotube (SWNT) two-color photoluminescence spectroscopy was combined with quantum mechanical calculations to explain the AI in self-assembled complexes of DNA wrapped around SWNT.
Two-color spectroscopy of UV excited ssDNA complex with a single-wall nanotube photoluminescence probe: Fast relaxation by nucleobase autoionization mechanism
Abstract
DNA autoionization is a fundamental process wherein UV-photoexcited nucleobases dissipate energy by charge transfer to the environment without undergoing chemical damage. Here, single-wall carbon nanotubes (SWNT) are explored as a photoluminescent reporter for studying the mechanism and rates of DNA autoionization. Two-color photoluminescence spectroscopy allows separate photoexcitation of the DNA and the SWNTs in the UV and visible range, respectively. A strong SWNT photoluminescence quenching is observed when the UV pump is resonant with the DNA absorption, consistent with charge transfer from the excited states of the DNA to the SWNT. Semiempirical calculations of the DNA-SWNT electronic structure, combined with a Green’s function theory for charge transfer, show a 20 fs autoionization rate, dominated by the hole transfer. Rate-equation analysis of the spectroscopy data confirms that the quenching rate is limited by the thermalization of the free charge carriers transferred to the nanotube reservoir. The developed approach has a great potential for monitoring DNA excitation, autoionization, and chemical damage both in vivo and in vitro
I 1. Introduction
It is well known that ultraviolet (UV) radiation presents a significant danger for living organisms. DNA, which stores genetic information in the majority of organisms on Earth, readily absorbs UV light. It has a signature absorption band at eV ( nm) resulting from the - excitation of the nucleobasesMiddleton et al. (2009). The amount of energy delivered by a single UV photon (5 eV, corresponding to times the thermal energy) is sufficient to trigger chemical reactions that corrupt the DNA structure Adhikary et al. (2005). The cells with damaged DNA either die or, even more dangerously for a multi-cellular organism, begin uncontrollable (cancerous) growth. To combat the damage, cells have developed DNA repair mechanisms that, however, would be insufficient against a large UV radiation uptake in the absence of alternative dissipation pathwaysMiddleton et al. (2009); Crespo-Hernandez et al. (2004). Thus, the energy dissipation of the DNA photoexcited states is crucial for the survival of DNA-based life.
Understanding the physics of DNA photoexcitation decay is important for such diverse fields as medicine, evolutionary biology, and space exploration. For biomedical purposes, one strives to understand the survivable levels of UV radiation for different cell types and learn the ways to mitigate the irradiation effects. From the evolutionary perspective, the energy dissipation mechanisms were crucial during the primordial cell evolution when UV radiation on the young Earth was orders of magnitude more intense than today while the DNA repair mechanisms were presumably non-existent. For continued exploration of far space where mankind may be capable to reach in the near future, it is crucial to develop strategies for cellular and organismal safety in the harsh radiation conditions.
Known mechanisms of energy dissipation from DNA include direct singlet and indirect triplet recombination, formation of secondary electrons, electron transfer and deprotonation, and DNA autoionization (AI), that is, a spontaneous irreversible charge transfer from the excited nucleobase to the environment. While the recombination mechanisms have been studied quite extensivelyMiddleton et al. (2009); Crespo-Hernandez et al. (2004, 2004); Zhang et al. (2015); Schwalb and Temps (2007), DNA autoionizationCrespo-Hernandez and Arce (2002) has received less attention, partially due to the fact that AI in solution involves charge transfer from DNA to the surrounding water solventBelau et al. (2007); Gu et al. (2012); Pecourt et al. (2000). The irregular, dynamically changing structure of the solvent makes quantitative modeling of experiments and theoretical predictions of AI rates and mechanisms extremely complicatedWang et al. (2008); Smyth and Kohanoff (2011).
In this work, we explore the AI of single-stranded DNA (ssDNA) wrapped around single-wall carbon nanotubes (SWNT) which constitute an elementary nanomaterial with a great promise for such biotechnology applications as nanotherapeutics, nanopharmacologyHong et al. (2015); Liu et al. (2009), and optical imaging. SWNTs are inexpensive and robust in synthesis, chemically inert, mechanically stable, and biocompatibleHeister et al. (2013); Liu et al. (2011). The existence of strong near infrared (NIR) SWNT bands that lie within the water transparency window make nanotubes remarkably suitable for bioimaging. Indeed, transient absorption microscopy, single- and two-photon fluorescence, Raman, and photo-thermal microscopy have been demonstrated both in vitro and in vivoHeister et al. (2013); Kang et al. (2012); Chilek et al. (2014); Jain et al. (2015). Due to the nanotube transverse size of a few nanometers (nm) and large aspect ratio up to , controllable, in principle, by synthesis and/or post-processing, several applications in biological sensing have been achieved through direct mechanical, optical, and electronic interactions with biopolymers and cellular organelles of a similar sizeChoi et al. (2012); Martin and Kohli (2003); Zhou et al. (2015); Budhathoki-Uprety et al. (2014).
In particular, DNA interaction with SWNTs has been an object of intensive studyZheng et al. (2003a); Strano et al. (2004); Lu et al. (2005); Heller et al. (2006); Tu et al. (2009); Khripin et al. (2009); Rotkin (2010); Roxbury et al. (2012) Chemical engineering and bioengineering applications of DNA-SWNT complexes have been suggestedCherukuri et al. (2004); Mu et al. (2014); Fabbro et al. (2012); Calvaresi and Zerbetto (2013); Mundra et al. (2014). ssDNA is known to wrap in a regular pattern around the cylindrical surface of the SWNTZheng et al. (2003a); Strano et al. (2004); Roxbury et al. (2012); Zheng et al. (2003b). The nucleobases bind to the nanotube surface through a combination of van der Waals, hydrophobic and Coulomb forcesLustig et al. (2005); Snyder and Rotkin (2006); Alidori et al. (2013); Roxbury et al. (2013), while the phosphodiester backbone remains exposed to the solvent. The wrapping pattern depends strongly on the DNA sequenceTu et al. (2009); Landry et al. (2015).
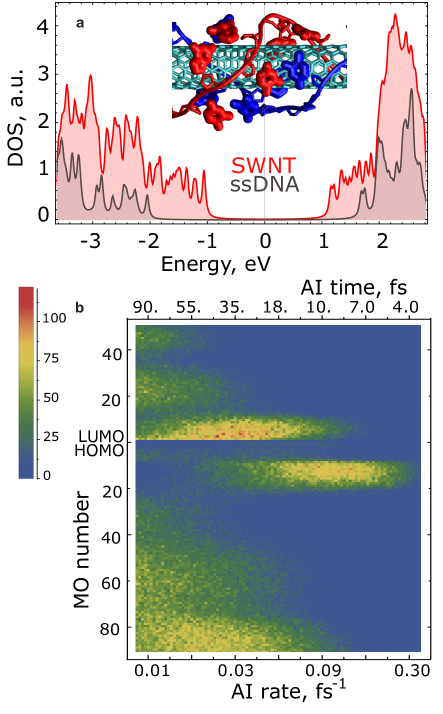
The geometry of the DNA-SWNT complex results in a strong electronic interaction between the nucleobases and the nanotube. The ionized backbone of the helically wrapped DNA may alter the nanotube electronic structure via symmetry breaking Puller and Rotkin (2007); Wall and Ferreira (2007); Snyder and Rotkin (2008). Modulation of the optical and electronic properties of SWNTs has been experimentally observed upon DNA wrappingStrano et al. (2004); Tu et al. (2009); Hughes et al. (2007); Cathcart et al. (2008); Duque et al. (2009); Fagan et al. (2013). Recently, SWNTs were foundPetersen et al. (2013) to mitigate the ssDNA oxidative damage caused by the radical species in water ultrasonication experiments, at least in in vitro conditions. The latter study stresses that the charge transfer between DNA and nanotube is likely responsible for the protection effect. The existence of such a charge transfer mechanism would be consistent with the well-known photoinduced charge transfer both within DNA and between DNA and other species Zhang et al. (2015, 2014); Giese et al. (2001); Barnett et al. (2001); Senthilkumar et al. (2005); Lewis et al. (1997); Genereux and Barton (2010); Lewis et al. (2006); Renaud et al. (2013). A large overlap of SWNT conduction and valence bands with the DNA (and ) bands (Fig.1) should allow for both charge transfer and photoinduced modulation in DNA-SWNT systems, which has not been studied before.
Due to the high symmetry of the SWNT lattice, its electronic states form bands with well defined quantum numbers (related to axial and angular momentum)Dresselhaus et al. (2001); Ajiki and Ando (1993). The rigidity of -carbon bonds makes SWNTs stable and their electronic structure mostly intact even in solventAlidori et al. (2013). As a result, the SWNT optical transitions have been very well characterized experimentally, in contrast to the states of electrons trapped in the water/solvent. Thus, the nanotube provides an ideal probe for studying the nucleobase autoionization mechanism and consequently, the non-chemical energy dissipation pathway for the UV photoexcited states of DNA. Electronic states of the SWNT can be monitored through the SWNT UV-NIR absorption (Fig.2) and photoluminescence (PL) response (Fig.3) in the NIR range, completely outside of the DNA excitation (absorption) spectrum (Fig.2, inset).
Here, we demonstrate that the PL response of the nanotube (as a model optical system) in the DNA-SWNT complex is strongly modulated by the photoexcitation of the wrapped DNA. Two-color UV/visible excitation spectroscopy is used to excite the CoMoCat nanotube sample wrapped with (GT)20 ssDNAIgnatova et al. (2011). SWNTs and the nucleobases were excited independently using two harmonics of the diffraction grating (see section II.1).The UV-excited DNA is shown to undergo an AI charge transfer to the SWNT on the time scale of 20 fs, which dominates all other decay mechanisms for the DNA - state. The transferred free charge carriers, both electrons and holes, contribute substantially to the non-radiative recombination of the SWNT excitations, quenching its PL response. The rate equation analysis of the spectroscopy data yields the PL quenching rate on the order of 40-60 ps, much slower than the AI rate, most likely limited by the SWNT electron thermalization. The ability of living cells to uptake DNA-functionalized SWNTsJin et al. (2008) makes the two-color spectroscopy method suitable for monitoring DNA autoionization in vivo.
II 2. Methods
II.1 2.1. Experimental Methods
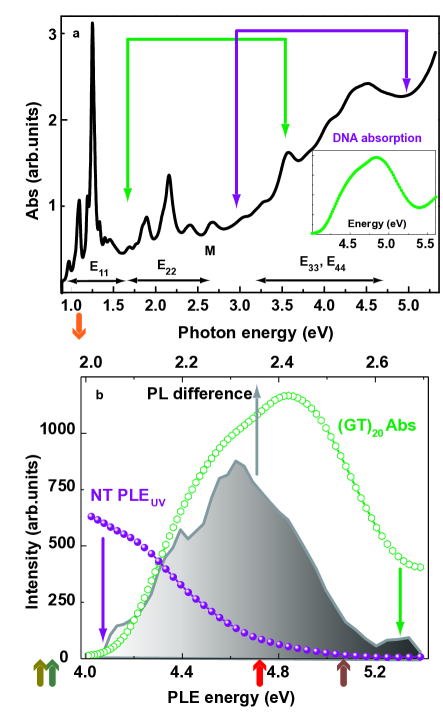
The samples were prepared using the procedure described in detail elsewhere. In brief, SWNTs synthesized with the CoMoCat method, were wrapped with (GT)20 ssDNAIgnatova et al. (2011), citric buffer was substituted from the solution, and the sample was re-suspended in heavy water (D2O) to remove any trace of the original buffer and free DNAZheng et al. (2003a). The absorption spectrum of the resulting system (Fig.2a) shows clear , , , and transitions for individual SWNT species. The peak centered at 265 nm (4.68 eV) corresponds to the signature DNA absorption due to - transitions. A theoretical absorption curve for (GT)20 DNA, shown in the inset, matches the peak well.
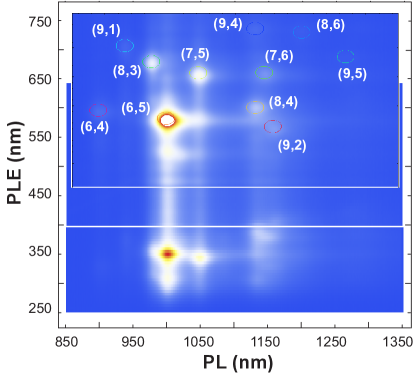
A 2D photoluminescence/photoluminescence excitation (PL/PLE) plot for the DNA-SWNT solution was taken by a FLUROLOG5 fluorimeter in a wide range of excitation from 250 nm to 750 nm (Fig.5d and SI). PL transitions show a Stokes shift of about 5 nm with respect to the absorption peaks, typical for solutions of DNA wrapped SWNTsHertel et al. (2010). All experiments were performed in ambient at room temperature; the excitation intensity was kept in the linear regime.
The 2nd harmonic of the diffraction grating turned to the appropriate grazing angle was used for the second-color (UV) excitation, i.e., the wavelength of the UV source was half that of the main excitation . The intensity of the 2nd order (UV) constituted approximately 10% of the intensity of the first order (in the visible range) or slightly less. Reference experiments were performed with only the visible range excitation and the UV light completely blocked on the excitation pass by a UV long pass filter (UVLP 450, Thorlabs). Measured transmission spectral response of the UVLP filter (see SI) was used to correct the excitation intensity.
II.2 2.2. Theory and simulations
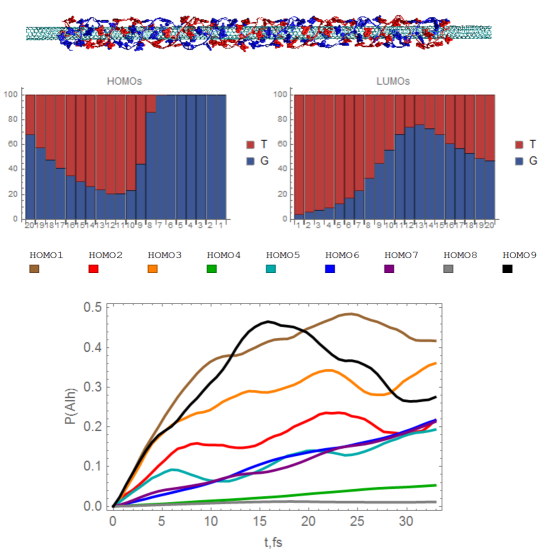
The electronic interactions between the SWNT and the wrapped DNA were studied using the semi-empirical quantum chemical modeling method INDO/s Ridley and Zerner (1973); Voityuk (2013), as implemented in the program CNDOTejerina and Reimers (2008). The INDO/s method has been used in the past to calculate the electronic properties of DNA, as well as those of carbon nanotubes Zhang et al. (2014); Venkatramani et al. (2011a, b); Hatcher et al. (2008); Fonseca et al. (1996); Voityuk (2007, 2008), and showed accuracy comparable to that of higher-level quantum calculationsVoityuk (2013); Thiel (2014); Voityuk (2006). The INDO/s electronic structure was calculated for each of the 6200 frames of the 3.1 ns molecular dynamics (MD) simulationRoxbury et al. (2013) of two intertwined (GT)30 DNA chains wrapped around a 70 Å-long fragment of (6,5) SWNT (see Fig. 1a). Note that (6,5) is the most abundant SWNT species in our CoMoCat samples. In view of the computational resource limitations, the CNDO calculations were performed for only a part of the MD system that included a single unit cell of the SWNT (41 Å in length) and the DNA bases overlaying the unit cell with their coordinates extracted from the MD frames (see SI for detail). The dangling bonds from the SWNT carbon atoms and the nucleobase N atoms were capped with hydrogensKilina and Tretiak (2007). The resulting quantum mechanical system included 386 SWNT atoms (364 C atoms and 22 capping H atoms) and, depending on the frame, 14-20 nucleobases (capped with H atoms).
Three CNDO calculations were performed for each MD frame: one for the complete system (DNA and SWNT), one for only the SWNT section, and one for only the nucleobases included. The complete system calculation results in “hybridized” molecular orbits (MOs), , delocalized between the DNA and the SWNT lattice. The DNA-only and SWNT-only calculations result in “unhybridized” MOs, localized on either the DNA, , or the SWNT, . The “unhybridized” MOs, put together, result in a (generally, unorthogonal) orbital basis set:
| (1) |
that allows one to determine the density of electronic states on the DNA and the SWNT:
| (2) | |||
| (3) |
III 3. Results
III.1 3.1. DNA autoionization rate: Theoretical consideration
The electronic structure of the DNA-SWNT system was used to evaluate the rate of charge transferChen et al. (2011) of an electron (or a hole) from a photoexcited nucleobase to the SWNT. Such a process describes both the AI mechanism (if only one charge carrier is transferred onto the SWNT) and the resonance energy transfer (if both the electron and the hole move onto the nanotube). Since the number of atoms (and therefore the number of delocalized electrons) of SWNT exceeds by far that of a single DNA nucleobase, the nanotube plays the role of the reservoir for the DNA charge carriers transferred onto it. Such charge carriers quickly thermalize on the SWNT and become indistinguishable from other charge carriers in the nanotube.
For each MD frame, we assume that the system at time zero occupies the photoexcited state which comprises an electron in one of the unoccupied MOs and the hole in one of the occupied MOs of the DNA-only subsystem. The evolution of the photoexcited state is then calculated using the Green’s function technique (see the supplement for detail).
In brief, it can be shown that the probability of autoionization by time is the sum of the probabilities of electron and hole transfer from the DNA to the SWNT:
| (4) |
where and are the Green’s functions for the charge transfer from the DNA to the SWNT for electron and hole, respectively:
| (5) |
and
| (6) |
Here, is the Hamiltonian of the DNA+SWNT system; the indices and run over the unoccupied and occupied DNA orbitals, respectively, and correspond to the electron and the hole placement in the initial excited state; the indices and label the unoccupied and occupied orbitals of the SWNT and the indices and run over the unoccupied and occupied orbitals of the DNA, all in the final state. Such a formalism takes into account not only the charge transfer of the electron (hole) from the DNA to the SWNT, but also the transfer of the remaining hole (electron) between the DNA statesSantoro et al. (2013) (see the supplement for further detail).
The time-dependent probability of AI from specific DNA MOs, both occupied and unoccupied, was computed along the MD trajectory. The statistical analysis of the results is presented in Fig.1b. Each row of the density plot in the figure represents a probability distribution function for the partial AI rate from a particular HOMO+N, Nth occupied MO (or LUMO+M, Mth unoccupied MO) state of the DNA, where and . A broad (order-of-magnitude) distribution of rates for each MO results from the MD fluctuations of the DNA-SWNT complex geometry. Most efficient AI is observed from two clusters of MOs closest to the HOMO-LUMO gap (corresponding to individual photoexcited nucleobases). Besides this, statistical analysis clearly shows that the AI rates for hole transfer are faster (about 5 fs) than those for electrons (15 fs). Next we estimated the total probability of the UV-ionization of DNA by convolving the AI probability with the theoretical DNA photoexcitation (absorption) spectrum. For a given wavelength of the UV pump, the total AI probability, related to the experimentally measured DNA charge transfer rate to be discussed below, is expressed as:
| (7) |
here are the partial AI rates from Eq.(4-6) for a given electron-hole pair at MOs , and is the DNA photoexcitation rate between these MOs at .
Fig. 5f summarizes our findings: the fast and efficient AI is clearly seen in the spectral band near 265 nm (4.7 eV). It takes less than 20 fs for a significant number of photoexcited charge carriers to tunnel into the SWNT. Our method allowed us to explore whether the SWNT conduction bands accept the photoexcited electron from the DNA base (e-tunneling) or the SWNT valence bands accept the hole from the DNA valence states (h-tunneling). Fig.1 shows that hole transport for the modeled DNA-SWNT complex is more efficient: the AI lifetimes are 5-25 fs for the holes and 15-65 fs for the electrons.
A direct experimental observation of such fast AI dynamics would require a transient-state characterization method with fs resolution. However, for the DNA-SWNT hybrid the AI can be inferred from the steady-state population of the charge carriers transferred to the SWNT, given that the mechanism is not overwhelmed by other processes. The latter is a safe assumption since the DNA nucleobases are strongly hybridized to the SWNT, so the average DNA coupling to the solvent is much smaller than to the nanotube reservoir, and the other non-radiative and radiative decay channels are known to have even longer characteristic timesMiddleton et al. (2009). Thus, the AI-driven depopulation rate of the photoexcited state of the DNA equals the population rate of the SWNT. This charge transfer is followed by the thermalization of SWNT hot free carriers and then PL quenching. The latter can be directly extracted from the two-color PL experiments, as explained next.
III.2 3.2. Nanotube as a two-color photoluminescence probe
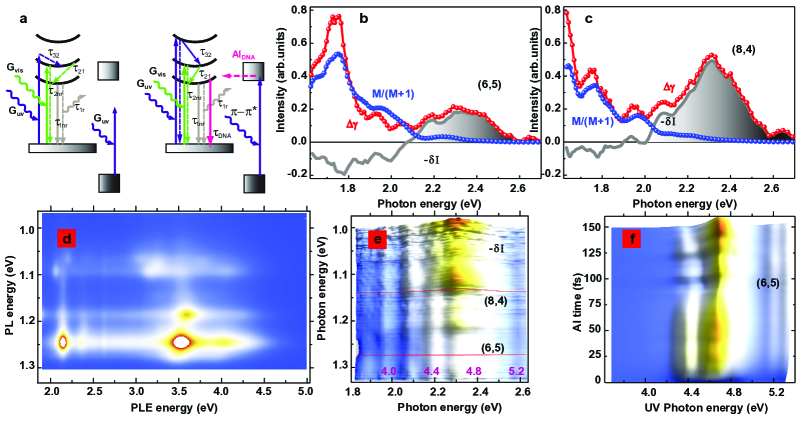
A sketch of the band structure of the DNA-SWNT hybrid is shown in Fig.5a. In normal conditions, resonant excitation, , creates a nanotube exciton in the manifold. The exciton undergoes quick relaxation to the first subband followed by a nonradiative recombination with the rate or a radiative recombination with the rate , giving rise to PL with a quantum yield (QY) proportional to the ratio .
In our two-color excitation scheme, standard visible excitation is combined with an additional UV pump, . The latter can be tuned to the resonant excitation of either ssDNA or nanotube, while the former excites only SWNT species in the complexes. The nanotube resonant UV excitation generates additional e-h pairs in the subband that can relax to and subsequently to subbands, and recombine radiatively from the lowest energy level, contributing to additional PL (Fig.5a).
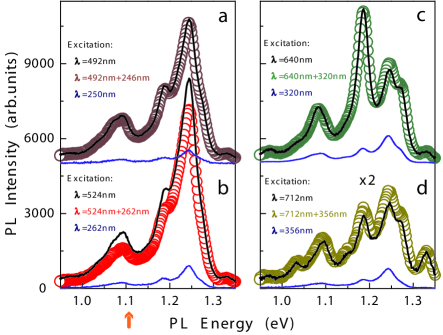
Evolution of the SWNT PL upon adding a small UV pump at different wavelengths of excitation shows three qualitatively different types of behavior (Fig.3). While additional UV illumination causes (i) a higher PL intensity within a wide range of (Fig.3c-d), in a certain range the PL intensity has (ii) nearly the same value with and without second color excitation (Fig.3a). This correlates with the UV pump not being in resonance with one of SWNT transitions. Thick black solid curves in Fig.3 show SWNT emission spectra taken with the photoexcitation only in visible, at (UV pump was completely blocked). The (green/red/brown) open symbols correspond to dual-color excitation (by both visible and UV source), . Thin curves, shown at the bottom of each plot, correspond to the SWNT emission observed at pure UV single-color excitation, , scaled according to UV source efficiency. We emphasize that in the first two cases (i-ii) the dual-color-excitation PL (green and brown symbols) can be found as a simple sum of visible excitation spectra (thick lines, without UV pump) and UV excitation (thin, without visible pump): .
The PL behavior was found to be drastically different in a narrow band of dual-color-excitation nm/ nm. In this spectral band the SWNT emission intensity shows (iii) an anomalous drop under an additional UV illumination despite the fact that the UV excitation is in resonance with the SWNT bands (compare red symbols and black curve in Fig.3b).
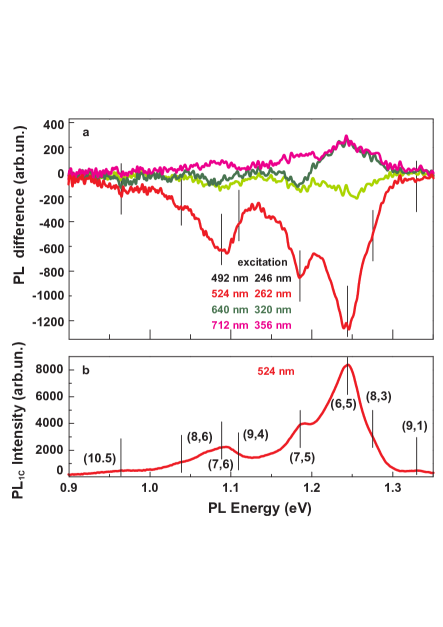
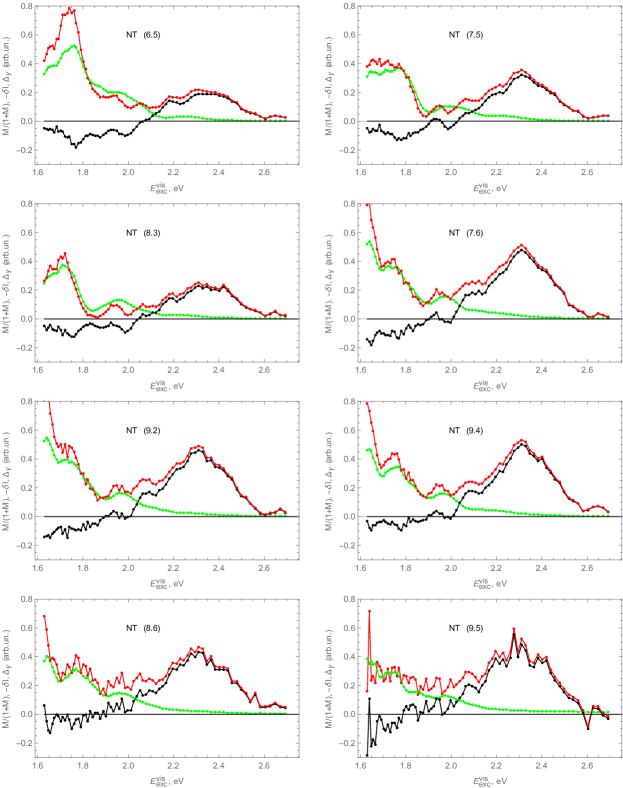
Fig.4 compares the one-color PL (bottom) with both normal and abnormal two-color PL for different SWNT species. The difference in PL intensity with and without additional UV pump: is plotted in the top panel vs. the PL energy.
At nm the SWNT are resonantly excited by both G and G pump (type i). UV generation of charge carriers in the higher and SWNT subbands is followed by their relaxation from those subbands to the lowest subband, and radiative recombination. At this particular wavelength of the second-color excitation (320 nm) the PL enhancement is expected for (8,3), (6,5), (7,5) and (7,6) SWNTs (see SI for details) which is fully corroborated by experimental data.
At nm UV pump is not resonant with SWNT bands, as shown in Fig.3a (thin curve). The number of additional e-h pairs due to UV excitation is negligible and the PL difference (brown curve in Fig.4) is close to zero (type ii).
The picture is qualitatively different at 520/260 nm of excitation (red curve). is negative, which means that UV illumination not only fails to generate new excitons but also initiates an efficient PL quenching. We stress on three major observations: (1) PL quenching happens uniformly for all semiconducting tubes present in solution and the process has a similar strength for each of the PL lines (compare differential PL emission, , and one-color excitation spectrum, in Fig.4). All single-color PL features assigned to particular chiralities are present in the same proportion in two-color . At the same time, (2) this quenching process varies with the photon energy of excitation: it manifests itself in a narrow PLE spectral range which is (3) not resonant with any of or transitions of SWNTs present in the sample. Absence of chiral selectivity in along with observation of a distinct PLE band and its coincidence with the spectral absorption band of the DNA at 265 nm indicates that an additional nonradiative decay channel appears due to resonantly excited DNA. We note that the effect was not observed in similar SWNT samples without DNA, dissolved using different surfactants (Na deoxycholate/Na dodecylsulfate), while replacement of D2O with H2O preserves the effect. Our samples do not contain other species, which allows us to attribute its sole origin to DNA unambiguously.
III.3 3.3. Rate-equation analysis of the SWNT PL quenching
The DNA induced PL decay rate can be obtained quantitatively from the measured PL and PLE data by solving the system of rate equations for the population of SWNT excited states. A steady-state solution of the rate equations is readily obtained (see SI for derivation details). In brief, we solve a 4-level system for a nanotube, adding the DNA AI pathway via a spectral quenching rate . In order to prove that the derived PL quenching rate is indeed caused by the DNA AI, the spectral profile of has been calculated and compared to the DNA absorption (photoexcitation) spectrum.
The two-color excitation efficiency ratio can be defined as: where and are experimentally measured excitation functions for one-color illumination (see Fig.S2 in SI), and is the UV pump efficiency . The differential PL spectral function is: where and are the experimentally measured PL intensity under one-color (vis) and two-color (vis+uv) excitation respectively; is the correction transmission function of the UVLP filter (see Fig.S3 in SI). Using these two measured functions and known transition rates (Table S1 in SI) one explicitly obtains , the additional PL quenching rate appearing under UV illumination of the sample. Dependence of this non-radiative recombination mechanism, induced by extra free charge carriers transferred from the DNA, on the PL and PLE photon energy can be derived from the experimental 1-color and 2-color QY data as:
| (8) |
where the one-color quantum yield is: and the effective two-color quantum yield is: (reader is referred to SI for detailed derivation).
Fig.5 shows contributions of the individual SWNT species of known chiralities: panel (b) presents spectral PLE functions detected at eV (994 nm), corresponding to (6,5) SWNTs making the largest peak in Fig.3ab. The differential PL, , (gray shaded) is negative where the DNA induced quenching supersedes the UV excitation function (blue). Data collected at eV (1130 nm), corresponding to (8,4) SWNTs with much lower concentration in our sample, is plotted in panel (c) and shows an even clearer signature of the DNA AI, with the normalized PL decay rate, , (red) reaching % at resonance with the DNA - transition. Using and from Table S1 in SI the DNA induced PL quenching rate is estimated to be of the order of 0.01-0.025 ps-1 for these 2 SWNTs in resonance. Other SWNT species demonstrate similar behavior as shown in Fig.5e, where the complete PLE map on the DNA induced PL quenching is presented.
IV 4. Conclusions and Outlook
Charge transfer from the - photoexcited states of nucleobases into the nanotube electronic system has been studied using a combination of quantum and statistical theory and two-color PL-PLE characterization. Semiempirical quantum calculations coupled with a 2-particle Green’s function theory were employed to evaluate the charge transfer rate in an example system: poly(GT) ssDNA wrapped around a (6,5) SWNT. The calculations indicate a strong coupling between the electronic states of the DNA and the SWNT and predict a fast (less than 20 fs time scale) autoionization of UV-excited DNA, dominated by the hole transfer from DNA to the SWNT. The calculation results indicate that the AI rates are faster than the energy transfer between DNA bases in oligomers (in the ps-ns range), the charge transfer between the nucleobases in dimers (in the ps range) and the charge transfer from monomers to the transient states in the surrounding solvent (in the sub-ps range)Crespo-Hernandez et al. (2004); Zhang et al. (2015).
The two-color spectroscopy experiments reveal a strong quenching of the SWNT photoluminescence when the the UV excitation is resonant with the DNA - absorption band, whereas the non-resonant UV excitation leads to a usual enhancement of the PL quantum yield. The enhancement is resonant with absorption bands of a particular nanotube, while the quenching is independent of the nanotube chirality. A rate-equation analysis of the experimental results leads to the PL decay rate on the order of 40-100 ps, much slower than the calculated autoionization rate. This suggests that thermalization of the hot carriers transferred from the DNA is the bottleneck of the autoionization-induced PL quenching.
We propose that two-color (and, potentially, multi-color) pump-probe experiments, similar to the one presented here, could become a useful technique for detecting charge transfer in various molecular complexes. In the case of DNA, decoupling of DNA excitation frequency (UV) from the sensor and pump frequencies (NIR and visible) enables spectroscopic studies of DNA ionization under a range of experimental conditions. For example, one could employ the method for studying autoionization in self-assembled DNA-SWNT complexes, stable at ambient conditions in water solution and capable of penetrating live cellsHong et al. (2015). Our calculations indicate that DNA-to-SWNT AI is a dominant process that makes SWNTs ideal reporters in which the problems of previous sensor systems, for example, due to intra-DNA and DNA-to-solvent charge transport, have been minimized. Thus, changes in the DNA charged state could be monitored at room temperature in water solution, eliminating the need for cryogenic or vapor-phase measurements.
Further developments of the method involve studies of SWNTs of different chirality wrapped with different DNA. A combination of modeling and experimental studies similar to ours, could presumably determine the sequence effect on the DNA autoionization rates and identify the SWNT chirality best suited for AI monitoring from various DNA sequences. Such a study could reveal the sequence-dependent AI processes that nature presumably exploits to minimize the UV damage of DNA.
TI and SVR acknowledge support by National Science Foundation (ECCS-1202398 and ECCS-1509786); PS acknowledges REU NSF grant PHY-1359195. AB acknowledges the startup fund support from the University of Central Florida. The authors gratefully acknowledge access to facilities at the National Institute of Standards and Technology for PL measurements and the computational time support from the UCF Advanced Research Computing Center STOKES. We are thankful to Dr. J. Fagan as the host at NIST, Dr. J. Reimers for providing us with the CNDO code, and Dr. D. Roxbury for providing the MD trajectory.
Electronic Supplementary Material: Supplementary material contains details on the sample preparation and experimental methods, and DNA autoionization modeling; discussion of the alternative recombination mechanisms; details on the rate equations and PL quenching rate for DNA-induced non-radiative recombination channel; the experimentally measured excitation functions for UV-vis pump, and the transmission data for UVLP filter; the rate equation parameters; the comparison of the DNA induced PL quenching for 6 different SWNT chiralities. ESM is available in the online version of this article at http://dx.doi.org/10.1007/***********************
References
- Middleton et al. (2009) C. T. Middleton, K. de La Harpe, C. Su, Y. K. Law, C. E. Crespo-Hernandez, and B. Kohler, Annual Review of Physical Chemistry 60, 217 (2009), pMID: 19012538, http://dx.doi.org/10.1146/annurev.physchem.59.032607.093719 .
- Adhikary et al. (2005) A. Adhikary, A. Y. S. Malkhasian, S. Collins, J. Koppen, D. Becker, and M. D. Sevilla, Nucleic Acids Research 33, 5553 (2005), http://nar.oxfordjournals.org/content/33/17/5553.full.pdf+html .
- Crespo-Hernandez et al. (2004) C. E. Crespo-Hernandez, B. Cohen, P. M. Hare, and B. Kohler, Chemical Reviews 104, 1977 (2004), pMID: 15080719, http://dx.doi.org/10.1021/cr0206770 .
- Zhang et al. (2015) Y. Zhang, J. Dood, A. A. Beckstead, X.-B. Li, K. V. Nguyen, C. J. Burrows, R. Improta, and B. Kohler, The Journal of Physical Chemistry B 119, 7491 (2015), pMID: 25660103, http://dx.doi.org/10.1021/jp511220x .
- Schwalb and Temps (2007) N. K. Schwalb and F. Temps, Journal of the American Chemical Society 129, 9272 (2007), pMID: 17622153, http://dx.doi.org/10.1021/ja073448+ .
- Crespo-Hernandez and Arce (2002) C. E. Crespo-Hernandez and R. Arce, Photochemistry and Photobiology 76, 259 (2002).
- Belau et al. (2007) L. Belau, K. R. Wilson, S. R. Leone, and M. Ahmed, The Journal of Physical Chemistry A 111, 7562 (2007), pMID: 17419600.
- Gu et al. (2012) J. Gu, J. Leszczynski, and H. F. Schaefer, Chemical Reviews 112, 5603 (2012), pMID: 22694487, http://dx.doi.org/10.1021/cr3000219 .
- Pecourt et al. (2000) J.-M. L. Pecourt, J. Peon, and B. Kohler, Journal of the American Chemical Society 122, 9348 (2000), http://dx.doi.org/10.1021/ja0021520 .
- Wang et al. (2008) C.-R. Wang, T. Luo, and Q.-B. Lu, Phys. Chem. Chem. Phys. 10, 4463 (2008).
- Smyth and Kohanoff (2011) M. Smyth and J. Kohanoff, Phys. Rev. Lett. 106, 238108 (2011).
- Hong et al. (2015) G. Hong, S. Diao, A. L. Antaris, and H. Dai, Chemical Reviews ASAP (2015), 10.1021/acs.chemrev.5b00008, pMID: 25997028, http://dx.doi.org/10.1021/acs.chemrev.5b00008 .
- Liu et al. (2009) Z. Liu, S. Tabakman, K. Welsher, and H. Dai, Nano Research 2, 85 (2009).
- Heister et al. (2013) E. Heister, E. W. Brunner, G. R. Dieckmann, I. Jurewicz, and A. B. Dalton, ACS Applied Materials & Interfaces 5, 1870 (2013), pMID: 23427832, http://dx.doi.org/10.1021/am302902d .
- Liu et al. (2011) Z. Liu, J. T. Robinson, S. M. Tabakman, K. Yang, and H. Dai, Materials Today 14, 316 (2011).
- Kang et al. (2012) J. W. Kang, F. T. Nguyen, N. Lue, R. R. Dasari, and D. A. Heller, Nano Letters 12, 6170 (2012), pMID: 23151070, http://dx.doi.org/10.1021/nl302991y .
- Chilek et al. (2014) J. L. Chilek, R. Wang, R. K. Draper, and P. Pantano, Analytical Chemistry 86, 2882 (2014), pMID: 24564772, http://dx.doi.org/10.1021/ac403827m .
- Jain et al. (2015) A. Jain, A. Homayoun, C. W. Bannister, and K. Yum, Biotechnology Journal 10, 447 (2015).
- Choi et al. (2012) Y. Choi, I. S. Moody, P. C. Sims, S. R. Hunt, B. L. Corso, I. Perez, G. A. Weiss, and P. G. Collins, Science 335, 319 (2012), http://www.sciencemag.org/content/335/6066/319.full.pdf .
- Martin and Kohli (2003) C. R. Martin and P. Kohli, Nat Rev Drug Discov 2, 29 (2003).
- Zhou et al. (2015) W. Zhou, Y. Y. Wang, T.-S. Lim, T. Pham, D. Jain, and P. J. Burke, Sci. Rep. 5, (2015).
- Budhathoki-Uprety et al. (2014) J. Budhathoki-Uprety, P. V. Jena, D. Roxbury, and D. A. Heller, Journal of the American Chemical Society 136, 15545 (2014), pMID: 25343218, http://dx.doi.org/10.1021/ja505529n .
- Zheng et al. (2003a) M. Zheng, A. Jagota, E. D. Semke, B. A. Diner, R. S. Mclean, S. R. Lustig, R. E. Richardson, and N. G. Tassi, Nat Mater 2, 338 (2003a).
- Strano et al. (2004) M. S. Strano, M. Zheng, A. Jagota, G. B. Onoa, D. A. Heller, P. W. Barone, and M. L. Usrey, Nano Letters 4, 543 (2004), http://dx.doi.org/10.1021/nl034937k .
- Lu et al. (2005) G. Lu, P. Maragakis, and E. Kaxiras, Nano Letters 5, 897 (2005), pMID: 15884890, http://dx.doi.org/10.1021/nl050354u .
- Heller et al. (2006) D. A. Heller, E. S. Jeng, T.-K. Yeung, B. M. Martinez, A. E. Moll, J. B. Gastala, and M. S. Strano, Science 311, 508 (2006), http://www.sciencemag.org/content/311/5760/508.full.pdf .
- Tu et al. (2009) X. Tu, S. Manohar, A. Jagota, and M. Zheng, Nature 460, 250 (2009).
- Khripin et al. (2009) C. Y. Khripin, S. Manohar, M. Zheng, and A. Jagota, The Journal of Physical Chemistry C 113, 13616 (2009), http://pubs.acs.org/doi/pdf/10.1021/jp903197d .
- Rotkin (2010) S. V. Rotkin, Annual Review of Physical Chemistry 61, 241 (2010), pMID: 19947884, http://dx.doi.org/10.1146/annurev.physchem.012809.103304 .
- Roxbury et al. (2012) D. Roxbury, J. Mittal, and A. Jagota, Nano Letters 12, 1464 (2012).
- Cherukuri et al. (2004) P. Cherukuri, S. M. Bachilo, S. H. Litovsky, and R. B. Weisman, Journal of the American Chemical Society 126, 15638 (2004), pMID: 15571374, http://dx.doi.org/10.1021/ja0466311 .
- Mu et al. (2014) B. Mu, J. Zhang, T. P. McNicholas, N. F. Reuel, S. Kruss, and M. S. Strano, Accounts of Chemical Research 47, 979 (2014), pMID: 24467652, http://dx.doi.org/10.1021/ar400162w .
- Fabbro et al. (2012) A. Fabbro, S. Bosi, L. Ballerini, and M. Prato, ACS Chemical Neuroscience 3, 611 (2012), http://dx.doi.org/10.1021/cn300048q .
- Calvaresi and Zerbetto (2013) M. Calvaresi and F. Zerbetto, Accounts of Chemical Research 46, 2454 (2013), pMID: 23826731, http://dx.doi.org/10.1021/ar300347d .
- Mundra et al. (2014) R. V. Mundra, X. Wu, J. Sauer, J. S. Dordick, and R. S. Kane, Current Opinion in Biotechnology 28, 25 (2014), nanobiotechnology and Systems biology.
- Zheng et al. (2003b) M. Zheng, A. Jagota, M. S. Strano, A. P. Santos, P. Barone, S. G. Chou, B. A. Diner, M. S. Dresselhaus, R. S. Mclean, G. B. Onoa, G. G. Samsonidze, E. D. Semke, M. Usrey, and D. J. Walls, Science 302, 1545 (2003b), http://www.sciencemag.org/content/302/5650/1545.full.pdf .
- Lustig et al. (2005) S. R. Lustig, A. Jagota, C. Khripin, and M. Zheng, The Journal of Physical Chemistry B 109, 2559 (2005), pMID: 16851257, http://dx.doi.org/10.1021/jp0452913 .
- Snyder and Rotkin (2006) S. E. Snyder and S. V. Rotkin, JETP Letters 84, 348 (2006).
- Alidori et al. (2013) S. Alidori, K. Asqiriba, P. Londero, M. Bergkvist, M. Leona, D. A. Scheinberg, and M. R. McDevitt, The Journal of Physical Chemistry C 117, 5982 (2013), http://dx.doi.org/10.1021/jp312416d .
- Roxbury et al. (2013) D. Roxbury, A. Jagota, and J. Mittal, The Journal of Physical Chemistry B 117, 132 (2013), pMID: 23199189, http://dx.doi.org/10.1021/jp309523a .
- Landry et al. (2015) M. P. Landry, L. Vukovic, S. Kruss, G. Bisker, A. M. Landry, S. Islam, R. Jain, K. Schulten, and M. S. Strano, The Journal of Physical Chemistry C 119, 10048 (2015), http://dx.doi.org/10.1021/jp511448e .
- Puller and Rotkin (2007) V. I. Puller and S. V. Rotkin, EPL (Europhysics Letters) 77, 27006 (2007).
- Wall and Ferreira (2007) A. Wall and M. S. Ferreira, Journal of Physics: Condensed Matter 19, 406227 (2007).
- Snyder and Rotkin (2008) S. E. Snyder and S. V. Rotkin, Small 4, 1284 (2008).
- Hughes et al. (2007) M. E. Hughes, E. Brandin, and J. A. Golovchenko, Nano Letters 7, 1191 (2007), pMID: 17419658, http://dx.doi.org/10.1021/nl062906u .
- Cathcart et al. (2008) H. Cathcart, V. Nicolosi, J. M. Hughes, W. J. Blau, J. M. Kelly, S. J. Quinn, and J. N. Coleman, Journal of the American Chemical Society 130, 12734 (2008), pMID: 18761456, http://dx.doi.org/10.1021/ja803273s .
- Duque et al. (2009) J. G. Duque, M. Pasquali, L. Cognet, and B. Lounis, ACS Nano 3, 2153 (2009).
- Fagan et al. (2013) J. A. Fagan, M. Zheng, V. Rastogi, J. R. Simpson, C. Y. Khripin, C. A. Silvera Batista, and A. R. Hight Walker, ACS Nano 7, 3373 (2013).
- Petersen et al. (2013) E. J. Petersen, X. Tu, M. Dizdaroglu, M. Zheng, and B. C. Nelson, Small 9, 205 (2013).
- Zhang et al. (2014) Y. Zhang, C. Liu, A. Balaeff, S. S. Skourtis, and D. N. Beratan, Proceedings of the National Academy of Sciences 111, 10049 (2014).
- Giese et al. (2001) B. Giese, J. Amaudrut, A. K. Kohler, M. Spormann, and S. Wessely, Nature 412, 318 (2001).
- Barnett et al. (2001) R. N. Barnett, C. L. Cleveland, A. Joy, U. Landman, and G. B. Schuster, Science 294, 567 (2001).
- Senthilkumar et al. (2005) K. Senthilkumar, F. C. Grozema, C. F. Guerra, F. M. Bickelhaupt, F. D. Lewis, Y. A. Berlin, M. A. Ratner, and L. D. A. Siebbeles, Journal of the American Chemical Society 127, 14894 (2005), doi: 10.1021/ja054257e.
- Lewis et al. (1997) F. D. Lewis, T. F. Wu, Y. F. Zhang, R. L. Letsinger, S. R. Greenfield, and M. R. Wasielewski, Science 277, 673 (1997).
- Genereux and Barton (2010) J. C. Genereux and J. K. Barton, Chemical Reviews 110, 1642 (2010).
- Lewis et al. (2006) F. D. Lewis, H. H. Zhu, P. Daublain, T. Fiebig, M. Raytchev, Q. Wang, and V. Shafirovich, Journal of the American Chemical Society 128, 791 (2006).
- Renaud et al. (2013) N. Renaud, Y. A. Berlin, F. D. Lewis, and M. A. Ratner, Journal of the American Chemical Society 135, 3953 (2013).
- Dresselhaus et al. (2001) M. S. Dresselhaus, G. Dresselhaus, and P. Avouris, eds., Carbon Nanotubes: Synthesis, Structure, Properties and Applications, Vol. 80 in Springer Topics in Applied Physics (Springer Verlag GmbH & Co. KG., 2001).
- Ajiki and Ando (1993) H. Ajiki and T. Ando, J. Phys. Soc. Japan 62, 1255 (1993).
- Ignatova et al. (2011) T. Ignatova, H. Najafov, A. Ryasnyanskiy, I. Biaggio, M. Zheng, and S. V. Rotkin, ACS Nano, ACS Nano 5, 6052 (2011).
- Jin et al. (2008) H. Jin, D. A. Heller, and M. S. Strano, Nano Letters 8, 1577 (2008), pMID: 18491944, http://dx.doi.org/10.1021/nl072969s .
- Tataurov et al. (2008) A. V. Tataurov, Y. You, and R. Owczarzy, Biophysical Chemistry 133, 66 (2008).
- Hertel et al. (2010) T. Hertel, S. Himmelein, T. Ackermann, D. Stich, and J. Crochet, ACS Nano 4, 7161 (2010), pMID: 21105744, http://dx.doi.org/10.1021/nn101612b .
- Ridley and Zerner (1973) J. Ridley and M. Zerner, Theoretica chimica acta 32, 111 (1973).
- Voityuk (2013) A. A. Voityuk, Wiley Interdisciplinary Reviews: Computational Molecular Science 3, 515 (2013).
- Tejerina and Reimers (2008) B. Tejerina and J. Reimers, “Cndo/indo,” (2008).
- Venkatramani et al. (2011a) R. Venkatramani, S. Keinan, A. Balaeff, and D. N. Beratan, Coordination Chemistry Reviews 255, 635 (2011a).
- Venkatramani et al. (2011b) R. Venkatramani, K. L. Davis, E. Wierzbinski, S. Bezer, A. Balaeff, S. Keinan, A. Paul, L. Kocsis, D. N. Beratan, C. Achim, and D. H. Waldeck, Journal of the American Chemical Society 133, 62 (2011b), times Cited: 18.
- Hatcher et al. (2008) E. Hatcher, A. Balaeff, S. Keinan, R. Venkatramani, and D. N. Beratan, Journal of the American Chemical Society 130, 11752 (2008).
- Fonseca et al. (1996) A. Fonseca, E. A. Perpete, P. Galet, B. Champagne, J. B. Nagy, J. M. Andre, P. Lambin, and A. A. Lucas, Journal of Physics B: Atomic, Molecular and Optical Physics 29, 4915 (1996).
- Voityuk (2007) A. A. Voityuk, Chemical Physics Letters 439, 162 (2007).
- Voityuk (2008) A. A. Voityuk, The Journal of Chemical Physics 128, 115101 (2008).
- Thiel (2014) W. Thiel, Wiley Interdisciplinary Reviews: Computational Molecular Science 4, 145 (2014).
- Voityuk (2006) A. A. Voityuk, Chemical Physics Letters 427, 177 (2006).
- Kilina and Tretiak (2007) S. Kilina and S. Tretiak, Advanced Functional Materials 17, 3405 (2007).
- Chen et al. (2011) H. Chen, M. A. Ratner, and G. C. Schatz, The Journal of Physical Chemistry C 115, 18810 (2011), http://dx.doi.org/10.1021/jp205262u .
- Santoro et al. (2013) F. Santoro, R. Improta, F. Avila, M. Segado, and A. Lami, Photochem. Photobiol. Sci. 12, 1527 (2013).
- Crochet et al. (2011) J. J. Crochet, S. Hoseinkhani, L. Luer, T. Hertel, S. K. Doorn, and G. Lanzani, Phys. Rev. Lett. 107, 257402 (2011).
- Ham et al. (2009) M.-H. Ham, B.-S. Kong, W.-J. Kim, H.-T. Jung, and M. S. Strano, Phys. Rev. Lett. 102, 047402 (2009).
- Note (1) We cannot exclude that UV irradiation may influence defects at the ends of the tubes which are open to water, however such mechanism should be negligible due to the high aspect ratio of our tubes (the length nm).
- Wang et al. (2006) F. Wang, Y. Wu, M. S. Hybertsen, and T. F. Heinz, Phys. Rev. B 73, 245424 (2006).
- Perebeinos and Avouris (2008) V. Perebeinos and P. Avouris, Phys. Rev. Lett. 101, 057401 (2008).
- Zhu et al. (2007) Z. Zhu, J. Crochet, M. S. Arnold, M. C. Hersam, H. Ulbricht, D. Resasco, and T. Hertel, The Journal of Physical Chemistry C 111, 3831 (2007).
- Harrah et al. (2011) D. M. Harrah, J. R. Schneck, A. A. Green, M. C. Hersam, L. D. Ziegler, and A. K. Swan, ACS Nano 5, 9898 (2011).
- Lefebvre et al. (2004) J. Lefebvre, P. Finnie, and Y. Homma, Phys. Rev. B 70, 045419 (2004).
- Crochet et al. (2012) J. J. Crochet, J. G. Duque, J. H. Werner, and S. K. Doorn, Nat Nano 7, 126 (2012).
- Harrah and Swan (2011) D. M. Harrah and A. K. Swan, ACS Nano 5, 647 (2011), http://pubs.acs.org/doi/pdf/10.1021/nn1031214 .
- Ghosh et al. (2010) S. Ghosh, S. M. Bachilo, R. A. Simonette, K. M. Beckingham, and R. B. Weisman, Science 330, 1656 (2010).
- Duque et al. (2011) J. G. Duque, G. Gupta, L. Cognet, B. Lounis, S. K. Doorn, and A. M. Dattelbaum, The Journal of Physical Chemistry C 115, 15147 (2011).
- Roxbury et al. (2011) D. Roxbury, X. Tu, M. Zheng, and A. Jagota, Langmuir 27, 8282 (2011).
- Kinder and Mele (2008) J. M. Kinder and E. J. Mele, Phys. Rev. B 78, 155429 (2008).
- Matsuda et al. (2010) K. Matsuda, Y. Miyauchi, T. Sakashita, and Y. Kanemitsu, Phys. Rev. B 81, 033409 (2010).
- Ignatova et al. (2014) T. Ignatova, M. Blades, J. G. Duque, S. K. Doorn, I. Biaggio, and S. V. Rotkin, Phys. Chem. Chem. Phys. 16, 26715 (2014).
- Casey et al. (2008) J. P. Casey, S. M. Bachilo, and R. B. Weisman, J. Mater. Chem. 18, 1510 (2008).
- D’Souza et al. (2007) F. D’Souza, R. Chitta, A. S. D. Sandanayaka, N. K. Subbaiyan, L. D’Souza, Y. Araki, and O. Ito, Journal of the American Chemical Society 129, 15865 (2007), pMID: 18052162.
- Hu et al. (2008) L. Hu, Y.-L. Zhao, K. Ryu, C. Zhou, J. Stoddart, and G. Gruner, Advanced Materials 20, 939 (2008).
- Roca-Sanjuan et al. (2006) D. Roca-Sanjuan, M. Rubio, M. Merchan, and L. Serrano-Andras, The Journal of Chemical Physics 125, 084302 (2006).
- Schoppler et al. (2011) F. Schoppler, C. Mann, T. C. Hain, F. M. Neubauer, G. Privitera, F. Bonaccorso, D. Chu, A. C. Ferrari, and T. Hertel, The Journal of Physical Chemistry C 115, 14682 (2011).
- Ardizzone et al. (2015) V. Ardizzone, Y. Chassagneux, F. Vialla, G. Delport, C. Delcamp, N. Belabas, E. Deleporte, P. Roussignol, I. Robert-Philip, C. Voisin, and J. S. Lauret, Phys. Rev. B 91, 121410 (2015).
- www.thorlabs.com/thorproduct.cfm?partnumber=FEL (0450) www.thorlabs.com/thorproduct.cfm?partnumber=FEL0450, .
Supplementary Information: Table of Content
-
1.
Details on DNA autoionization modeling
-
2.
Discussion of alternative recombination mechanisms
-
3.
Rate equations and PL quenching rate for DNA-induced non-radiative recombination channel
-
4.
Experimentally measured excitation functions for UV-vis pump
-
5.
Transmission data for UVLP filter
-
6.
Rate equation parameters
-
7.
Comparison of the DNA induced PL quenching for 6 different SWNT chiralities
V SI: Details on DNA autoionization modeling
Although modeling of a DNA-SWNT-water system of the same size as in the experiment is beyond our current computing abilities, we were able to provide clear theoretical evidence for fast AI of the - excited states in DNA wrapped around a typical SWNT.
The most abundant SWNT species in the CoMoCat samples are known to be (6,5) nanotubes (see Fig.7). The MD simulation was done on a fragment of (6,5) SWNT with two intertwinned ssDNA oligomers (GT)n where , as shown in Fig.6 (upper inset). Although ssDNA with has been used in our experiments, we note that both olygomers have been shown earlier to make a similar wrapping on the nanotube surfaceLustig et al. (2005). Frames taken after several ns of MD simulation were used to determine the geometry of the DNA-SWNT complex solvated in TIP3P water box. A shorter chain with 14-20 bases (excluding backbone) along with the single unit cell of (6,5) SWNT (364 atoms) were used for quantum modeling due to computational expenses. The quantum-chemistry INDO/s calculation has been performed, followed by a Green’s Function based calculation of the autoionization within a perturbation theory. Time-dependent AI probability for a - excited DNA base was calculated (for various configurations) and analyzed (see main text for statistics of AI collected over the whole trajectory). The AI probability was also convolved with the theoretical excitation spectrum, giving the total efficiency of UV-ionization, as measured in the experiment.
Here we provide more details on the quantum-mechanical model. Let us denote by the Dirac states of DNA only, taken in a water environment, which are solutions of the corresponding Hamiltonian :
| (9) |
where the quantum number labels non-hybridized (bare) MOs (the energy of the states was renormalized in order to match the experimental absorption band). These Dirac states are mostly localized on individual bases.
Corresponding states of the isolated SWNT are derived from a similar equation:
| (10) |
where the quantum number includes both linear and angular momentum, as well as all other required quantum numbers for the SWNT one-electron energy levels. Those levels are degenerate due to the high symmetry of the SWNT, except for a few MOs of special symmetry. The Green’s function of the combined system will be defined via the total Hamiltonian:
| (11) |
where is the interaction/coupling between the DNA and the SWNT, labels the complete set of hybridized MOs of the complex. We will use below a special notation to distinguish unoccupied orbitals: .
This formalism allows us to define the electron autoionization process as an evolution of the - excited state into the state with the electron on the SWNT and the "hole" on the DNA (or vice versa). The initial (many-particle) Dirac state is given by: , where we denote the SWNT ground state by zero. The final state is (correspondingly for hole tunneling we take as the final state). We stress that in both initial and final state MOs correspond to the vacant state among normally occupied orbitals (a hole). Two other states: and belong to normally occupied (particle) states. The scattering Green’s function is as follows (notice that in this section):
| (12) |
where in the r.h.s. we use spectral decomposition over the complete particle-hole basis set. We allow the final state to have a hole in a different MO (which corresponds to the hole which tunnels to another base along the DNA chain). Similarly we can write a Green function for the process of an autoionization of the hole into the SWNT when the electron stays at the DNA in the final state:
| (13) |
Neglecting small overlap integrals between occupied and unoccupied states , which has been confirmed numerically, and assuming the thermal equilibrium concentrations of electrons in unoccupied orbitals: and holes in the occupied orbitals: are negligible compared to unity, the Green’s function Eq.(12) may be written as:
| (14) |
and it separates into two one-particle Green functions for the electron and hole components:
| (15) |
The probability of autoionization is:
| (16) | |||
Fig.6 shows the representative time dynamics of the hole AI for several HOMOs, as labeled in the figure legend. Rabi oscillations are prominent, overlaid with an overall increase of the probability to find a hole with its final state on the SWNT (anywhere in the valence band). The middle panel shows statistics for a G- and T-base population of the 40 MOs with the smallest energy (counted from the charge neutrality point).
VI SI: Discussion of alternative recombination mechanisms
The quantum yield of PL is proportional to the ratio: , which decreases under second-color UV illumination. Thus, the non-radiative rate in the lowest exciton state should increase or the radiative rate should decrease. According to a detailed equilibrium principle, the latter should be accompanied with lower absorption (bleaching). UV irradiation was previously suggested to have a direct influence on the nanotube electronic structure, for example, via UV-assisted defect creation, SWNT functionalization or formation of chemical bonds Crochet et al. (2011); Ham et al. (2009) that lead to lower . This resulted in absorption and PL bleaching, typically long lasting effects with appreciable recovery times which were not observed in our case. This is likely because our samples contain tubes densely wrapped with the (GT) DNA, which is known to cover the SWNT surface densely111We cannot exclude that UV irradiation may influence defects at the ends of the tubes which are open to water, however such mechanism should be negligible due to the high aspect ratio of our tubes (the length nm). without holes, suppressing surface functionalization Roxbury et al. (2012).
In this work we introduce a new nonradiative mechanism of exciton decay. Here we briefly discuss several existing mechanisms and argue why they cannot explain our two-color PL. Three main groups of PL nonradiative decay channels were considered in the earlier works:
1. At very high excitation intensity, when the number of excitons per SWNT is larger (much larger) than one, the exciton-exciton (Auger recombination) decay mechanism Wang et al. (2006) is important. A similar exciton-electron Auger recombination was shown to be less efficient Perebeinos and Avouris (2008); Zhu et al. (2007) than the multi-exciton channel due to strong restrictions imposed on the symmetry of electronic states participating in such a transition. These symmetry conditions are difficult to satisfy in a two-particle process, unless there are bound electrons in deep (mid-band-gap), strongly localized states or numerous free charge carriers in conduction or valence bands.
2. For an exciton (or e-h pair) in the (and higher) subbands which overlaps with the single-electron continuum in a lower subband (for example, ), the electron-electron Hertel et al. (2010) (or electron-phonon Harrah et al. (2011)) scattering results in an intersubband relaxation. This non-radiative channel naturally does not apply to excitons, lying below a corresponding single-electron continuum of states.
3. Many-particle (multi-state) non-radiative channels can become very efficient under the condition that (a) many-particle interaction satisfies required symmetry selection rules and (b) the process is resonant in energy, that is, the energy of the many-particle state coincides with the exciton energy. Such mechanisms include PAIEI Perebeinos and Avouris (2008) and a number of defect- or impurity-based exciton scattering models Harrah et al. (2011); Lefebvre et al. (2004); Crochet et al. (2012); Harrah and Swan (2011); Ghosh et al. (2010).
The mechanisms 2 and 3 were not shown to be activated by light.
Because of the protective DNA layer, densely coating the SWNT surface, defect formation and non-radiative exciton recombination mechanisms based on it seem unlikely to happen in our experiment. Even though the DNA wrapping could be, arguably, corrupted during the UV irradiation, we did not detect this effect in our samples. This would allow access of water molecules to the SWNT surface thus increasing the non-radiative decay. However, it is inconsistent with the fact that the anomalous PL was fully reversible and recovered instantaneously after the second-color illumination was turned off. Also the solution contained no free DNA, since pure heavy water was substituted for the DNA citric buffer in our samples. In the event of DNA desorption from the tube walls under UV irradiation, its concentration in solution will be minuscule and the reverse process of restoration of the wrap will not happen for entropy reasons. Thus the DNA unwrapping, if it happened, should be easily detectable in our experiments. We note that we did not observe the effect in tubes suspended with DOC or SDBS, where the concentration of the free surfactant in solution is always high and surfactant molecules may indeed exchange between solvated phase and the phase agglomerated on the tube surface Duque et al. (2011); Roxbury et al. (2011).
Excitation power was light quanta per tube, always below the limit of creating multiple excitations per tube. Thus any exciton-exciton interaction mechanisms can be disregarded under main (visible) excitation, and even more under the weaker UV illumination. Finally, the intersubband relaxation mechanisms can be excluded, due to non-overlap of the exciton with its continuum. Then only mechanisms involving free charge carriers need to be considered.
It is known that additional free charge carriers enhance nonradiative recombination rates Kinder and Mele (2008); Matsuda et al. (2010). However, direct generation of the e-h pairs in the upper SWNT subbands with the UV pump shows a resonant enhancement at the PLE lines of these subbands and should vary with the SWNT chirality (not consistent with the data). Besides this, the exciton generation still leaves the total charge density of SWNT the same, and does not break the charge neutrality by itself. Thus, it does not lead to tube doping and cannot explain the decrease in the PL yield unless additional ionization and/or trapping mechanisms are invoked.
Therefore, one has to assume that there is a new mechanism, providing a steady-state doping of the SWNT, due to a resonant photoexcitation of the tube surrounding. The photoexcited states should be shallow enough to allow fast "instantaneous" response upon turning two-color excitation on and off. This excludes the electrons trapped in solvated states in surrounding water. We note that the same samples showed an interesting PL behavior during the formation of the complexes with the multivalent ionsIgnatova et al. (2014) to be discussed elsewhere.
What could be the origin of these shallow states? We show in the main text that the resonantly photoexcited DNA undergoes a - transition, with the energy of the excitation above the forbidden gap of the DNA eV, and then transfers the excited charge carrier into the SWNT valence and conduction bands. Similar charge transfer has been observed earlier in other SWNT hybrids: with porphyrines Casey et al. (2008), fullerenes D’Souza et al. (2007), and organic molecules Hu et al. (2008). Indeed the DNA ionization potential is 8.9-9.3 eV and 8.25-8.62 eV Roca-Sanjuan et al. (2006); Belau et al. (2007) for thymine and guanine bases correspondingly, it can vary in different solvation states. Thus the excited states are in resonance with the conduction bands of a typical SWNT, which has a work function on the order of 5 eV and a band gap or the order of 1 eV.
We show in the main text that the photoexcited DNA electron can autoionize in the SWNT bands. This creates an additional free charge carrier density (although the whole complex DNA-SWNT is electrically neutral), which facilitates the electron-electron scattering and non-radiative decay of the exciton. Such a mechanism would not vary among SWNTs of different chirality unless the photoexcited state moves out of the resonant window, thus decreasing the autoionization rate. This, however, would require tubes with extremely large band gaps, not found in our samples.
VII SI: Rate equations and PL quenching rate for DNA-induced non-radiative recombination channel
We use rate equations for a 4-level system of exciton manifolds (including the ground state) of the SWNT. Here where is the subband index of the lowest exciton subbands, coupled to each other and to the ground state via the classical rate equations:
| (22) |
where is the exciton population of the level (the state), , are generating functions (excitation/pump spectral functions), is the second-color excitation efficiency, are intersubband relaxation rates, and are the radiative/nonradiative rates of the corresponding states. Radiative and nonradiative rates were taken from Hertel et al. (2010); Harrah et al. (2011); Schoppler et al. (2011) and presented in Table 1. Generating functions were directly measured with single-color excitation and presented in Fig.7.
In addition to standard coupling parameters , known from previous works on monochromatic excitation, we add a new non-radiative decay rate: , specific to the nonradiative recombination channel induced in the subband by second-color photoexcitation (UV). We assign this channel to the photoexcitation of the DNA followed by autoionization in the subband, as described in the main text.
The steady-state left hand side equals zero in Eq.(22), allowing a simple solution for the populations of the states, , if the generation spectral functions are known. In neglecting the radiative transition from all levels except for the lowest one, the total PL intensity is given by the product of the radiation rate of this level and it’s population factor: . After simple math it can be written as a product of three terms:
| (26) |
where the term accounts for the relaxation of the charge carriers from the subband into the subband, the second term gives a similar internal yield for the intersubband relaxation of charge carriers into the subband, and the last term is the PL efficiency in the lowest subband. Here we explicitly included , an additional non-radiative relaxation rate due to the photoexcited DNA. We assume that the conversion rate in the upper subbands is large: or larger and that it is independent of the excitation energy which is probably accurate due to the fast and efficient intrasubband relaxation. Then it can be included together with the UV efficiency in a single factor , and we rewrite the solution as:
| (30) |
where the first three terms can be related to the PL intensity at the single-color (visible) excitation. In order to compare this with the experimental data one needs to correct the generation spectral function (pump) by the transmission through the UVLP filter. We had to measure this correction function ourselves due to a found inconsistency with the nominal transmission data presented by the manufacturer (see Fig.8). Finally, the single-color PL intensity (while blocking the UV-line with a filter) can be written as:
| (31) |
where is the visible excitation spectral function corrected for UVLP filter transmission.
Two-color PL intensity is then:
| (32) |
We did not make any approximation in this expression yet, except for assuming to be independent of energy (which includes an energy independent factor ). It is useful to resolve Eq.(32) for , for which the solution is given by:
| (33) |
We emphasize that all quantities here are the experimentally measured ones: and are the PL intensity under one-color (vis) and two-color (vis+uv) excitation correspondingly; is the correction transmission function of the UVLP filter; and are the excitation functions for one-color illumination; and is the constant UV pump efficiency .
Total excitation is given by:
| (34) |
where we single out the excitation efficiency ratio:
| (35) |
which shows how strong the second-color pump is compared to the main color source. When the UV excitation creates a large number of excitons in higher subbands and gives a considerable rise to the total PL. We also provide, for the sake of completeness, an expression for the relative efficiency of the dual-color excitation with respect to the single-color one:
| (36) |
In the main text we defined the differential PL function as:
| (37) |
Corresponding normalized differential PL can be defined as the ratio:
| (38) |
In the main text we also defined the normalized spectral quenching rate:
| (39) |
where is the non-radiative rate and is the radiative recombination rate in the subband measured for one-color (vis) excitation. Then and are the total decay rates under one-color and dual-color pumps respectively.
Substituting Eqs.(31,32) into (38) and making use of the short-cut notations given by Eqs.(35,39) we obtain the following formula:
| (40) |
We emphasize that all the terms are non-negative. The anomalous (negative) differential PL corresponds to .
Substituting Eqs.(31,32) into (39) and making use of the same short-cut notations, we obtain the DNA decay rate as a percent of the one-color total decay rate, :
| (41) |
which can be simplified for data analysis by using short-cut notations for one/two-color PL quantum yield:
| (42) |
which finally results in Eq.(8)of the main text:
| (43) |
VIII SI: Experimentally measured excitation functions for UV-vis pump
Experimentally measured excitation functions (generation term in the rate equations) and are presented in Fig.7. The data is combined from 3 separate measurements, normalized by the total PL excitation strength, following the procedure fromArdizzone et al. (2015). Eleven SWNT species were found in the CoMocat solution: all of the strongest (n,m) peaks in the visible range are indicated on the Figure.
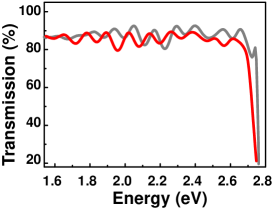
IX SI: Transmission data for UVLP filter
Fig.8 shows the experimental (measured) absorption spectrum of the UVLP-450 filter, compared to the table data provided by the manufacturerwww.thorlabs.com/thorproduct.cfm?partnumber=FEL (0450). A clear difference is seen between nominal and actual data which should be taken into account in rate equation analysis.
X SI: Rate equation parameters
All SWNT rates used in the rate equation analysis are given in Table1 along with the maximum rates calculated for the DNA induced PL quenching.
| 6.3 | 10-3 | 0.035-0.05 | 6.3 | 76.9 | 0.017-0.025 |
XI SI: Comparison of the DNA induced PL quenching for 6 different SWNT chiralities
The normalized differential PL, , for a (6,5) nanotube is shown in Fig.9 along with the excitation efficiency function and the normalized function . For a (6,5) tube the DNA induced exciton quenching can reach above 30% of the total non-radiative decay rate. Other chiralities show similar differential PLE spectra with two main features: on the UV side each spectrum has a negative band (note that the abscissa axis is reversed for ) around 530 nm where the intensity of one-color (vis) excitation PL exceeds the two-color PL intensity. This also corresponds to the region of low efficiency of the UV pump (). On the IR side (for ) several features can be found. They are positioned differently for different tubes following the pattern of individual resonances of a particular SWNT (compare different chiralities in Fig.9). These features correspond to the resonant UV excitation which increases the PL signal and compensates for the effect of the DNA (). The anomalous PL can be observed only for small , in the region where the direct UV pump is insufficient compared to the main excitation line.