Dramatic pressure-driven enhancement of bulk skyrmion stability
The recent discovery of magnetic skyrmion lattices Mühlbauer et al. (2009) initiated a surge of interest in the scientific community. Several novel phenomena have been shown to emerge from the interaction of conducting electrons with the skyrmion lattice, such as a topological Hall-effect Neubauer et al. (2009) and a spin-transfer torque at ultra-low current densities Jonietz et al. (2010). In the insulating compound Cu2OSeO3, magneto-electric coupling enables control of the skyrmion lattice via electric fields White et al. (2012, 2014), promising a dissipation-less route towards novel spintronic devices. One of the outstanding fundamental issues is related to the thermodynamic stability of the skyrmion lattice. To date, the skyrmion lattice in bulk materials has been found only in a narrow temperature region just below the order-disorder transition. If this narrow stability is unavoidable, it would severely limit applications. Here we present the discovery that applying just moderate pressure on Cu2OSeO3 substantially increases the absolute size of the skyrmion pocket. This insight demonstrates directly that tuning the electronic structure can lead to a significant enhancement of the skyrmion lattice stability. We interpret the discovery by extending the previously employed Ginzburg-Landau approach and conclude that change in the anisotropy is the main driver for control of the size of the skyrmion pocket. This realization provides an important guide for tuning the properties of future skyrmion hosting materials.
Skyrmions were first introduced in the context of topologically protected excitations in the field theory of hadrons Skyrme (1962). Although later the quark theory proved successful, the concept of skyrmions and their mathematical beauty have found applications in various topics within many body physics, such as 2D electron gases Sondhi et al. (1993); Brey et al. (1995), Bose condensation Ho (1998); Khawaja and Stoof (2001) and, particularly, magnetic systems. Initially, magnetic skyrmions were only theoretically predicted Bogdanov and Hubert (1994); Rößler et al. (2012), but subsequently they have been found experimentally in the form of skyrmion lattices in several chiral systems, including conductive MnSi Mühlbauer et al. (2009) and insulating Cu2OSeO3 Seki et al. (2012). On top of the manipulation of the whole skyrmion lattice Jonietz et al. (2010); White et al. (2012, 2014), successful control of individual skyrmions has been demonstrated using lasers Finazzi et al. (2013) and scanning-tunneling microscopes Romming et al. (2013), indicating ’skyrmionics’ to be a promising avenue for the field of spintronics.
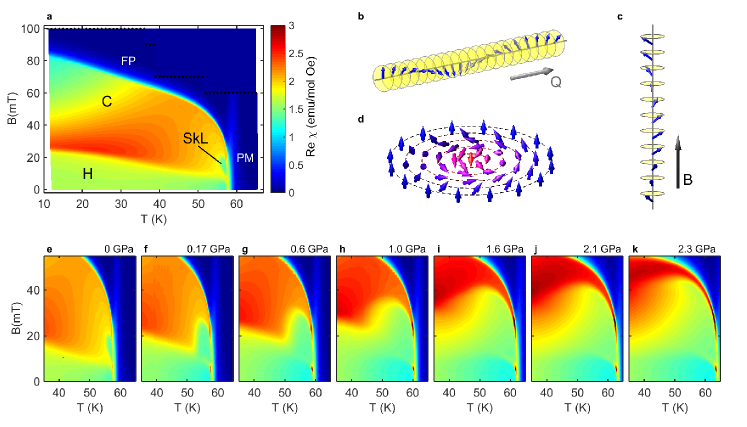
The compounds that exhibit a skyrmion lattice display remarkably universal phase diagrams - see for example Figure 1a. Below a critical temperature the system orders as a helimagnet, with spins rotating within a plane that is perpendicular to the propagation vector , Figure 1b. Upon the application of a magnetic field the magnetic structure transforms into a conical arrangement, Figure 1c, where spins precess about a cone that is aligned with the direction of magnetic field. For even larger values the spins are field-polarized. The skyrmion phase is found to lie adjacent to the order-disorder transition, at approximately half of the value of the critical magnetic field . It exhibits a hexagonal arrangement Mühlbauer et al. (2009) of individual skyrmions, Figure 1d, where the central spins point in the opposite direction to the applied magnetic field, and a chiral sense of rotation of the magnetic spins yields a finite topological charge Braun (2012).
So far the temperature width of the skyrmion pocket in bulk samples has been limited to in all investigated cubic chiral compounds. A substantial enhancement of the size of the skyrmion pocket has been demonstrated for thin films and ultra thin slabs of these materials Yu et al. (2010); Seki et al. (2012), with thickness nm. In these quasi-2D systems the anisotropy is considered to play a major role in the enhanced stabilization of the skyrmion lattice Butenko et al. (2010). On the other hand, the resultant phase diagrams are not generic and depend on the material as well as on the method of preparation Li et al. (2013); Tonomura et al. (2012). Thus, finding a link between the universal phase diagram in bulk materials and the magneto-crystalline anisotropy presents a major challenge for the deeper understanding of the formation and stability of the skyrmion phase.
In bulk samples the anisotropy arises in the form of the spin-orbit interaction, and it is the weakest of the energy scales present in skyrmion compounds , where and are the Dzyaloshinskii-Moriya and the ferromagnetic exchange interactions, respectively. favors a perpendicular orientation of neighboring spins, and is responsible for the formation of the chiral helimagnet ground state with a long wavelength modulation , being the inter-atomic distance. The anisotropy then pins the helices along preferred directions, and hence determines the value of the first critical magnetic field above which the conical structure is stabilized.
To further our understanding of the stability of the skyrmion lattice, it is imperative to establish the parameter range in which the skyrmion lattice is physically favorable with respect to other phases, and further how the size of the skyrmion phase depends on , and . In that context, the application of hydrostatic pressure is a well-known technique which allows fine-tuning of energy scales through tiny shifts in atomic positions. Before the discovery of its skyrmion lattice phase, MnSi was intensively investigated Pfleiderer et al. (2001); Doiron-Leyraud et al. (2003) due to a complete suppression of long-range magnetic order above a critical pressure ( GPa) and the discovery of non-Fermi liquid behavior for . A similar suppression of magnetic order has been observed in FeGe Pedrazzini et al. (2007) around 19 GPa. In contrast, the ordering temperature of Cu2OSeO3 increases under pressure Huang et al. (2011); Sidorov et al. (2015), thus emphasizing the importance of detailed investigation of its pressure dependence. Here we present an extensive study of the phase diagram of Cu2OSeO3 under hydrostatic pressure up to 2.3 GPa, and discover that the absolute size of the skyrmion pocket in bulk samples can be dramatically enlarged.
High-quality magnetic ac susceptibility accurately traces the magnetic phases, as illustrated in Figure 1a for zero-pressure. As can be seen from the zoomed-in part in Figure 1e, the skyrmion phase is manifested as a region of lower susceptibility (yellow) compared to the surrounding conical phase (red). For it occupies a very small part of the phase diagram, adjacent to the order-disorder boundary, with a maximum extent in temperature of 2 K. The maximum field range amounts to around 15 mT, and at lower field values the skyrmion pocket becomes narrower, forming a shape of an inverted tear-drop. The situation drastically changes by the application of even a small hydrostatic pressure ( GPa, Figure 1f). The skyrmion pocket increases in size, especially the low magnetic field region, more than doubling over the zero-pressure extent. In addition to the observed growth, one can notice a qualitative change in the way the phases are arranged in that part of the phase diagram. Namely, under pressure the skyrmion phase borders directly with the helimagnetic phase without the conical phase in-between. As shown in Figures 1g-k, further increase of the pressure evidences a continuation of the growth of the low-susceptibility region, both towards lower temperatures as well as towards larger magnetic fields.
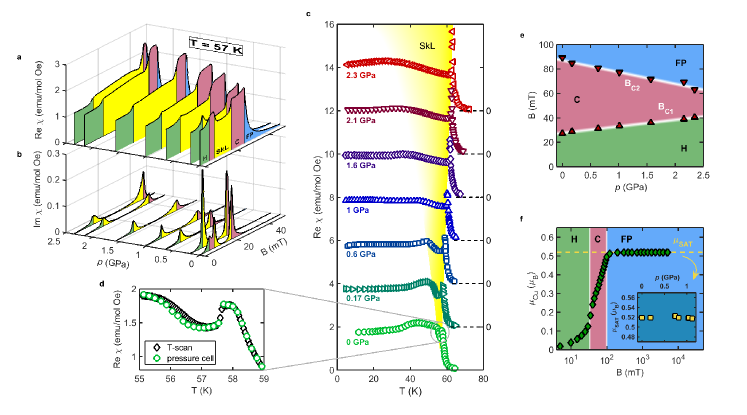
Quantitatively, we can identify the phase boundaries and extract their pressure dependence from individual scans. Figures 2a-b show field scans of real and imaginary susceptibility at K, the middle of the skyrmion pocket at zero pressure. The phase boundaries are determined by maxima in the imaginary component, except for the transition between the conical (red) and the field polarized state (blue) where a kink in the real part marks the boundary. On the high-field side the skyrmion pocket (yellow) transforms into the conical phase by a steep increase of the real component, while the imaginary part exhibits a sharp peak. On the low-field side the presence of the conical phase between the helimagnetic (green) and the skyrmion phase at zero pressure is revealed by two peaks in the imaginary part, while at elevated pressures a single peak is observed. To our knowledge this represents the first experimental evidence that the helimagnetic phase and the skyrmion phase are thermodynamically distinct. In the real part this transition becomes less pronounced, because increases with pressure, placing field scans at 57 K further away from the ordering temperature. We showed recently that the strength of the susceptibility anomaly marking the border of the skyrmion pocket becomes quickly suppressed for Levatić et al. (2014).
In our experiment the temperature was slowly increased while magnetic field was continuously ramped between zero and a maximum value. Due to the slow temperature change (K/s) and reduced field range around the skyrmion pocket (black dots in Figure 1a), successive field scans were spaced by no more than 0.2 K, providing a very good resolution in temperature. This enables us to determine the temperature width of the skyrmion phase by plotting for fixed . Extracted temperature profiles through the middle of the skyrmion pocket are displayed in Figure 2c. In Figure 2d we compare extracted from the maps to a temperature scan recorded on cooling using a standard susceptibility setup. The overlap of the two curves demonstrates that the extracted profiles presented in Figure 2c probe directly the thermodynamic phase boundaries.
Even at the smallest applied pressures an enhanced stability of the skyrmion phase is readily observed: compared to the zero pressure case, where K (3% of ), it reaches K at 0.6 GPa, corresponding to 17% of . If the same relative increase is achieved in the recently discovered skyrmion compound Tokunaga et al. (2015) Co8Zn9Mn3 with the ordering temperature at 322 K (C), the skyrmion lattice would be stable even below C, this covering the usual operational temperature range for most electronic circuits.
With further increase of pressure the low-temperature boundary to the conical phase becomes less pronounced, transforming into a wide cross-over. At the highest pressure ( GPa) the low susceptibility region extends almost to 30 K, indicating that skyrmions exist down to at least half of the ordered phase diagram in the high-magnetic field region. It remains an open question as to what kind of a spatial distribution is taken by skyrmions at high pressures and whether they still form a well-defined lattice.
At low temperatures the helical and conical phases are thermodynamically stable, although with pressure the area covered by the conical phase is substantially reduced from both high and low field sides compared with ambient pressure, as revealed in Figure 2e. More importantly, we observe an increase of the first critical magnetic field that marks the transition from the helical to the conical phase. As has been introduced above, is linked directly to the anisotropy energy which determines the direction of the helical propagation vector in the absence of an applied magnetic field . Through the adaptation of the effective model developed in Ref Mühlbauer et al., 2009, below we demonstrate that such an increase of can explain the observed expansion of the bulk skyrmion phase stability.
We start from the usual Ginzburg-Landau functional for the magnetization M of the system Izyumov (1984)
| (1) |
where the term is related to the temperature-dependent tuning parameter . Here, controls the transition and, in our approach, is adopted to reproduce the experimental and enable us to predict the phase diagram in absolute units of temperature. The microscopic parameters , and are related to experimental observables in a simple way: , (Ref. Janson et al., 2014), while as mentioned previously we assume .
It has been shown Mühlbauer et al. (2009) that when thermal fluctuations around the mean-field solution are included, the skyrmion lattice phase becomes stable close to . However, it remained unknown as to the width of the temperature window over which the stabilization can be expected to occur. In order to address this question, first it is necessary to establish the functional relation between the tuning parameter and the thermodynamic temperature . Around the mean-field solution the upper-critical field is related to through , where reflects the shift of the transition temperature away from its mean-field value due to the linear effects of fluctuations. In addition, can itself be directly extracted from the experimentally established phase diagram, Figure 1a. We find that it follows the form of a critical behavior
| (2) |
with critical exponent , as presented in the inset of Figure 3. This leads to the simple relation for
| (3) |
The square-root dependence is preserved across the pressure range investigated in this study.
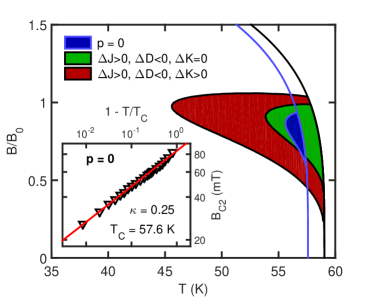
Now we can proceed with the discussion of the size of the skyrmion pocket in terms of thermodynamic temperature . As mentioned above, the inclusion of thermal fluctuations is necessary to stabilize the skyrmion lattice over the conical spin arrangement. However, it has been suggested recently Janoschek et al. (2013) that the fluctuations close to are strongly interacting, lowering the transition temperature and making it first-order. Within the effective model the reduction in is implemented Mühlbauer et al. (2009) by setting the corrections of the order parameter to be smaller than 20%. We keep this approach and in the main panel of Figure 3 plot the resultant order-disorder boundary with the outline of the skyrmion pocket for different values of , and . For the zero-pressure case we adjust the coefficients of the model so that the skyrmion pocket is limited to K below , as found in the experiment. To explore the effect of pressure we consider the particular case of GPa, where the skyrmion pocket is still well defined, and estimate , and from the experimental data: %, %, while % translates to %. It can be shown that the skyrmion pocket grows if the parameter increases, indicating that all of the observed changes contribute positively. If we take into account only and () then we obtain a small increase of the skyrmion pocket. However, a more significant growth is obtained when the observed is included, giving K. The temperature extent is here only indicative since it is known that the Ginzburg-Landau approach is not valid far away from . Additionally, is only a crude approximation which is expected to hold only in a narrow range of parameters. Nevertheless, our analysis demonstrates the importance of anisotropy in stabilizing the skyrmion lattice at temperatures far from the immediate proximity of the ordering temperature. Indeed just change in effective anisotropy can expand the temperature range of the skyrmion stability by 600%!
The crucial role of anisotropy has also been explored in Monte Carlo simulations Buhrandt and Fritz (2013) where it has been found that the correct phase diagram can be reproduced if additional anisotropy-compensation terms are added because of boundary effects. On the experimental side, in the recently discovered skyrmion compound GaV4S8 the orientation of skyrmions is dictated by the magnetic easy axis and not by the direction of magnetic field Kézsmárki et al. (2015). At the same time, the relative size of the skyrmion pocket within the phase diagram of this polar magnet is substantially larger than in the family of chiral magnets such as MnSi and Cu2OSeO3.
While the above-presented model is applied as a continuous-field approximation, an important question is what qualitative changes occur with pressure on the level of the unit cell. This is especially important for Cu2OSeO3 since there are two crystallographically distinct copper sites which couple strongly into tetrahedra with a quantum triplet ground state Janson et al. (2014). These triplets form a trillium lattice which is identical to the lattice of Mn ions in MnSi, and long-range order is then governed by the effective exchange and Dzyaloshinskii-Moriya interactions between the triplets. It follows that the effect of pressure on Cu2OSeO3 can be two-fold: (i) changing the quantum nature of tetrahedrons and (ii) changing the inter-triplet interactions. In order to probe the former effect, we have performed measurements of the magnetization plateau under pressure. The plateau occurs when the system enters the field polarized state for magnetic fields mT, see Figure 2f and inset. It turns out that within the error-bar the observed magnetization plateau does not change, at least for pressures GPa. This means that the tetrahedra remain relatively rigid, while pressure-induced shifts in atomic positions occur dominantly between the tetrahedrons, influencing the effective inter-triplet interactions and justifying the use of the continuous model.
We believe that the results presented in this study and the supporting model clearly demonstrate that although it is the weakest of the energy scales, anisotropy plays a decisive role in stabilization of the skyrmion lattice. Broadening the operational range for the skyrmion lattice and making it more resistant against external fluctuations provides a promising route for future investigations in order to enhance the potential of other skrymion-supporting materials, especially around room temperature Tokunaga et al. (2015), where skyrmion-based applications are foreseen. The deeper theoretical understanding of the various mechanisms leading to skyrmion stability may also guide the rational design of new compounds with favorable characteristics for hosting stable skyrmion phases.
I Methods
Experimental conditions. The single crystal sample was prepared by the chemical vapor transport technique. It was aligned by x-ray Laue backscattering and cut along the direction with dimensions mm3. The ac susceptibility measurements were performed using a balanced coils setup. Two detection coils were wound on an inox tube 2 mm in diameter, with centers of the coils 2.5 mm apart. On top of each detection coil a driving coil was made for generation of ac magnetic field. AC current was supplied by a Keithley 6221 current source and the balance of the coils was achieved by changing a resistance in series with each driving coil. The amplitude of ac magnetic field was 0.1 mT. The detection of the ac signal was done by the lock-in amplifier Signal Recovery 7265. The measurements of the phase diagram for each pressure were performed in a slow temperature drift regime, where the sweeping rate has been controlled between 100 K/s around the skyrmion phase and 700 K/s below 30 K. The magnetic field was generated by a Cryomagnetics 9 T magnet with a sweep rate of 0.1 mT/s (the slowest available on the instrument) between zero and a maximum field value of mT. At higher temperatures the upper field value was regularly decreased in order to increase the density of the measured points inside the ordered part of the phase diagram.
The pressure for AC susceptibility study was generated using a non-magnetic piston cylinder pressure-cell with Daphne oil 7373 as a transmitting medium. Pressure was determined using the relative change of the resistance of a manganine wire compared to the zero-pressure case. The magnetization under pressure was measured in a Quantum Design SQUID magnetometer MPMS using a commercial EasyLab pressure cell. The sample used was mm3 taken from the same batch.
Ginzburg-Landau phenomenology. The phase diagram is expected to be qualitatively captured by Ginzburg-Landau theory for modulated magnetic structures. For the detailed description of the approach we refer to the Refs. Mühlbauer et al., 2009; Izyumov, 1984 and just highlight here the main features of the formalism. The calculations are made in the continuous-field approximation justified by the large ratio of the skyrmion radius to the lattice constant . The Ginzburg-Landau functional is taken up to fourth order in magnetization and second order in magnetization gradients, thus including both the Dzyaloshinskii-Moriya interaction and anisotropies. The magnetic structure is determined by minimization of the free energy, where the order parameter is naturally taken as the local magnetization reduced by the average magnetization of the crystal. A mean-field treatment shows the conical phase to be energetically favorable, but the skyrmion phase lies only slightly higher in energy. By including the Gaussian fluctuations of the free energy the skyrmion phase becomes favorable in a certain range of finite magnetic fields. The fluctuations contribute mainly at the short-length scale and are calculated with the cut-off in the momentum space in order of . The transition to the paramagnetic state is expected to occur when the fluctuations become significant (around of the mean-field value), which determines the ordered phase boundary through the relation . For the calculation of the phase diagram at zero pressure we used the following parameters: , , and . The values of and are in good agreement with a recent density functional calculation Janson et al. (2014). The Ginzburg-Landau approach is considered to break down away from so we leave the field axis normalized to .
II Acknowledgement
We acknowledge discussions with A. Tsirlin, O. Janson, I. Rousochatzakis, N. Nagaosa and A. Rosch. The support from Croatian Science Foundation Project No. 02.05/33, Croatian Ministry of Science, Education and Sport No. 035-0352826-2848, Swiss National Science Foundation and ERC project CONQUEST and Austrian Science Foundation project P27980 - N36 are acknowledged.
III Author contributions
I.Ž. planned the project. I.L., P.P., V.S. and I.Ž. performed the measurements. I.L., V.S. and I.Ž. analyzed the data. H.B. and A.M. performed the sample preparation. The theoretical modeling was carried out by A.K. A.K., J.S.W., H.M.R. and I. Ž. wrote the manuscript.
References
- Mühlbauer et al. (2009) S. Mühlbauer, B. Binz, F. Jonietz, C. Pfleiderer, A. Rosch, A. Neubauer, R. Georgii, and P. Böni, Science 323, 915 (2009).
- Neubauer et al. (2009) A. Neubauer, C. Pfleiderer, B. Binz, A. Rosch, R. Ritz, P. G. Niklowitz, and P. Böni, Phys. Rev. Lett. 102, 186602 (2009).
- Jonietz et al. (2010) F. Jonietz, S. Mühlbauer, C. Pfleiderer, A. Neubauer, W. Münzer, A. Bauer, T. Adams, R. Georgii, P. Böni, R. A. Duine, et al., Science 330, 1648 (2010).
- White et al. (2012) J. S. White, I. Levatić, A. A. Omrani, N. Egetenmeyer, K. Prša, I. Živković, J. L. Gavilano, J. Kohlbrecher, M. Bartkowiak, H. Berger, et al., J. Phys.: Condens. Matter 24, 432201 (2012).
- White et al. (2014) J. S. White, K. Prša, P. Huang, A. A. Omrani, I. Živković, M. Bartkowiak, H. Berger, A. Magrez, J. L. Gavilano, G. Nagy, et al., Phys. Rev. Lett. 113, 107203 (2014).
- Skyrme (1962) T. H. R. Skyrme, Nucl. Phys. 31, 556 (1962).
- Sondhi et al. (1993) S. L. Sondhi, A. Karlhede, S. A. Kivelson, and E. H. Rezayi, Phys. Rev. B 47, 16419 (1993).
- Brey et al. (1995) L. Brey, H. A. Fertig, R. Cote, and A. H. MacDonald, Phys. Rev. Lett. 75, 2562 (1995).
- Ho (1998) T. L. Ho, Phys. Rev. Lett. 81, 742 (1998).
- Khawaja and Stoof (2001) U. A. Khawaja and H. Stoof, Nature 411, 918 (2001).
- Bogdanov and Hubert (1994) N. Bogdanov and A. Hubert, J. Magn. Magn. Mater. 138, 255 (1994).
- Rößler et al. (2012) U. K. Rößler, A. N. Bogdanov, and C. Pfleiderer, Nature 442, 727 (2012).
- Seki et al. (2012) S. Seki, X. Z. Yu, S. Ishiwata, and Y. Tokura, Science 336, 198 (2012).
- Finazzi et al. (2013) M. Finazzi, M. Savoini, A. R. Khorsand, A. Tsukamoto, A. Itoh, L. Duò, A. Kirilyuk, T. Rasing, and M. Ezawa, Phys. Rev. Lett. 110, 177205 (2013).
- Romming et al. (2013) N. Romming, C. Hanneken, M. Menzel, J. E. Bickel, B. Wolter, K. von Bergmann, A. Kubetzka, and R. Wiesendanger, Science 341, 636 (2013).
- Braun (2012) H. B. Braun, Adv. Phys. 61, 1 (2012).
- Yu et al. (2010) X. Z. Yu, Y. Onose, N. Kanazawa, J. H. Park, J. H. Han, Y. Matsui, N. Nagaosa, and Y. Tokura, Nature 465, 901 (2010).
- Butenko et al. (2010) A. B. Butenko, A. A. Leonov, U. K. Rößler, and A. N. Bogdanov, Phys. Rev. B 82, 052403 (2010).
- Li et al. (2013) Y. Li, N. Kanazawa, X. Z. Yu, A. Tsukazaki, M. Kawasaki, M. Ichikawa, X. F. Jin, F. Kagawa, and Y. Tokura, Phys. Rev. Lett. 110, 117202 (2013).
- Tonomura et al. (2012) A. Tonomura, X. Yu, K. Yanagisawa, T. Matsuda, Y. Onose, N. Kanazawa, H. S. Park, and Y. Tokura, Nano. Lett. 12, 1673 (2012).
- Pfleiderer et al. (2001) C. Pfleiderer, S. R. Julian, and G. G. Lonzarich, Nature 414, 427 (2001).
- Doiron-Leyraud et al. (2003) N. Doiron-Leyraud, I. R. Walker, L. Taillefer, M. J. Steiner, S. R. Julian, and G. G. Lonzarich, Nature 425, 595 (2003).
- Pedrazzini et al. (2007) P. Pedrazzini, H. Wilhelm, D. Jaccard, T. Jarlborg, M. Schmidt, M. Hanfland, L. Akselrud, H. Q. Yuan, U. Schwarz, Y. Grin, et al., Phys. Rev. Lett. 98, 047204 (2007).
- Huang et al. (2011) C. L. Huang, K. F. Tseng, C. C. Chou, S. Mukherjee, J. L. Her, Y. H. Matsuda, K. Kindo, H. Berger, and H. D. Yang, Phys. Rev. B 83, 052402 (2011).
- Sidorov et al. (2015) V. A. Sidorov, A. E. Petrova, P. S. Berdonosov, V. A. Dolgikh, and S. M. Stishov, Nature Mat. 1, 1 (2015).
- Levatić et al. (2014) I. Levatić, V. Šurija, H. Berger, and I. Živković, Phys. Rev. B 90, 224412 (2014).
- Tokunaga et al. (2015) Y. Tokunaga, X. Z. Yu, J. S. White, H. M. Ronnow, D. Morikawa, Y. Taguchi, and Y. Tokura, Nature Communications 6, 7638 (2015).
- Izyumov (1984) Y. A. Izyumov, Usp. Fiz. Nauk 27, 845 (1984).
- Janson et al. (2014) O. Janson, I. Rousochatzakis, A. A. Tsirlin, M. Belesi, A. A. Leonov, U. K. R0̈ssler, J. van den Brink, and H. Rosner, Nature Communications 5, 5376 (2014).
- Janoschek et al. (2013) M. Janoschek, M. Garst, A. Bauer, P. Krautscheid, R. Georgii, P. Böni, and C. Pfleiderer, Phys. Rev. B 87, 134407 (2013).
- Buhrandt and Fritz (2013) S. Buhrandt and L. Fritz, Phys. Rev. B 88, 195137 (2013).
- Kézsmárki et al. (2015) I. Kézsmárki, S. Bordács, P. Milde, E. Neuber, L. M. Eng, J. S. White, H. M. Rønnow, C. D. Dewhurst, M. Mochizuki, K. Yanai, et al., Nature Mat. 1, 1 (2015).