The most powerful quasar outflows as revealed by the Civ 1549 resonance line1
Abstract
While quasar outflows may be quasi-ubiquitous, there are significant differences on a source-by-source basis. These differences can be organized along the 4D Eigenvector 1 sequence: at least at low , with only Population A sources radiating at relatively high Eddington ratio and showing prominent high-velocity outflows in Civ 1549 line profiles. We discuss in this paper VLT-FORS observations of Civ 1549 emission line profiles for a high-luminosity sample of Hamburg-ESO quasars and how they are affected by outflow motion as a function of quasar luminosity. Our high-luminosity sample has the notable advantage that the rest frame has been accurately determined from previous VLT-ISAAC observations of H in the J, H, and K bands. This makes measures of inter-line velocity shifts accurate and free of systemic biases. As the redshift increases and the luminosity of the brightest quasars increases, powerful, high-velocity outflows become more frequent. We discuss the outflow contextualisation, following the 4DE1 formalism, as a tool for understanding the nature of the so-called weak lined quasars (WLQ) discovered in recent years as a new, poorly understood class of quasars. We estimate the kinetic power associated with Civ 1549 outflows and suggest that the host galaxies in the most luminous sources likely experience significant feedback.
Keywords galaxies: active; quasars: emission lines; quasars: general
1 Introduction
The optical and UV spectra of quasars show broad and narrow lines emitted by ionic species over a wide range of ionization potentials. A quasar spectrum is usually easily recognizable with the same emission lines almost always present and usually strong ( 20 – 200 Å) (with some exceptions §4.2) in all type-1 AGN. It is useful to distinguish between high- and low-ionization lines (hereafter HILs and LILs, respectively): Civ 1549, Heii4686, Heii 1640, Ovi 1035 among the strongest HILs. Balmer (H, H), optical Feii, Mgii 2800and the Caii IR triplet are frequently observed LILs. We can also between high and low ionization narrow lines: [Oiii] 4959,5007, Heii 1640, Heii4686, [Neiii] (HILs) and Balmer, Oi 1304, Sii 6717,6730, [Nii] 6548,6583 (LILs). Apart from these commonalities, it is important to remark that quasars show widely differing line profiles, intensity ratios, and ionization levels (e.g., Marziani et al. 2015). This is made evident by a comparison between the prototypical Narrow Line Seyfert 1 (NLsy1) I Zw 1, and a broader line object like NGC 5548 (Sulentic et al., 2000). In this context it is especially important to stress that lines do not all show the same profiles. Internal emission line shifts involve both broad and narrow lines (Zamanov et al., 2002; Eracleous and Halpern, 2003; Hu et al., 2008; Hewett and Wild, 2010). Narrow LILs such as narrow H and [Oii] 3727 are the most suitable for estimating the quasar systemic redshift; however they are not easily observable at since they are shifted into the IR. Quasar systemic redshifts reported in literature are significantly more uncertain if . Systemic biases in the SDSS spectra as large as 600 km s-1 have been identified (Hewett and Wild, 2010). They are of the same order of magnitude of internal emission line shifts between HILs and LILs in quasars (Gaskell, 1982; Tytler and Fan, 1992; Marziani et al., 1996; Corbin, 1997).
There is general consensus that broadening of optical and UV emission lines is mostly associated with the Doppler effect reflecting emitting gas motions relative to the observer (scattering and gravitational redshift effects are not clearly assessed in quasar spectra e.g., Gaskell and Goosmann 2013). HIL blueshifts provide evidence of outflow (if the receding side of the outflow is hidden from view, as in an optically thick accretion disk with associated wind) but require rest frame knowledge and proper contextualisation for a correct analysis. A first contextualisation (e.g. radio quiet vs. radio loud; Sulentic et al. 1995; Corbin 1997) showed intriguing differences between RQ and RL quasars with large blueshifts observed only among RQ sources (§2). We discuss here our VLT-FORS Civ 1549 spectra of high luminosity quasars (their location in the absolute magnitude vs. redshift plane is shown in Fig. 1) where a reliable rest frame could be estimated from narrow LILs, typically the narrow component of H (§3). We report on the behaviour of the Civ 1549 emission line profile as a function of luminosity, using the interpretative tools provided by the 4D eigenvector 1 approach (4DE1, §4). We derive inferences about the nature of weak-lined quasars (§4.2) and demonstrate that nuclear outflows traced by Civ 1549 are expected to have a strong feedback effect on the host galaxy, especially for the most luminous Pop. A quasars (§5).
2 (4D)Eigenvector 1 quasar contextualization at low-
The (4D) Eigenvector 1 quasar contextualization scheme at low- offers a powerful tool for interpretation of the Civ 1549 emission line profile. Eigenvector 1 was originally defined from a Principal Component Analysis (PCA) of 87 PG quasars involving an anticorrelation between optical FeII intensity, half-maximum profile width of H and peak intensity of [Oiii]5007 (Boroson and Green, 1992). E1 expanded to 4DE1 with the addition of X-ray photon index and Civ 1549 profile shift measures (Sulentic et al., 2000, 2008, 2011). 4DE1 allows one to define a quasar main sequence in 4DE1 space (Sulentic et al., 2000; Marziani et al., 2001). The 4DE1 approach allows the definition of spectral types following source occupation in the optical plane FWHM(H) vs (Sulentic et al., 2002) and can be extended to include all four dimensions e.g. (Bachev et al., 2004). Along the sequence, it is possible to identify two populations: Population A with FWHM(H) km s-1, and a second Population B of sources with broader lines (see Sulentic et al., 2007, 2011, for the rationale behind two distinct quasar populations). Here we mention that, at low- (), Pop. A sources include narrow-line Seyfert 1s (NLSy1s) and strong Fe iiopt emitters. Pop. B sources show weaker Feii emission and LIL emission broad profiles that are often redward asymmetric (Marziani et al., 2003a). In low- samples Pop. B sources are systematically more massive ( M⊙) than Pop. A, and the wide majority of Fanaroff-Riley II powerful radio sources belongs to Pop. B (Zamfir et al., 2008). Pop. B sources could be therefore seen as more “evolved” AGN than Pop. A sources. Heuristic considerations and black hole and Eddington ratio estimates suggest that the principal driver of the quasar main sequence is Eddington ratio (e.g., Marziani et al., 2001, 2003b; Kuraszkiewicz et al., 2009). Population A and B are distinct in terms of Eddington ratio: the boundary value (for BH mass of 108 M⊙) is estimated to be (Marziani et al., 2003b). It is interesting to note that this is the limit at which the transition from a geometrically thin to a geometrically thick disk is expected (Abramowicz et al., 1988; Frank et al., 2002, and references therein).
2.1 Interpretation of the Civ 1549 emission line profile along the 4DE1 sequence
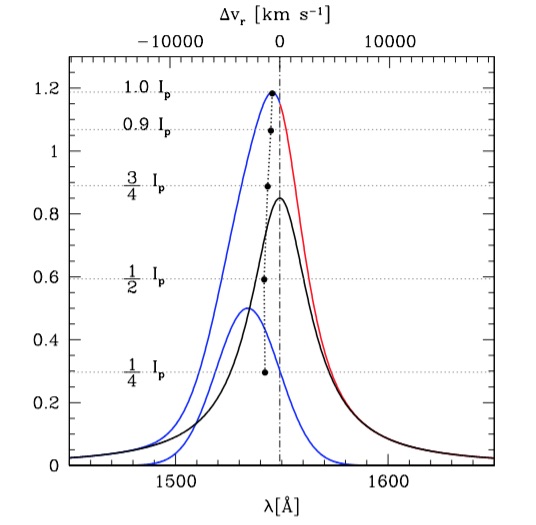
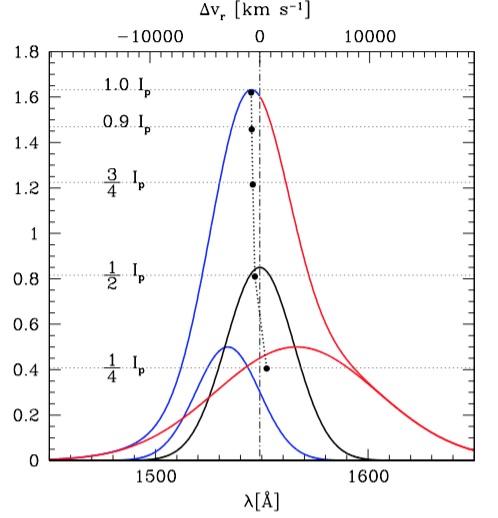
The strongest emission lines can be empirically reproduced by 3 components with varying relative strength along the 4DE1 sequence (Marziani et al., 2010): (a) a blueshifted component (BLUE), strong in Ly, Civ 1549, Heii 1640; (b) a “Broad Component” (BC), strong in all low ionization lines: Fe iiopt, Mgii 2800, Hi Balmer lines; (c) a “Very Broad Component” (VBC FWHM10000 km s-1; Peterson and Ferland 1986; Marziani and Sulentic 1993; Corbin 1997; Sulentic et al. 2000), redshifted; strong in Ly, Civ 1549, Heii4686, Balmer lines but absent or at most weak in Feii.
Blueshifts have been associated with radial motion + obscuration since their discovery (Gaskell, 1982). The blueshifted component is meant to isolate, in a heuristic way, the contribution of the radially-moving (most likely outflowing) gas. The approach is heuristic since, in a multicomponent decomposition, we are isolating radial velocity components that may have no obvious counterpart in physical space. At the same time, inter-percentile velocity intensity ratios for the blue part of the profile are very different from the ones estimated over the core or of lines showing an almost symmetric profile. Since the emission line profiles originate in a spatially unresolved region, to ignore emission line shifts and asymmetries, and take an intensity ratio over the full profile can easily bring to misleading results. We can use Mark 478 as a representative example of spectral type A2, the most populated A spectral type; the same consideration apply to BLUE of the other A spectral type (Marziani et al., 2010). If the Civ 1549/H ratio is computed over the full profile from the Mark 478 spectrum, it is , for the unshifted BC component is 1.4. Clear constraints on physical conditions emerge if the line components are considered individually. It is possible to measure fairly accurately the following intensity ratios for BLUE: Ly/H (), Civ 1549/ Ly (), Heii 1640/Civ 1549 (). Results of Cloudy 08.00 (Ferland et al., 1998, 2013) simulations as a function of density and ionization parameter indicate that BLUE is consistent with high ionization () and moderate density ( cm-2). The large Ly/H is very different from the ones of the other components ( Ly/H 5 – 10, Netzer et al. 1995). This latter value is difficult to explain for photoionization models. On the converse Ly/H is expected under more standard physical conditions.
The decomposition involving BLUE is consistent with some models proposed in the past, such as those by Collin-Souffrin et al. (1986) and Elvis (2000). In the framework of these models, the blueshifted component is associated with radially outflowing clouds surrounding an accretion disk, or with a (non-rotating) wind driven by radiation pressure. There is fairly convincing evidence that strongest outflows are associated with the highest Eddington ratio values (; e.g., Boroson 2002; Marziani et al. 2003b; Baskin and Laor 2005; Richards 2012; Marziani et al. 2013b) where we indeed expect the strongest effect of radiation pressure.
Further interpretation of the heuristic decomposition of the broad profiles involves “stratification” of the emitting region: the broad component is associated with a lower ionization Broad Line Region (BLR), where line broadening is predominantly virial, and where Feii, Caii are emitted (Loli Martínez-Aldama et al., 2015, and references therein). The very broad component is associated with a high-ionization inner region, the Very Broad Line Region (VBLR) that emits no Feii and shows lower continuum responsivity (Snedden and Gaskell, 2007; Goad and Korista, 2014). The stratification is consistent with virial motions dominating the core of the Pop. B LILs. The LIL profiles often show asymmetries but the amplitude of the shifts is usually much less than the FWHM (Sulentic, 1989; Marziani et al., 2003a; Zamfir et al., 2010). For reviews on the relation between emission line properties and accretion disk see Gaskell (2008) and Gaskell (2009).
2.2 Interpretation of the line profile: a narrow component for Civ 1549?
The long-slit spectra are far from resolving the broad line emitting region (size pc). The half-slit width of 0.3 arcsec covers 2.5 kpc from the nucleus. In addition to the BLR, a part of the (usually resolved) narrow line region (NLR) is included in the slit. The profiles of Civ 1549 and H are therefore the summation of contributions which may be separated (or overlapping) in radial velocity, but not necessarily spatially disjoint (or coincident). The interpretation of the line profile will follow a series of heuristic considerations which come from past analysis of large samples of high S/N spectra. As mentioned, we identified 4 main components: 1) the narrow component; 2) the broad component; 3) the very broad component; 4) a blueshifted component (Marziani et al., 2003b, 2010). The NC is partially resolved in nearby AGN. It is easily appreciable in the H profile of Pop. B sources. Its presence has been debated for Civ 1549, several convincing arguments notwithstanding (Sulentic and Marziani, 1999). Sulentic and Marziani (1999) ascribed the Civ 1549 NC to the innermost, densest part of the NLR. Empirical isolation of the Civ 1549NC is often ambiguous, as it merges smoothly with the underlying BC. While its contribution to the total Civ 1549 flux is small, it can significantly affect line width measures. However, the very high luminosity of the HE sample may imply that the NC is contributing little to both BC flux and width (Netzer et al., 2004).
2.3 Modelling and measuring the broad Civ 1549 profile
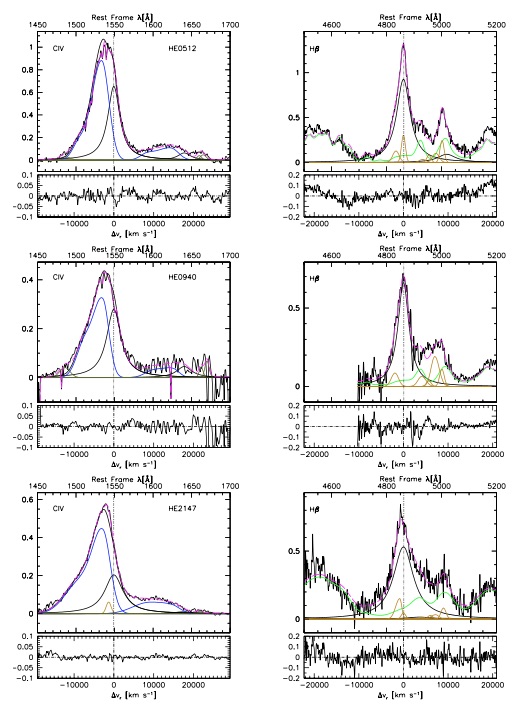
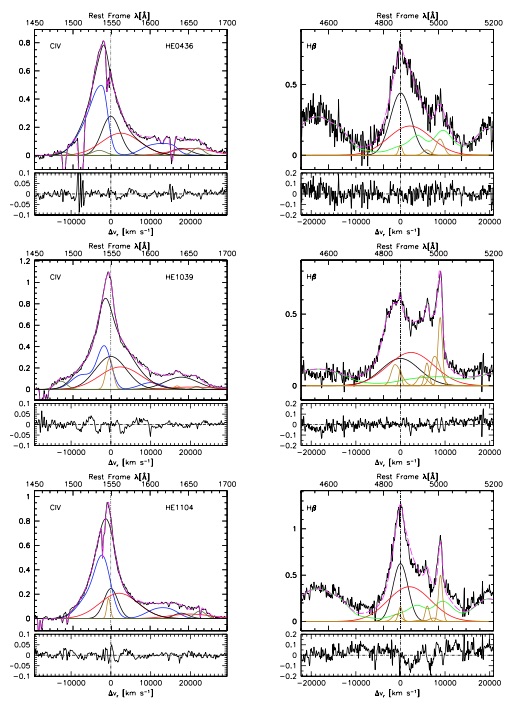
Fig. 2 illustrates the Civ 1549 line decomposition into a BC and a blueshifted component, for Pop. A, and into BC, VBC and blueshifted component for Pop. B (right panel). Radial velocities are measured for the peak intensity , and for the centroids (black spots) at different fractional intensities. The same decomposition can be applied also to H, although the blue shifted component is usually close to or below the noise level. Line centroids at fractional intensity are independent of multi-component decomposition, and will be considered for a quantitative statistical analysis in the following discussion.

3 Sample selection, observations and data analysis
Our sample was drawn from 52 quasars from the Hamburg-ESO survey (Wisotzki et al., 2000) observed with ISAAC in the H spectral range to obtain reliable rest frames, in the redshift range (most with ). The Civ 1549 line was observable from ground ( ) for 32 sources, and Civ 1549 was actually observed at TNG (equipped with DOLORES) and VLT (equipped with FORS2) for 28 quasars (hereafter the HE sample). The quasar HE sample includes 15 Pop. A and 17 Pop. B sources. A control sample (CS) for which H and Civ 1549 observations are available at low and low luminosity was extracted from 130 HST/FOS Civ 1549 observations (Sulentic et al., 2007). Fig. 1 illustrates the placement of the CS and of the HE sample in the absolute magnitude vs. redshift plane. In this paper we will use all of the 130 FOS observations, which means the addition of a minority of sources more luminous than . An additional sample of GTC observations of faint quasars at high- has been also used, to help distinguish redshift from effects.
Previous observations of H for the HE sample were discussed in a series of papers (Sulentic et al., 2004, 2006b; Marziani et al., 2009). Data analysis has been carried out with multicomponent maximum-likelihood fits in both the UV and optical rest-frame range. The IRAF task SPECFIT (Kriss, 1994) allows for the inclusion of most-frequently observed components in the spectra of extragalactic sources. Specific to the analysis of Civ 1549 and H in quasars, we considered a local power-law, Feii emission represented by a scaled and broadened template. Narrow lines were fit with Gaussians, while broad Civ 1549 and H were fit using Lorentzian and/or Gaussians, depending on Population as described below.
4 Results
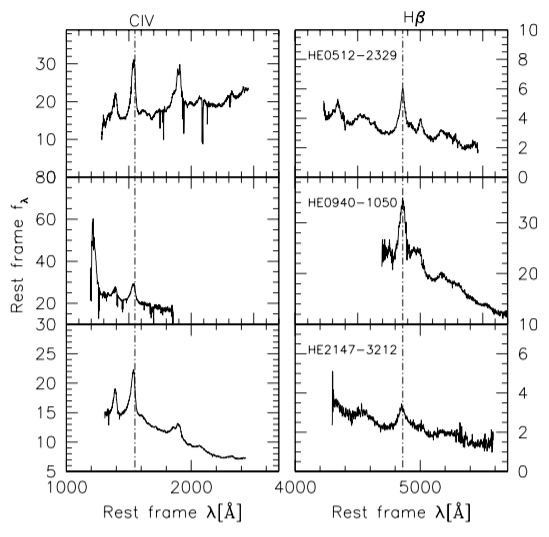
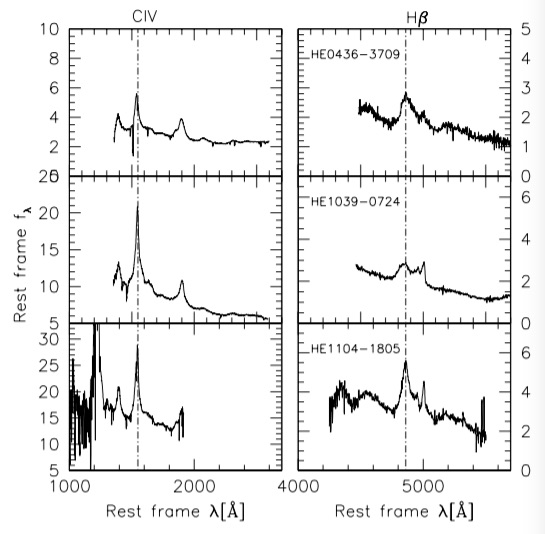
Fig. 3 provides examples of Pop. A and Pop. B sources in the HE sample, with the H and Civ 1549 spectral ranges shown side-by-side. The result of the SPECFIT analysis carried out for these objects is shown in Fig. 4. A most remarkable finding is that the Civ 1549 profiles show significant blueshifts with respect to the rest frame (dot-dashed line) for both Pop. A and B. The amplitude of the blueshifts are however larger for Pop. A than for Pop. B. A detailed analysis of the full dataset will be presented elsewere. Here we focus on results concerning the relation between blueshift and quasar luminosity.
4.1 Luminosity and radio-loudness effects on quasars blueshifts
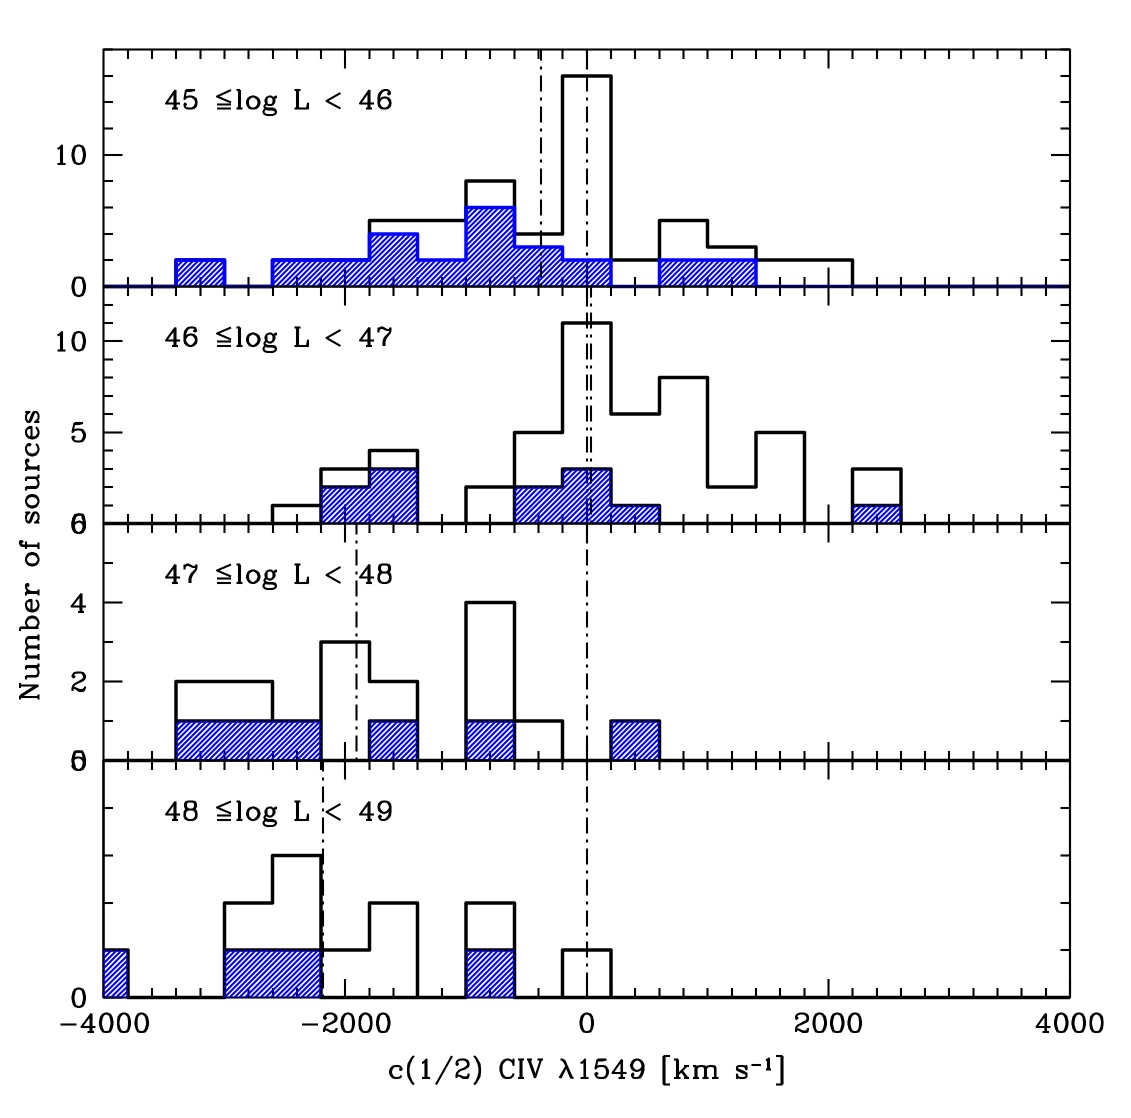
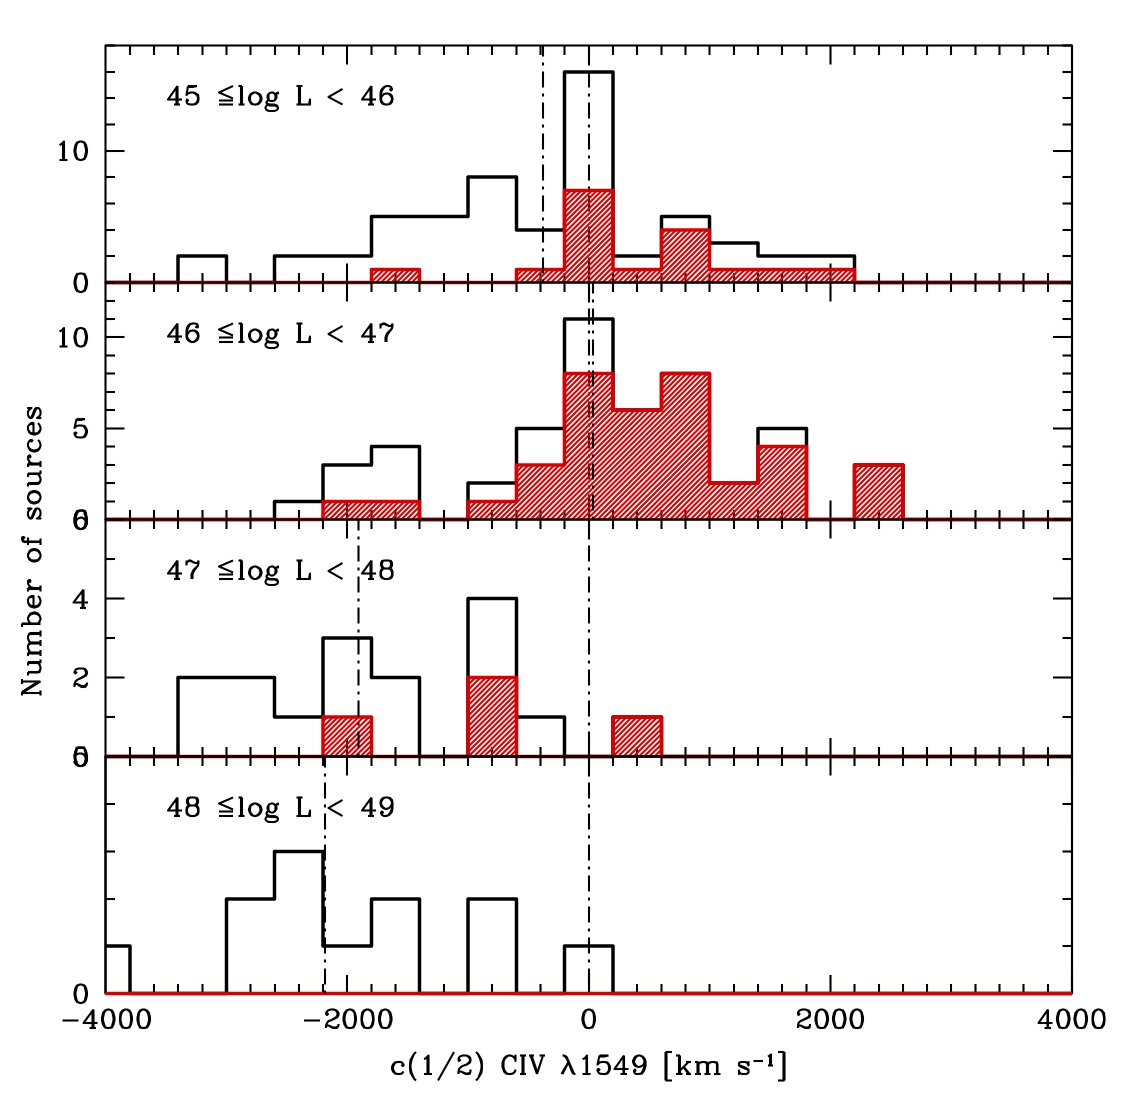
The significance of these results can be appreciated by comparing the distribution of Civ 1549 line shifts (centroid at half maximum, )) in four luminosity bins (Fig. 5). The two panels for 47 show the distribution for the HE sample, while the distributions at lower luminosity are drawn from the control sample. The left panel isolates Pop. A (shaded blue) while the right one RL sources (shaded red). Pop. A sources are associated with the largest shifts, while RL sources dominate the redshifted part of the distribution at low . It is not the case that RL sources do not show any blue shift; however the blueshift amplitudes rarely exceed 1000 km s-1, and the luminosity dependence is shallower than for RQ (Richards et al., 2011). We can consider that the effect of radio loudness on H is not remarkable, if the comparison is restricted to Pop. B sources, as appropriate since there are very few Pop. A RQ. The redward asymmetry seen in Pop. B RL is seen in Pop. B RQ as well (Marziani et al., 2003b; Zamfir et al., 2010). It does not seem that the redward asymmetry is a phenomenon exclusive to RL sources (Punsly, 2010; Punsly and Zhang, 2011), as it is most prominent right in the HE sample Pop. B sources that are mostly RQ. Therefore a proper contextualization may follow the scheme of Fig. 6: while for LILs it is sufficient to separate Pop. A and B to avoid mixup of sources in different dynamical conditions, for HIL analysis it is necessary to distinguish between Pop. B RQ and RL. The color coding in Fig. 6 reflects the average Civ 1549 centroid shifts at half maximum in the sample of Sulentic et al. (2007): , –250, +70 km s-1 for Pop. A RQ, Pop. B RQ, and Pop. B RL respectively. The weakness of the blueshifts in RL sources makes the redward asymmetry in Civ 1549 more easily detectable, so that the RL Civ 1549 profile either look more symmetric or even redshifted (Fig. 5), while the Civ 1549 profiles of RQ Pop. B sources are more affected by blue shifted emission, resulting in a smaller net blueshift on average.
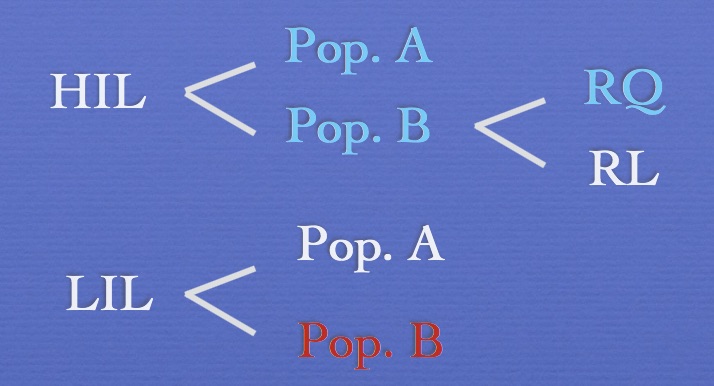
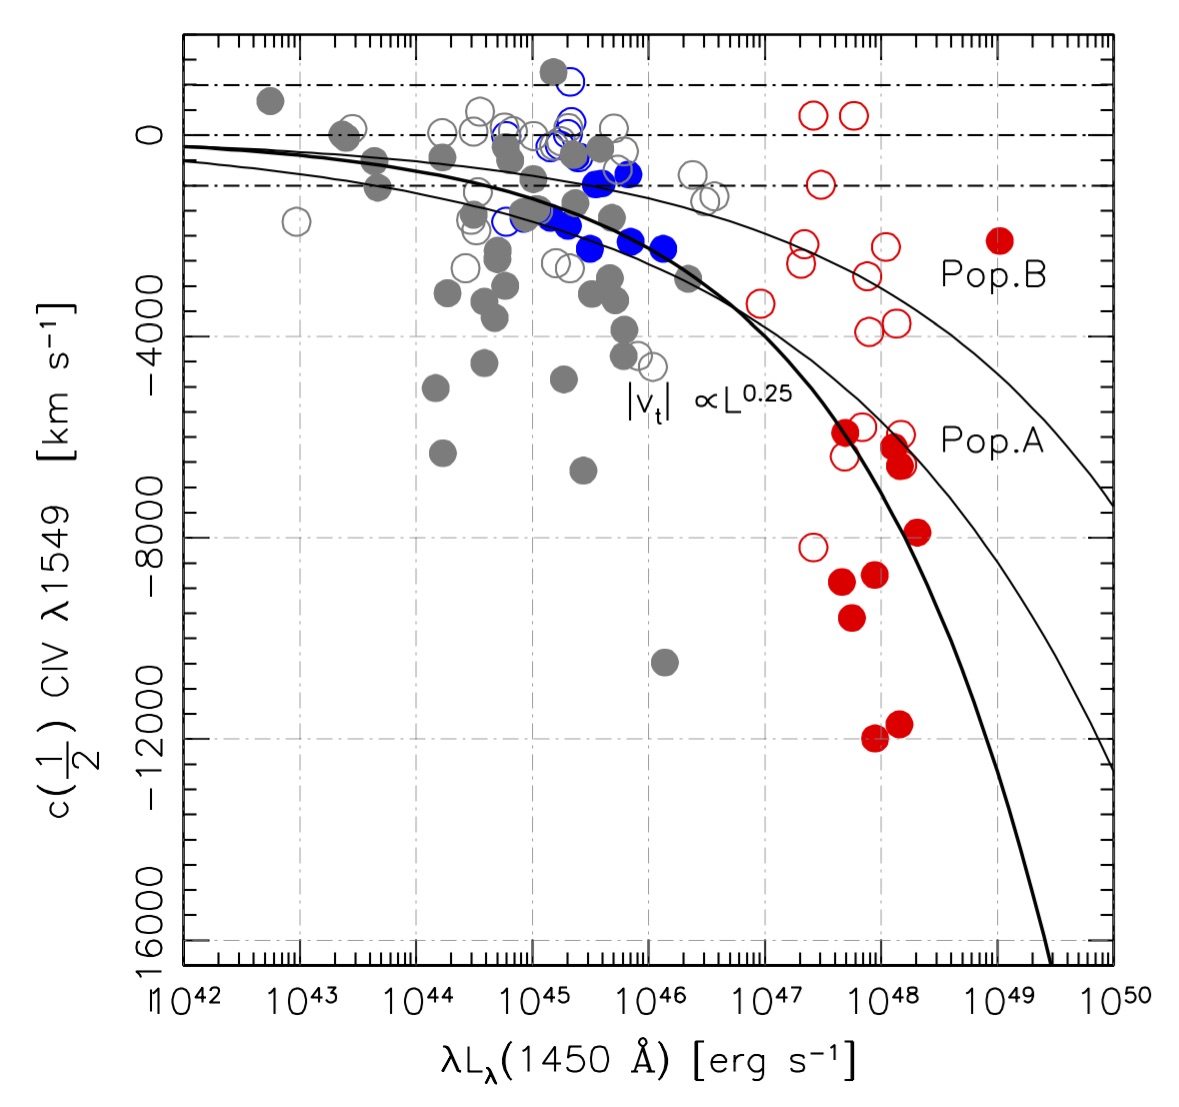
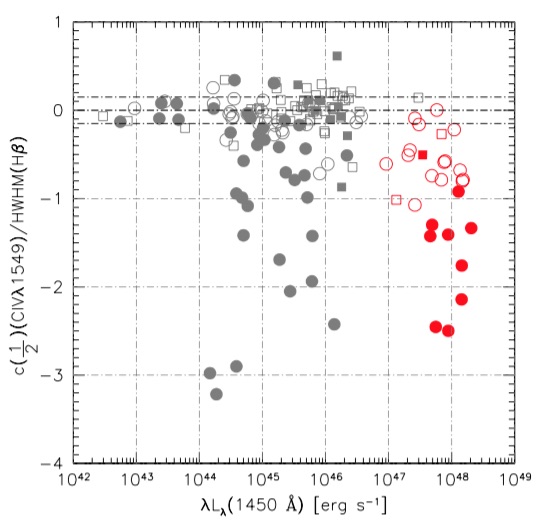
Fig. 5 indicates that blueshifts are more frequent at high luminosity, and that the shift amplitude tends to increase as a function of luminosity. This is also shown by Fig. 7: the blueshift amplitude at the line base depends strongly on continuum luminosity, although it is probably misleading to interpret the diagram in terms of a correlation: at each luminosity there is a large range in shifts. In Fig. 7 we considered twice the as a proxy (as a matter of fact, an underestimate) of the terminal velocity associated with a wind. In the case of a radiation driven wind, can be written as:
| (1) |
where we have assumed that the Keplerian velocity can be written as , and that the radius scales with the square root of the luminosity, as found from reverberation mapped sources (Bentz et al., 2006, 2009). If the force multiplier does not depend on , then . In other words, in the case of a radiation driven wind, under the simplest assumptions, we expect a pure luminosity dependence (Laor and Brandt, 2002, c.f. Marziani et al. 2013b). The line drawn in Fig. 7 for an arbitrary normalisation shows that a trend is consistent with the systematic increase in Pop. A blueshifts (a different normalisation would account for Pop. B sources as well).
The dynamical relevance of the Civ 1549 shift i.e., the shift amplitude normalized by the line half-width at half-maximum of H (Marziani et al., 2013a), is /HWHM(H) 1 in the most extreme quasars. As is possible to appreciate from Fig. 4, the Civ 1549 line is almost blueshifted with respect to the rest frame of the quasar. However, we do not see a strong dependence on line luminosity: the largest normalised shifts are observed in the control sample, at moderate (; right panel of Fig. 7).
4.2 Extreme outflows in extreme quasars: weak lined quasars
Weak Lined Quasars (WLQs) have been a surprising discovery, since they are radio quiet quasars with usually low equivalent width of Civ 1549 (Å) and Ly ( Å, Diamond-Stanic et al. 2009; Shemmer et al. 2010). The insight gained by the contextualization of low redshift quasars Civ 1549 profiles allows to frame them relatively easily. Pop. A sources, in the 4DE1 context, show lower (Civ 1549) (Bachev et al., 2004; Sulentic et al., 2007), and among them we also found the most extreme blueshifts. We can consider at first the behaviour of the Civ 1549 shifts versus equivalent width (Fig 8). Of the five sources (3 in the CS and 2 HE) all low equivalent width sources show large Civ 1549 blueshifts ( km s-1). The same results holds for the WLQs recently observed by Plotkin et al. (2015), with simultaneous H and Civ 1549 coverage. Looking at the optical plane of the 4DE1 space (Fig. 9), we see that all 10 WLQs (CS, HE, and Plotkin et al. 2015) are Pop. A sources, and most of them in the domain of extreme Population A with 1. Apart from the Civ 1549 line, other features in the UV spectra are consistent with extreme A quasars revealed at both high and low luminosity, radiating at high Eddington ratio (Dultzin et al., 2011; Negrete et al., 2012; Marziani and Sulentic, 2014). We conclude that WLQs should be considered extreme Pop. A sources, probably among the quasars accreting at the highest rate. This view is supported by the optical and soft-X analysis of Luo et al. (2015) who found X-ray properties consistent with X-ray shielding by a thick structure possibly the “slim” disk expected at high accretion rate (§2).


5 Discussion: what do the most powerful outflows mean for galaxy evolution?
The most powerful outflows are believed to produce significant feedback effects on the host galaxies (Reeves et al., 2009; Rupke and Veilleux, 2011; Fabian, 2012). The observational evidence of the active nucleus feedback is still debated, and rest upon the discovery of ultra-fast outflows (UFOs, Tombesi et al. 2010), whose X-ray features are still passible of alternative interpretation. Large Balnicity index BAL QSOs are a minority of quasars (Vestergaard, 2003; Sulentic et al., 2006a; Trump et al., 2006). On the converse, quasars outflows are observed in most radio quiet quasars (90% of all quasars). An order of magnitude estimate of the kinetic power associated with the Civ 1549 emitting outflows is possible under several assumptions that make the estimate uncertain but not unrealistic (Fabian, 2012; Cano-Díaz et al., 2012; King and Pounds, 2015). We start considering the fraction of the flux in the Civ 1549 blue component that is above the expected projected escape velocity at Rg. The assumed is relatively large in the BLR context and will yield a lower limit to the kinetic power.
The Civ 1549 line luminosity associated with the outflow above escape velocity is given by
(where is the filling factor, and is the line emissivity per unit volume) which can be written as:
for a collisionally excited line, where is the electron density and the number density of C3+ ions at the transition lower level. The collisional excitation rate (Osterbrock and Ferland, 2006) is given by
where is the statistical weight of the lower level, the effective collision strength, the electron temperature, the energy level difference, and a constant. The Civ 1549 line luminosity can be connected to the mass of outflowing ionized gas , by considering that the can be written as, under the assumption of constant density:
where the metallicity is appropriate for luminous high quasars (Hamann and Ferland, 1993; Nagao et al., 2010), and is the density in units of cm-3. The mass outflow rate at a distance (1 pc) can be written, if the flow is confined to a solid angle of , as:
The outflow kinetic power, with outflow in units of 5000 km s-1, is:
The total energy expelled over a duty cycle of 108 yr is
This value can be compared to the binding energy of the gas in a massive bulge/spheroid of mass :
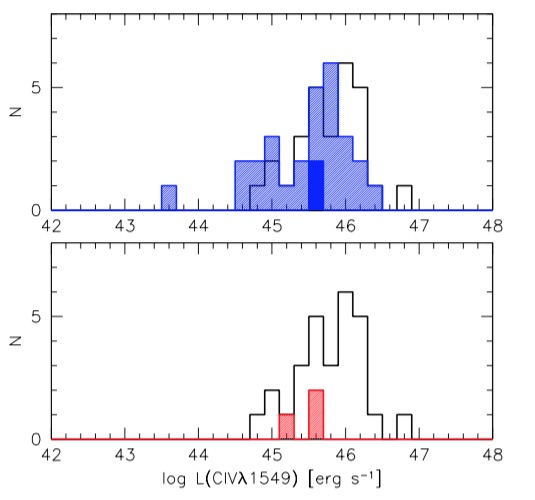
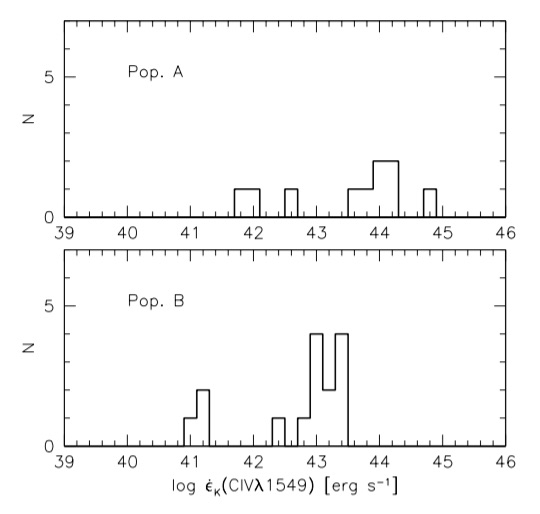
where is the effective radius in units of 2.5 kpc, and is the gas mass ratio in units of 0.1. Fig. 10 shows the distribution of the blue shifted component luminosity above the escape velocity at 1000 Rg (left panel). The distribution of the corresponding kinetic powers is shown in the right panel of Fig. 10, for Pop. A and B HE sources separately. The luminosity values are enormous, comparable to the bolometric luminosity of bright quasars in the local Universe, and the kinetic energy deposed over a quasar life cycle is comparable to the binding energy of a massive spheroid. We have assumed an escape radius of 1000 Rg, and density . Both parameters could likely have lower values, making our estimates lower limits to the and hence to the kinetic power. Consistent results come from an analogous analysis of the [Oiii] 4959,5007 blue shifted emission. It is possible that we are, at least in part, considering the same outflows. However, if the [Oiii] 4959,5007 outflows can also be due to extranuclear star formation, this is very unlikely for the Civ 1549 broad line, that can be safely associated with processes occurring in the active nucleus. We also note that the WLQs do contribute significant kinetic power the low line equivalent widths notwithstanding, also because their line blueshifts are among the largest ever observed.
6 Conclusion
4DE1 provides an interpretation framework at low as well as at extreme luminosity. The Civ 1549 analysis reveals blueshifted emission associated with quasars outflows in RQ quasars, with high amplitude shifts being apparently more frequent at high . Contextualization of HIL requires not only a distinction between Pop. A and B, but also that RL and RQ sources are kept separate, with RL sources showing blueshifts of systematically lower amplitude, no shifts or even redward asymmetric Civ 1549 profiles. “Unexpected” luminosity effects are not seen (§4.1): larger Civ 1549 shifts at high are expected for a simple radiation-driven wind. Otherwise, the outflow phenomenology is self-similar over a wide range of : Fig. 7 shows that large blueshifts ( km s-1) are possible over at least a 4.5 dex in luminosity, and that the Civ 1549 shift “dynamical relevance” is distributed over the same range at moderate and high . The most extreme cases of blueshifts include the WLQs that, in the 4DE1 context, are revealed to be predominantly extreme accretions (i.e., WLQs belong to the xA class of Marziani and Sulentic 2014). The Civ 1549 blueshift-dominated profile in the most luminous sources supports the idea that a nuclear outflow may be at the origin of galactic-scale feedback effects.
References
- Abramowicz et al. (1988) Abramowicz, M.A., Czerny, B., Lasota, J.P., Szuszkiewicz, E.: Astrophys. J. 332, 646 (1988). doi:10.1086/166683
- Bachev et al. (2004) Bachev, R., Marziani, P., Sulentic, J.W., Zamanov, R., Calvani, M., Dultzin-Hacyan, D.: ApJ 617, 171 (2004). arXiv:astro-ph/0408334. doi:10.1086/425210
- Baskin and Laor (2005) Baskin, A., Laor, A.: MNRAS 356, 1029 (2005). arXiv:astro-ph/0409196. doi:10.1111/j.1365-2966.2004.08525.x
- Bentz et al. (2006) Bentz, M.C., Peterson, B.M., Pogge, R.W., Vestergaard, M., Onken, C.A.: ApJ 644, 133 (2006). arXiv:astro-ph/0602412. doi:10.1086/503537
- Bentz et al. (2009) Bentz, M.C., Peterson, B.M., Pogge, R.W., Vestergaard, M.: ApJL 694, 166 (2009). 0812.2284. doi:10.1088/0004-637X/694/2/L166
- Boroson (2002) Boroson, T.A.: Astrophys. J. 565, 78 (2002). arXiv:astro-ph/0109317. doi:10.1086/324486
- Boroson and Green (1992) Boroson, T.A., Green, R.F.: ApJS 80, 109 (1992). doi:10.1086/191661
- Cano-Díaz et al. (2012) Cano-Díaz, M., Maiolino, R., Marconi, A., Netzer, H., Shemmer, O., Cresci, G.: Astron. Astrophys. 537, 8 (2012). 1112.3071. doi:10.1051/0004-6361/201118358
- Collin-Souffrin et al. (1986) Collin-Souffrin, S., Joly, M., Pequignot, D., Dumont, S.: Astron. Astrophys. 166, 27 (1986)
- Corbin (1997) Corbin, M.R.: ApJS 113, 245 (1997). doi:10.1086/313058
- Diamond-Stanic et al. (2009) Diamond-Stanic, A.M., Fan, X., Brandt, W.N., Shemmer, O., Strauss, M.A., Anderson, S.F., Carilli, C.L., Gibson, R.R., Jiang, L., Kim, J.S., Richards, G.T., Schmidt, G.D., Schneider, D.P., Shen, Y., Smith, P.S., Vestergaard, M., Young, J.E.: Astrophys. J. 699, 782 (2009). 0904.2181. doi:10.1088/0004-637X/699/1/782
- Dultzin et al. (2011) Dultzin, D., Martinez, M.L., Marziani, P., Sulentic, J.W., Negrete, A.: In: et al. (Eds.), L.F. (ed.) Proceedings of the conference ”Narrow-Line Seyfert 1 Galaxies and their place in the Universe”. April 4-6, 2011. Milano, Italy. Proceedings of Science, (2011)
- Elvis (2000) Elvis, M.: Astrophys. J. 545, 63 (2000). arXiv:astro-ph/0008064. doi:10.1086/317778
- Eracleous and Halpern (2003) Eracleous, M., Halpern, J.P.: ApJ 599, 886 (2003). arXiv:astro-ph/0309149. doi:10.1086/379540
- Fabian (2012) Fabian, A.C.: Annu. Rev. Astron. Astrophys. 50, 455 (2012). 1204.4114. doi:10.1146/annurev-astro-081811-125521
- Ferland et al. (1998) Ferland, G.J., Korista, K.T., Verner, D.A., Ferguson, J.W., Kingdon, J.B., Verner, E.M.: PASP 110, 761 (1998). doi:10.1086/316190
- Ferland et al. (2013) Ferland, G.J., Porter, R.L., van Hoof, P.A.M., Williams, R.J.R., Abel, N.P., Lykins, M.L., Shaw, G., Henney, W.J., Stancil, P.C.: RevMexA&Ap 49, 137 (2013). 1302.4485
- Frank et al. (2002) Frank, J., King, A., Raine, D.J.: Accretion Power in Astrophysics: Third Edition, Iii edition edn. Cambridge University Press, Cambridge (2002)
- Gaskell (1982) Gaskell, C.M.: ApJ 263, 79 (1982). doi:10.1086/160481
- Gaskell (2008) Gaskell, C.M.: In: Revista Mexicana de Astronomia y Astrofisica Conference Series. Revista Mexicana de Astronomia y Astrofisica, vol. 27, vol. 32, p. 1 (2008). 0711.2113
- Gaskell (2009) Gaskell, C.M.: New Astron. Rev. 53, 140 (2009). 0908.0386. doi:10.1016/j.newar.2009.09.006
- Gaskell and Goosmann (2013) Gaskell, C.M., Goosmann, R.W.: Astrophys. J. 769, 30 (2013). 0805.4258. doi:10.1088/0004-637X/769/1/30
- Goad and Korista (2014) Goad, M.R., Korista, K.T.: Mon. Not. R. Astron. Soc. 444, 43 (2014). 1407.5004. doi:10.1093/mnras/stu1456
- Hamann and Ferland (1993) Hamann, F., Ferland, G.: Astrophys. J. 418, 11 (1993). doi:10.1086/173366
- Hewett and Wild (2010) Hewett, P.C., Wild, V.: Mon. Not. R. Astron. Soc. 405, 2302 (2010). 1003.3017. doi:10.1111/j.1365-2966.2010.16648.x
- Hu et al. (2008) Hu, C., Wang, J.-M., Ho, L.C., Chen, Y.-M., Bian, W.-H., Xue, S.-J.: ApJL 683, 115 (2008). 0807.2060. doi:10.1086/591848
- King and Pounds (2015) King, A., Pounds, K.: ArXiv e-prints (2015). 1503.05206
- Kriss (1994) Kriss, G.: Astronomical Data Analysis Software and Systems III, A.S.P. Conference Series 61, 437 (1994)
- Kuraszkiewicz et al. (2009) Kuraszkiewicz, J., Wilkes, B.J., Schmidt, G., Smith, P.S., Cutri, R., Czerny, B.: Astrophys. J. 692, 1180 (2009). doi:10.1088/0004-637X/692/2/1180
- Laor and Brandt (2002) Laor, A., Brandt, W.N.: Astrophys. J. 569, 641 (2002). doi:10.1086/339476
- Loli Martínez-Aldama et al. (2015) Loli Martínez-Aldama, M., Dultzin, D., Marziani, P., Sulentic, J.W., Bressan, A., Chen, Y., Stirpe, G.M.: Astrophys. J. Suppl. Ser. 217, 3 (2015). 1501.04718. doi:10.1088/0067-0049/217/1/3
- Luo et al. (2015) Luo, B., Brandt, W.N., Hall, P.B., Wu, J., Anderson, S.F., Garmire, G.P., Gibson, R.R., Plotkin, R.M., Richards, G.T., Schneider, D.P., Shemmer, O., Shen, Y.: Astrophys. J. 805, 122 (2015). 1503.02085. doi:10.1088/0004-637X/805/2/122
- Marziani and Sulentic (1993) Marziani, P., Sulentic, J.W.: ApJ 409, 612 (1993). arXiv:astro-ph/9210005. doi:10.1086/172692
- Marziani and Sulentic (2014) Marziani, P., Sulentic, J.W.: Mon. Not. R. Astron. Soc. 442, 1211 (2014). 1405.2727. doi:10.1093/mnras/stu951
- Marziani et al. (1996) Marziani, P., Sulentic, J.W., Dultzin-Hacyan, D., Calvani, M., Moles, M.: ApJS 104, 37 (1996). doi:10.1086/192291
- Marziani et al. (2001) Marziani, P., Sulentic, J.W., Zwitter, T., Dultzin-Hacyan, D., Calvani, M.: ApJ 558, 553 (2001). arXiv:astro-ph/0105343. doi:10.1086/322286
- Marziani et al. (2003a) Marziani, P., Sulentic, J.W., Zamanov, R., Calvani, M., Dultzin-Hacyan, D., Bachev, R., Zwitter, T.: ApJS 145, 199 (2003a). doi:10.1086/346025
- Marziani et al. (2003b) Marziani, P., Zamanov, R.K., Sulentic, J.W., Calvani, M.: MNRAS 345, 1133 (2003b). arXiv:astro-ph/0307367. doi:10.1046/j.1365-2966.2003.07033.x
- Marziani et al. (2009) Marziani, P., Sulentic, J.W., Stirpe, G.M., Zamfir, S., Calvani, M.: A&Ap 495, 83 (2009). 0812.0251. doi:10.1051/0004-6361:200810764
- Marziani et al. (2010) Marziani, P., Sulentic, J.W., Negrete, C.A., Dultzin, D., Zamfir, S., Bachev, R.: Mon. Not. R. Astron. Soc. 409, 1033 (2010). 1007.3187. doi:10.1111/j.1365-2966.2010.17357.x
- Marziani et al. (2013a) Marziani, P., Sulentic, J.W., Plauchu-Frayn, I., del Olmo, A.: AAp 555, 89 (2013a). 1305.1096
- Marziani et al. (2013b) Marziani, P., Sulentic, J.W., Plauchu-Frayn, I., del Olmo, A.: ApJ 764(150) (2013b). 1301.0520
- Marziani et al. (2015) Marziani, P., Sulentic, J.W., Negrete, C.A., Dultzin, D., Del Olmo, A., Martínez Carballo, M.A., Zwitter, T., Bachev, R.: Astrophys. Space Sci. 356, 339 (2015). 1410.3146. doi:10.1007/s10509-014-2136-z
- Nagao et al. (2010) Nagao, T., Maiolino, R., Marconi, A., Matsuoka, K., Taniguchi, Y.: In: Peterson, B.M., Somerville, R.S., Storchi-Bergmann, T. (eds.) IAU Symposium. IAU Symposium, vol. 267, p. 73 (2010). doi:10.1017/S1743921310005594
- Negrete et al. (2012) Negrete, A., Dultzin, D., Marziani, P., Sulentic, J.: ApJ 757, 62 (2012). 1107.3188
- Netzer et al. (1995) Netzer, H., Brotherton, M.S., Wills, B.J., Han, M., Wills, D., Baldwin, J.A., Ferland, G.J., Browne, I.W.A.: ApJ 448, 27 (1995). doi:10.1086/175939
- Netzer et al. (2004) Netzer, H., Shemmer, O., Maiolino, R., Oliva, E., Croom, S., Corbett, E., di Fabrizio, L.: Astrophys. J. 614, 558 (2004). arXiv:astro-ph/0406560. doi:10.1086/423608
- Osterbrock and Ferland (2006) Osterbrock, D.E., Ferland, G.J.: Astrophysics of Gaseous Nebulae and Active Galactic Nuclei. University Science Books, Mill Valley, CA (2006)
- Peterson and Ferland (1986) Peterson, B.M., Ferland, G.J.: Nature 324, 345 (1986). doi:10.1038/324345a0
- Plotkin et al. (2015) Plotkin, R.M., Shemmer, O., Trakhtenbrot, B., Anderson, S.F., Brandt, W.N., Fan, X., Gallo, E., Lira, P., Luo, B., Richards, G.T., Schneider, D.P., Strauss, M.A., Wu, J.: Astrophys. J. 805, 123 (2015). 1503.07523. doi:10.1088/0004-637X/805/2/123
- Punsly (2010) Punsly, B.: Astrophys. J. 713, 232 (2010). 1002.4681. doi:10.1088/0004-637X/713/1/232
- Punsly and Zhang (2011) Punsly, B., Zhang, S.: Astrophys. J. Lett. 735, 3 (2011). 1105.1543. doi:10.1088/2041-8205/735/1/L3
- Reeves et al. (2009) Reeves, J.N., O’Brien, P.T., Braito, V., Behar, E., Miller, L., Turner, T.J., Fabian, A.C., Kaspi, S., Mushotzky, R., Ward, M.: Astrophys. J. 701, 493 (2009). 0906.0312. doi:10.1088/0004-637X/701/1/493
- Richards (2012) Richards, G.T.: In: Chartas, G., Hamann, F., Leighly, K.M. (eds.) AGN Winds in Charleston. Astronomical Society of the Pacific Conference Series, vol. 460, p. 67 (2012). 1201.2595
- Richards et al. (2011) Richards, G.T., Kruczek, N.E., Gallagher, S.C., Hall, P.B., Hewett, P.C., Leighly, K.M., Deo, R.P., Kratzer, R.M., Shen, Y.: Astron. J. 141, 167 (2011). 1011.2282. doi:10.1088/0004-6256/141/5/167
- Rupke and Veilleux (2011) Rupke, D.S.N., Veilleux, S.: Astrophys. J. Lett. 729, 27 (2011). 1102.4349. doi:10.1088/2041-8205/729/2/L27
- Shemmer et al. (2010) Shemmer, O., Trakhtenbrot, B., Anderson, S.F., Brandt, W.N., Diamond-Stanic, A.M., Fan, X., Lira, P., Netzer, H., Plotkin, R.M., Richards, G.T., Schneider, D.P., Strauss, M.A.: Astrophys. J. Lett. 722, 152 (2010). 1009.2091. doi:10.1088/2041-8205/722/2/L152
- Snedden and Gaskell (2007) Snedden, S.A., Gaskell, C.M.: ApJ 669, 126 (2007). doi:10.1086/521290
- Sulentic et al. (2011) Sulentic, J., Marziani, P., Zamfir, S.: Baltic Astronomy 20, 427 (2011)
- Sulentic (1989) Sulentic, J.W.: Astrophys. J. 343, 54 (1989). doi:10.1086/167684
- Sulentic and Marziani (1999) Sulentic, J.W., Marziani, P.: ApJL 518, 9 (1999). arXiv: astro-ph/9904203. doi:10.1086/312060
- Sulentic et al. (2000) Sulentic, J.W., Marziani, P., Dultzin-Hacyan, D.: ARA&A 38, 521 (2000). doi:10.1146/annurev.astro.38.1.521
- Sulentic et al. (1995) Sulentic, J.W., Marziani, P., Dultzin-Hacyan, D., Calvani, M., Moles, M.: ApJL 445, 85 (1995). doi:10.1086/187896
- Sulentic et al. (2000) Sulentic, J.W., Marziani, P., Zwitter, T., Dultzin-Hacyan, D., Calvani, M.: ApJL 545, 15 (2000). arXiv:astro-ph/0009326. doi:10.1086/317330
- Sulentic et al. (2002) Sulentic, J.W., Marziani, P., Zamanov, R., Bachev, R., Calvani, M., Dultzin-Hacyan, D.: ApJL 566, 71 (2002). arXiv:astro-ph/0201362. doi:10.1086/339594
- Sulentic et al. (2004) Sulentic, J.W., Stirpe, G.M., Marziani, P., Zamanov, R., Calvani, M., Braito, V.: A&Ap 423, 121 (2004). arXiv:astro-ph/0405279. doi:10.1051/0004-6361:20035912
- Sulentic et al. (2006a) Sulentic, J.W., Dultzin-Hacyan, D., Marziani, P., Bongardo, C., Braito, V., Calvani, M., Zamanov, R.: Revista Mexicana de Astronomia y Astrofisica 42, 23 (2006a). arXiv:astro-ph/0511230
- Sulentic et al. (2006b) Sulentic, J.W., Repetto, P., Stirpe, G.M., Marziani, P., Dultzin-Hacyan, D., Calvani, M.: A&Ap 456, 929 (2006b). arXiv:astro-ph/0606309. doi:10.1051/0004-6361:20054153
- Sulentic et al. (2007) Sulentic, J.W., Bachev, R., Marziani, P., Negrete, C.A., Dultzin, D.: ApJ 666, 757 (2007). 0705.1895. doi:10.1086/519916
- Sulentic et al. (2008) Sulentic, J.W., Zamfir, S., Marziani, P., Dultzin, D.: In: Revista Mexicana de Astronomia y Astrofisica Conference Series. Revista Mexicana de Astronomia y Astrofisica Conference Series, vol. 32, p. 51 (2008)
- Sulentic et al. (2014) Sulentic, J.W., Marziani, P., del Olmo, A., Dultzin, D., Perea, J., Alenka Negrete, C.: Astron. Astrophys. 570, 96 (2014). 1406.5920. doi:10.1051/0004-6361/201423975
- Tombesi et al. (2010) Tombesi, F., Sambruna, R.M., Reeves, J.N., Braito, V., Ballo, L., Gofford, J., Cappi, M., Mushotzky, R.F.: Astrophys. J. 719, 700 (2010). 1006.3536. doi:10.1088/0004-637X/719/1/700
- Trump et al. (2006) Trump, J.R., Hall, P.B., Reichard, T.A., Richards, G.T., Schneider, D.P., Vanden Berk, D.E., Knapp, G.R., Anderson, S.F., Fan, X., Brinkman, J., Kleinman, S.J., Nitta, A.: Astrophys. J. Suppl. Ser. 165, 1 (2006). astro-ph/0603070. doi:10.1086/503834
- Tytler and Fan (1992) Tytler, D., Fan, X.-M.: ApJS 79, 1 (1992). doi:10.1086/191642
- Véron-Cetty and Véron (2010) Véron-Cetty, M.-P., Véron, P.: Astron. Astrophys. 518, 10 (2010). doi:10.1051/0004-6361/201014188
- Vestergaard (2003) Vestergaard, M.: Astrophys. J. 599, 116 (2003). arXiv:astro-ph/0309550. doi:10.1086/379159
- Wisotzki et al. (2000) Wisotzki, L., Christlieb, N., Bade, N., Beckmann, V., Köhler, T., Vanelle, C., Reimers, D.: Astron. Astrophys. 358, 77 (2000). astro-ph/0004162
- Zamanov et al. (2002) Zamanov, R., Marziani, P., Sulentic, J.W., Calvani, M., Dultzin-Hacyan, D., Bachev, R.: ApJL 576, 9 (2002). arXiv:astro-ph/0207387. doi:10.1086/342783
- Zamfir et al. (2008) Zamfir, S., Sulentic, J.W., Marziani, P.: MNRAS 387, 856 (2008). 0804.0788. doi:10.1111/j.1365-2966.2008.13290.x
- Zamfir et al. (2010) Zamfir, S., Sulentic, J.W., Marziani, P., Dultzin, D.: Mon. Not. R. Astron. Soc. 403, 1759 (2010). 0912.4306. doi:10.1111/j.1365-2966.2009.16236.x