CHANTI: a Fast and Efficient Charged Particle Veto Detector for the NA62 Experiment at CERN
Abstract
The design, construction and test of a charged particle detector made of scintillation counters read by Silicon Photomultipliers (SiPM) is described. The detector, which operates in vacuum and is used as a veto counter in the NA62 experiment at CERN, has a single channel time resolution of ns, a spatial resolution of mm and an efficiency very close to for penetrating charged particles.
keywords:
Scintillation counters detector; Silicon Photon Multipliers; Ultrarare Kaon decays1 Introduction
The study of flavour changing neutral current (FCNC) meson decays, forbidden at tree level by the Standard Model (SM), allows one to test the SM and to search for signals of new physics in a way complementary to the study of the processes at very high energies, where the possible contribution of new particles is expected to manifest itself already at "leading order". In this context, the NA62 experiment at CERN [1] has the main purpose to measure with 10% precision the branching fraction of the rare decay K. The SM provides the fairly accurate prediction BRK [2]. At present the experimental value is BRK[3]; it is based on the observation of seven events made by the experiments E797 and E949 at BNL [4]. NA62 plans to collect a sample of about SM events in two years of data taking, studying the decay in flight of the K+ contained in an intense secondary beam of positive particles of 75 GeV/c momentum, produced using the proton beam of the CERN SPS. Since the two neutrinos cannot be observed, the topology of the events is characterized by an incoming K+ meson and a positive track coming out from the decay vertex. Therefore, the measurement strategy is based on the recognition of the incident kaon, the measurement of its momentum and of the momentum of the outgoing pion and on the rejection of times more abundant events due to other kaon decay channels. The background will be rejected making use of kinematic constraints, veto counters and detectors that allow particle identification, in particular the discrimination. The individual detectors that make up the overall apparatus used by NA62 are schematically represented in figure 1.
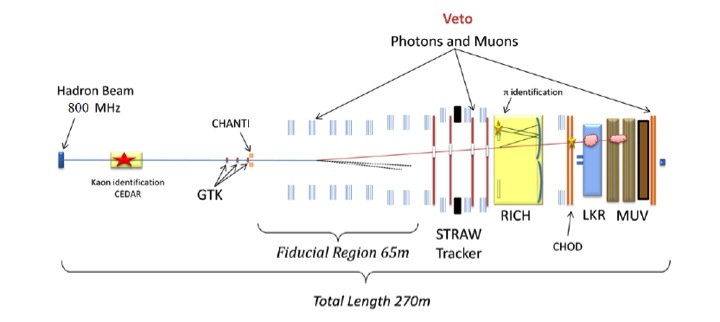
A particularly insidious source of background is given by events produced by the inelastic interactions of the beam with the three measurement stations - in particular the third - of the beam spectrometer (GTK) [5]. The spectrometer, which consists of thin silicon pixels detectors, is installed in vacuum immediately upstream of the decay vacuum tube in which is located the fiducial region. A positive pion, produced by the beam impacting GTK and detected by the apparatus of NA62 so that its origin is erroneously reconstructed in the fiducial region, mimics a signal event. To reduce this type of backgroud to an acceptable level, a detector to veto charged particles was designed and built (CHarged ANTI-Counter, CHANTI). It is made of scintillation counters and is placed in vacuum immediately after GTK3 without interfering with the beam. CHANTI exploits the fact that the events to be rejected are normally inelastic events at high multiplicity of tracks. To ensure a high efficiency of rejection it has just to be able to intercept charged tracks produced at angles, with respect to the beam direction, ranging from mrad up to rad; the region up to mrad is covered by the photons veto system. The following describes the design and construction of CHANTI and the results of tests carried out using both cosmic rays and a beam of positive particles.
2 Design and construction of CHANTI
First of all CHANTI must be able to detect the inelastic interactions of the beam with very high efficiency. Considering that it will be impacted not only by secondary products of such interactions but also by the beam halo, CHANTI has to be able to substain a high hit rate of charged particles, with a maximum rate per unit surface of the order of tens of kHz/ cm2 in the hottest region, and must have a radiation hardness up to a few Gy/ year. A time resolution of ns is also required in order to have a "random veto" not exceeding few percent. Finally, since it will be positioned in vacuum, the detector must have a small out-gassing rate and must consume a relatively low power. In principle a specific tracking ability is not required, however it is welcome in order to distinguish interactions due to the halo from those due to the beam, both to monitor the halo itself in the vicinity of the beam and to improve the time resolution without necessarily increasing the granularity.
2.1 Basic elements
With these requirements in mind, we have chosen to build the CHANTI using plastic scintillator bars made of extruded polystyrene (Dow Styron 663 W) doped with 1% PPO and 0.03% POPOP (by weight). It is an inexpensive scintillator with emission in the blue, with a good yield of light, a rather fast response ( few ns) and a good radiation resistance (5% degradation after a dose of Gy gamma irradiation). The bars, produced by FNAL-NICADD [6], have a cross section in the shape of an isosceles triangle with base 33 mm and height 17 mm (figure 2 on the left) and carry a co-extruded TiO2 coating mm thick.
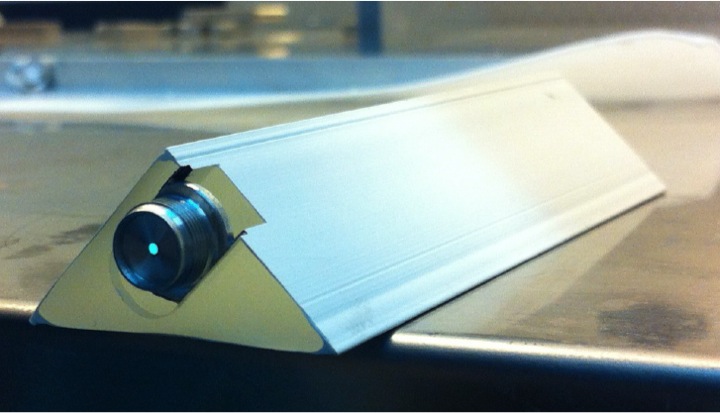
The bars, arranged next to each other in the way indicated in figure 2, centre, allow to realize a plane counter 17 mm thick, essentially with no fractures for tracks that pass through it.
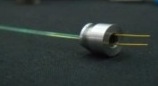
Each bar has longitudinally a central hole with a diameter of mm in which an optical WLS fiber is housed. The fiber is the fast multiclad blue to green shifter Saint-Gobain BCF-92 of 1 mm diameter. It has an emission spectrum peak at nm, a decay time of ns and an attenuation length of m. The free space between the fiber and the scintillator is filled with an optical glue (SCIONIX® Silicon Rubber Compound RTV615). It provides excellent optical contact and has a very low outgassing rate [7]. The fiber is coupled at one end to a SiPM by means of a connector (figure 2 on the right) bonded to the scintillator with a high viscosity epoxy glue (Epoxy 3M DP490). The other end is made reflective by a sputtered Al film. The connector is designed and constructed so as to ensure an optimal and stable coupling between the fiber and the SiPM. It is made of two parts: a base, in which the SiPM is housed, glued both to the scintillator and to the fiber, and a screw cap by which the SiPM is blocked so as to keep the optical coupling with the fiber itself. Both parts are made of aluminum and machined to a high precision. The SiPM is a ceramic package Hamamatsu S10362-13-050C, which has a sensitive area of 1.3 1.3 mm2. It is a photodetector of the type MPPC (Multi-Pixel Photon Counter) consisting of a matrix of Avalanche Photo-Diode (APD) that operate in Geiger regime. The single cell has dimensions m2; the total number of cells is 667. The specifications provided by the manufacturer and referred to a temperature of operation of 25∘C are:
-
•
operation voltage typically V;
-
•
photon detection efficiency (PDE), as quoted by manufacturer, slightly less than % for photons of nm - peak of the spectral response - and higher than % between 370 and 520 nm;
-
•
gain 105;
-
•
dark counting rate of the order of kHz at a threshold of 0.5 photoelectron222For simplicity we use here and in the following the term photoelectron to indicate the primary electron (hole) generated by a photon hitting the SiPM. (pe).
The SiPM was choosen after testing samples of three different photodetectors from the Hamamatsu S10362 series, namely: 11-050C, 11-100C and 13-050C. The first two differ from 13-050C as they have a sensitive area of mm2 with a cell m2 the first and m2 the second. We measured the responses of various devices coupled to the same bar of scintillator exposed to a collimated source of 90Sr. The measurements were carried out in a thermostatic chamber maintaining a fixed temperature of 25∘C with an uncertainty better than 0.1∘C .
The SiPM signals, amplified x10, were fed into an oscilloscope Tektronix TDS5054 read out by using a GPIB connection and a LabView program. The 500 MHz bandwidth of the oscilloscope is more than sufficient to analyze signals with rise times of the order of a few ns. In order to select the SiPM we used as a figure of merit the signal amplitude normalized to the signal of single photoelectron, that was determined in advance by collecting dark noise signals [5]. The samples of the series 13-050C gave a number of photoelectrons between 20 and 25, systematically greater than that given by the SiPM from the other two series. SiPM, like all semiconductors, may be damaged when exposed to an intense neutron flux, however they remain substantially unaltered after irradiations not greater than about 23 10cm2 ( 1MeV neutron equivalent) [8]. We checked by two different simulations, one made by FLUKA [9] and the other using GEANT4 [10], that this limit will not be exceeded in the two years of data taking foreseen for NA62. Indeed, the dose of neutrons integrated by the CHANTI SiPM is expected to be less than cm [5].
2.2 Layout and assembly
CHANTI is made of six square counter hodoscopes (stations) of 30 cm side arranged in vacuum along the beam direction at distances of 27, 85, 200, 430, 890 and 1810 mm from GTK3 (figure 3 ).
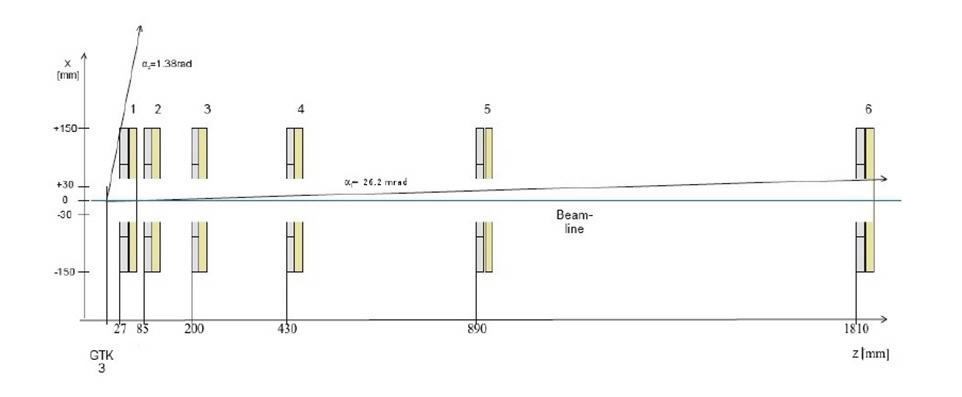
In order not to hinder the beam, the stations have a central hole of 65 95 mm2 rectangular shape, with the longer dimension in the horizontal direction (x-axis) and the shorter in the vertical direction (y-axis). The geometry of the system is such that the CHANTI can intercept secondary particles, generated by beam interactions at the center of GTK3, which propagate in an angular region from 26.2 mrad to 1.38 rad with respect to the beam axis and has full acceptance for those running between mrad and rad.
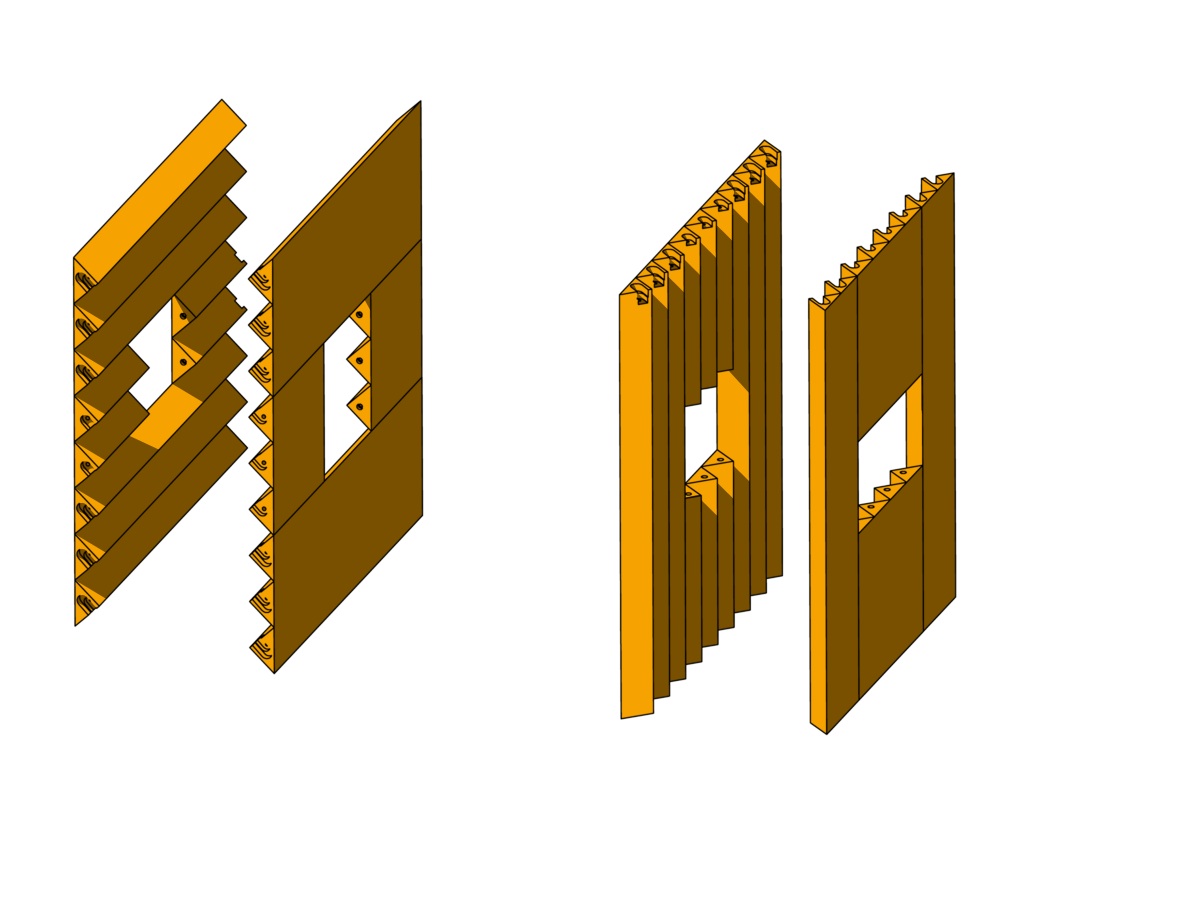
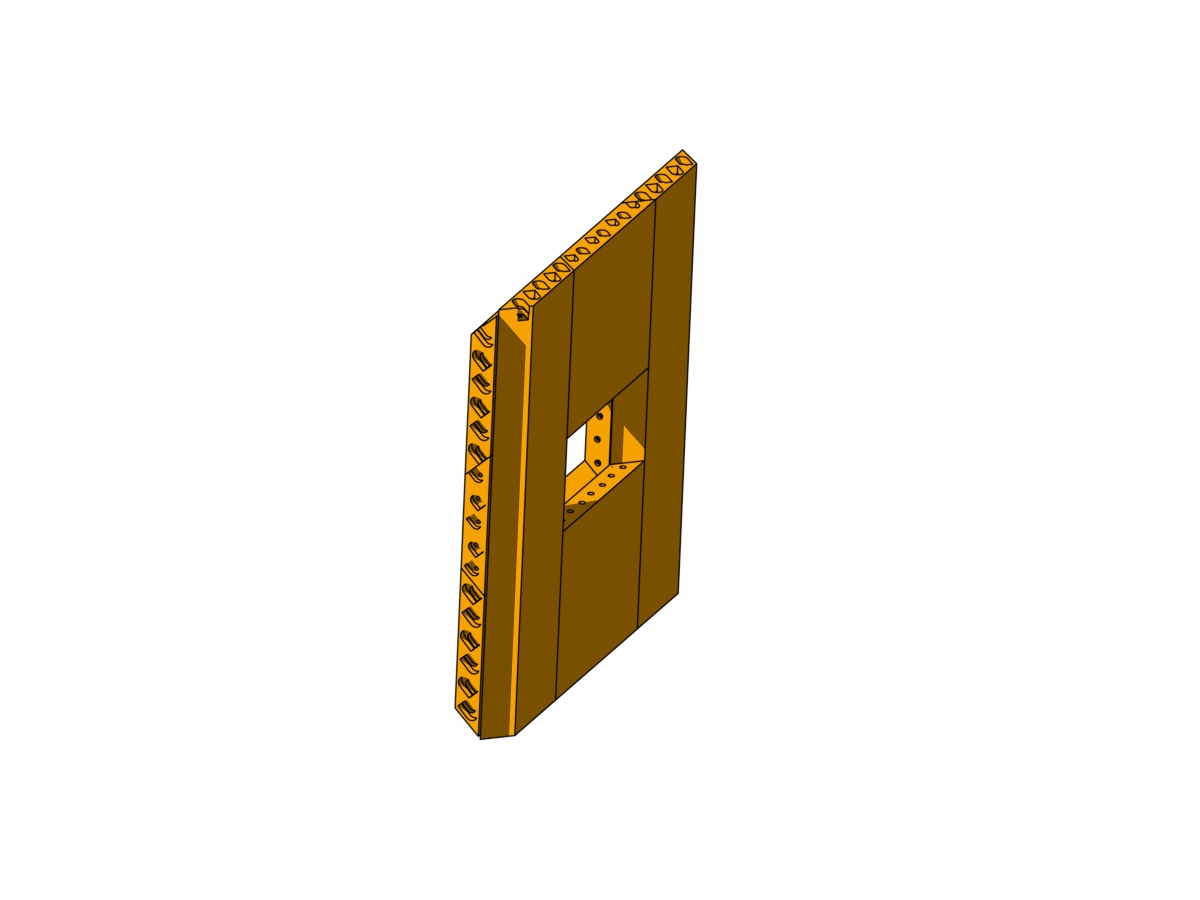
Each station contains 46 bars of variable length, divided into two separate flat layers of scintillator, in contact with each other, formed by coupling and glueing the triangular bars in the manner specified earlier and shown in figure 2 in the centre. One of the layers has the bars arranged in the horizontal direction (Y layer, 22 bars) and the other has the bars in the vertical direction (X layer, 24 bars). Because of the central hole we used bars of different lengths: long bars (300 mm), medium bars (117.5 mm) and short bars (102.5 mm). The X layer is composed of 10 long and 14 medium bars while the Y layer of 12 long and 10 short bars (figure 4).
The hit rate that each bar must support varies according to the position of the bar and along the bar itself. This rate has been carefully studied by means of a MonteCarlo (MC) simulation, as a high rate induces an inefficiency in data collection because of the SiPM recovery time. The two horizontal long bars (Y layer) closer to the hole for passage of the beam substain the highest rate. In order to keep the maximum rate of each SiPM in the limit of 1 MHz, each of these bars has been divided into two halves, each one read by a separate SiPM. This causes the number of SiPM and, therefore, the number of readout channels of each station, to become 48. To minimize dead zones, the bars were divided with a cut transverse to their longitudinal axis and the two facing ends were painted with titanium dioxide in order not to have cross-talk. The realization of each station was done following three main steps:
-
1.
preparation of the bars with their fibers and connectors for SiPM,
-
2.
quality test of the bars,
-
3.
assembly of the station using only bars that passed the test.
The first step starts bonding the SiPM connector to each fiber, previously cut to the right length and mirrored by Al sputtering at the end opposite to SiPM. Once ready, the fiber is inserted into the hole of the bar, the connector is glued to the bar and the hole containing the fiber is filled with the optical glue, that was prepared in advance in the amount appropriate to the lenght of the bar. During the filling the bar was kept vertical and the glue was injected from the bottom. Both the preparation and the injection of the glue were carried out with great care to avoid the formation of air bubbles. Once completed with fibers and connectors, the bars were characterized by a quality test and accepted or not on the basis of the obtained results. This characterization, which will be described in section 2.3, is important because a bar that was used for the realization of a station can no longer be replaced should it be faulty. In fact, since all elements which constitute a station are glued to each other, any apparatus malfunction can be remedied only by replacing the entire station.
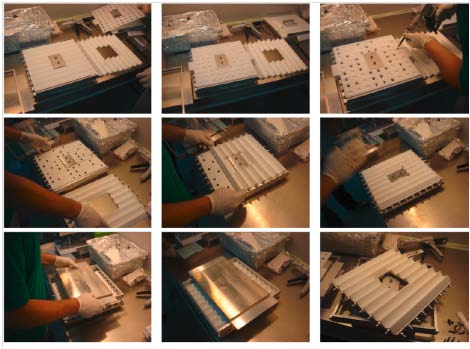
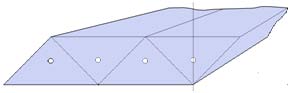
When all bars were ready, a station was assembled in two distinct stages, each of which took about one day. During the first day the central half-X and half-Y layer were glued together in the following way. First of all the bars of the first half-layer were arranged, with the vertex at the bottom, on a special aluminum jig that guaranteed the correct positioning (figure 5). A series of glue droplets, each of about 0.1 ml of glue, were distributed using a mask on the plane formed by the base surfaces of the bars. Soon after that the bars of the second half-layer were positioned on that plane using a second template. The two half-layers were then loaded with a weight in order to exert an appropriate pressure to ensure a uniform distribution of the glue and a good bonding of the parts. The second day the complementary bars were glued with a similar procedure, thus completing the assembly. A total of about 20 ml of low out-gassing epoxy glue (3M DP490) was used for each station.
2.3 Test of the bars
The quality test of the bars and the characterization of each bar were made by coupling the bar to a SiPM and studying its response to cosmic rays. The test was performed in two distinct ways: the first in self-trigger mode and the second by means of a trigger obtained using a telescope of two small scintillation counters (surface 2.5 2.5 cm2) in coincidence. In both cases, the bar and the readout electronics were placed in a thermostatic chamber that allowed to maintain a constant temperature of 25 0.1 ∘C. With the self-trigger test a comprehensive study was done of the response of the bar to cosmics going through in every part of the bar and in any direction. This allowed to have a sufficiently high rate of events, thus reducing considerably the measurement time. The signal of the SiPM, amplified by a trans-resistance amplifier, was collected by means of a fast digital oscilloscope Tektronix® TDS5054 connected to a PC. In order to get a rate of acquisition dominated by signals produced by cosmic rays, each signal was stored only if its amplitude exceeded 80 mV (corresponding to 16 photoelectrons), so that the contribution from the thermal noise of SiPM was negligible. A fixed number of signals was acquired for each bar and the bar was characterized by calculating the ratio R ( 1) between the number of signals exceeding the threshold of 250 mV (corresponding to 50 photoelectrons) and the total. For the second type of test the trigger is given by the telescope of counters in order to select cosmic rays (muons) traveling approximately in the vertical direction. It was placed above the bar at the opposite side with respect to the SiPM. This way the bar responds to minimum ionizing particles crossing nearly perpendicularly to its longitudinal axis. To reduce the time required to test them all, the bars were tested two at a time, arranging one above the other below the trigger telescope. Again, the signals produced by the two SiPMs were amplified, digitized by the oscilloscope and acquired by a PC (as before), if they exceeded the threshold of 200 mV. Each signal was integrated with respect to time and a number of photoelectrons () produced by the event was calculated by comparison to the area of the signal of a single photoelectron. The latter had been previously evaluated by studying the thermal noise produced by the SiPM not coupled to the bar. The bar was characterized using the average number of photoelectrons . After completing the measures, a two-dimensional plot (figure 6),
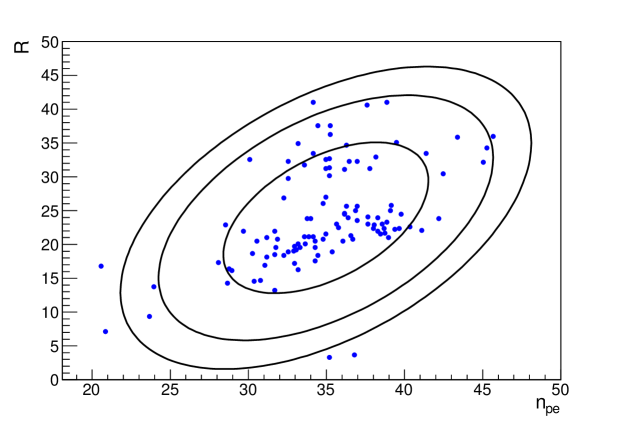
in which each bar is represeted by a point at coordinates , R), was built for each type of bar. Three ellipses were drawn on the plot, corresponding to variations of 1, 2 and 3 with respect to the average values (,), obtained after a rotation done to find the two uncorrelated variables. About % of produced bars that fell outside the 2 contour and gave and R were discarded.
3 Read-out electronics
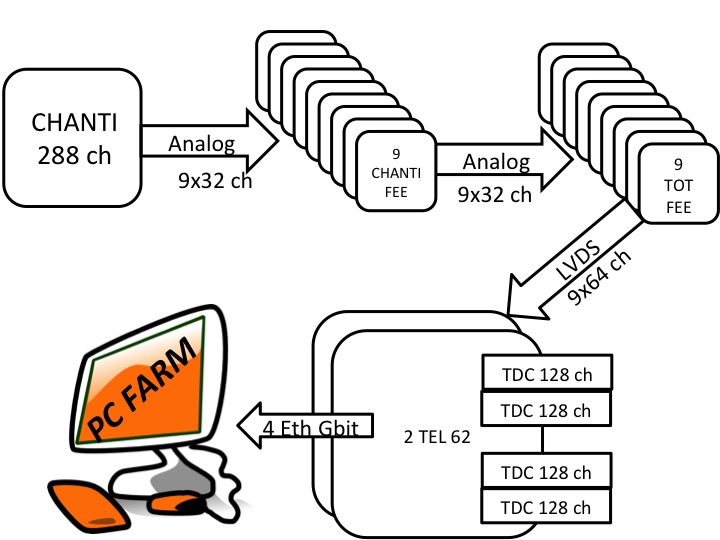
Due to the triangular shape of the bar cross-section, even particles crossing a bar with a trajectory perpendicular to the plane of the stations pass through variable thicknesses of scintillator; so the signals produced by SiPMs have, after amplification, amplitudes that typically vary between few mV to hundreds mV, with rise times of ns. The inner bars, being closer to the beam, give the highest rate of signals entering the front-end electronics. MC simulations showed that the expected value for that rate is of the order of 1 MHz. A block diagram of the read-out electronics, which is based on three different types of 9U VME boards, is shown in figure 7.
The first board has three different functions:
-
1.
provides for the SiPM V-bias and monitoring of SiPM current,
-
2.
checks the temperature stability of SiPM reading Pt100 probes (platinum resistance thermometers),
-
3.
receives signals from SiPM and transfers them to the next stage through trans-resistance amplifiers.
Each card has 32 channels that enter and leave through sub-DB (37 pin) connectors, and is able to monitor 4 two-pin Pt100 probes.
In order to achieve the necessary stability of the SiPM performance, each channel must have a stability in the bias voltage of order 10 mV or better for typical bias voltages of order 70 V. The dark currents, which at room temperature and in normal operating conditions are typically of order 100- 200 nA, are read with an accuracy of 1 nA. Analog to digital conversion to read the channel voltage and currents is made via AD7708 16 bit ADC for each channel, while the applied voltage is controlled and set individually for each SiPM via LTC2620 12 bit DAC.
The reading of the Pt100 probes is used in the software control system of the detector to adjust the bias voltage of each SiPM in order to mantain it at a fixed working point. The fast amplifier, providing a factor 25 on signal amplitudes for 50 Ohm impedance, has a cutoff frequency of 80 MHz. It is chosen to reach a reasonable compromise between the need to follow the risetime of the signals and the necessity to keep to an acceptable level high radio-frequency noise.
The second board (" board") is adapted from LAV (Large Angle Vetoes)
read-out electronics of NA62 [11]. Each input analog signal is filtered by means of an amplifier/splitter that produces two identical copies of the signal and feeds them to two discriminators. Each discriminator converts the analog input into a LVDS output whose duration equals the time the input signal stays above a configurable threshold. Therefore each input analog signal corresponds to two LVDS output signals. Since two different values of the thresholds are used, these two LVDS output signals have different durations. This arrangement is useful for correcting for time-walk (see section 4). The 64 LVDS signals produced this way are sent to TDCs contained in the third board
using two SCS12 connectors placed on the front of the card. The analog input
signals are also added four by four and sixteen by sixteen; the result is
available on 8 + 2 connectors LEMO00 for the purpose of monitoring. The
setting of the thresholds and the communications with DAQ card are
operated with a CANopen protocol through two RJ-45 connectors.
The third board (TEL62, Trigger Electronics for NA62), common to most of NA62 detectors, is a general purpose trigger and data-acquisition board that manages the read-out of NA62 [12]. It receives the LVDS logic signals by custom designed TDC mezzanines that provide the leading and trailing times for each signal with an accuracy of 100 ps LSB. The motherboard houses 4 TDC mezzanines, each serving 128 input channels. Each of the four TDC mezzanine is served by a FPGA (PP-FPGA); a fifth FPGA (SL-FPGA) collects data from the first four and drives another mezzanine board housing a 4-Gigabit Ethernet link. The TEL62 provides both for data acquisition and for the generation of primitives333Trigger primitives are data items from which the L0 trigger takes the L0 trigger decision. from most of the detectors used for the L0 trigger and sends the processed data to the PC farm in response to the L0 trigger. The TEL62 is based on the design of the TELL1 read-out card [13], developed for the LHCb experiment, of which essentially retains the basic functions but with modifications to suit the needs of NA62 and to take into account developments of electronic components post TELL1 project.
4 Expected detector performance
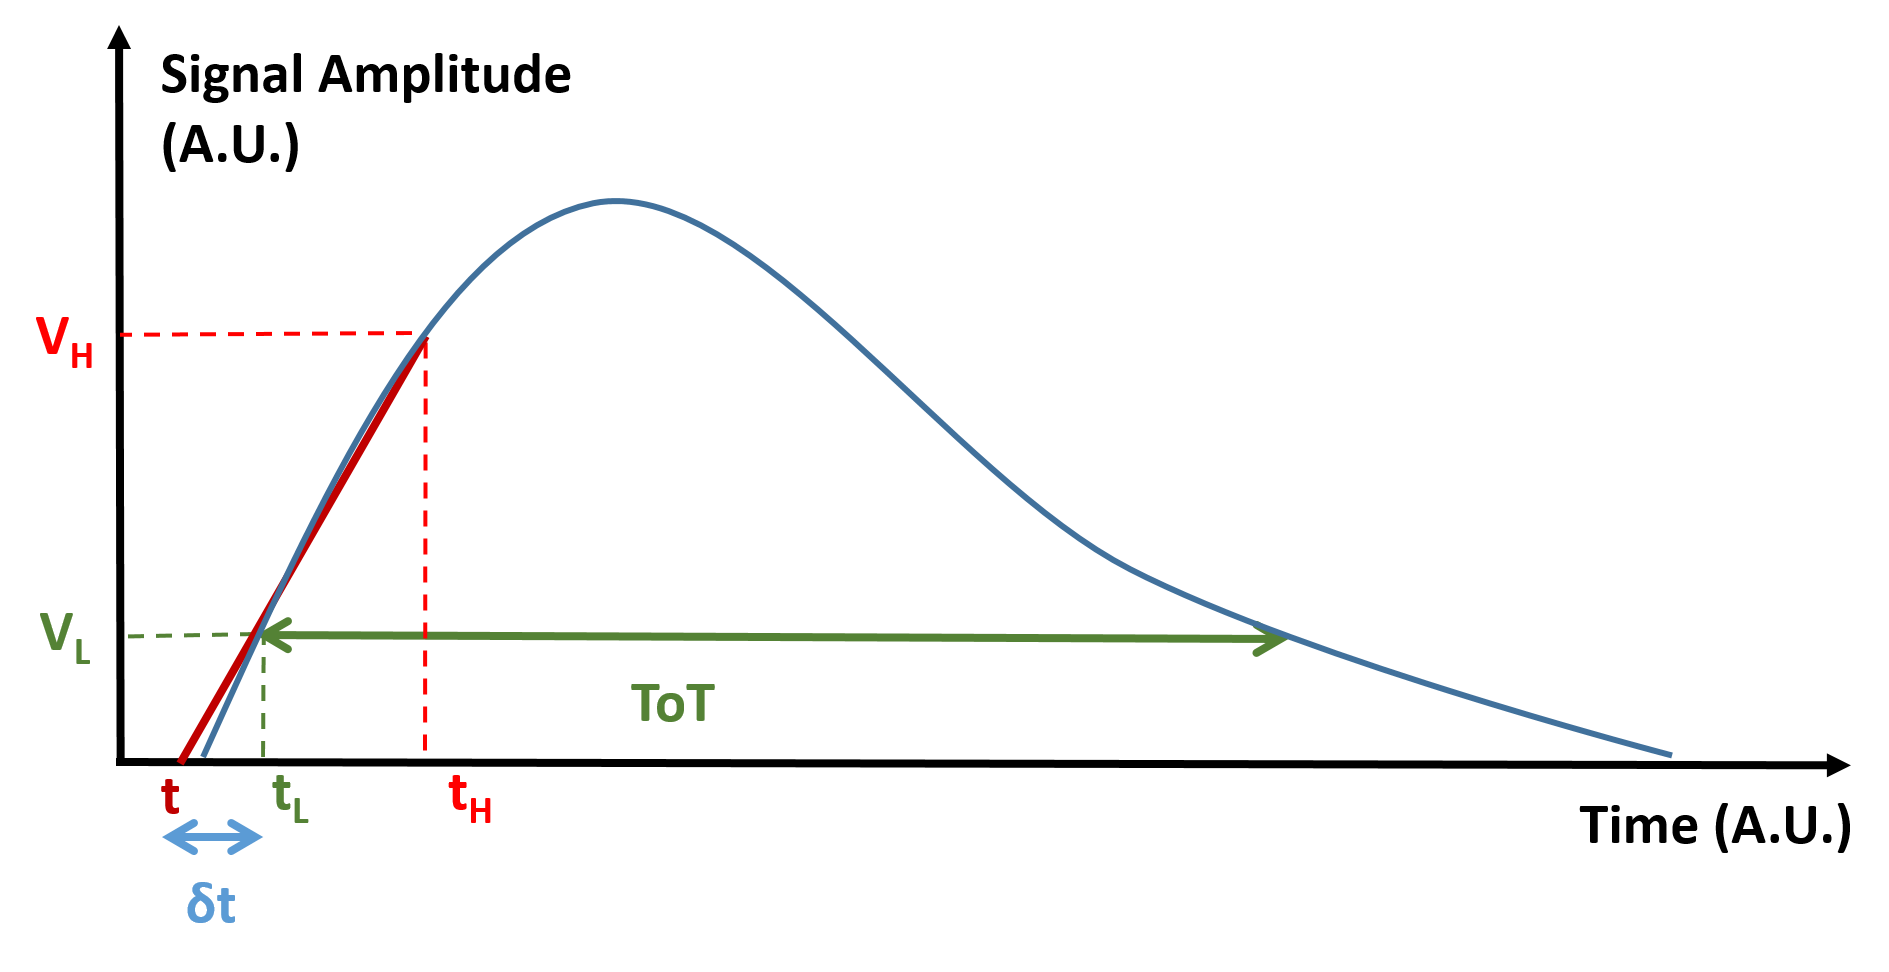
The performance of the detector has been thoroughly tested on several prototypes, both using cosmic rays and during the so-called NA62 “technical run” in 2012. Tests have concentrated on the main figures of merit for the detector, namely its time resolution and its efficiency. Regarding the time resolution, the basic idea to reach the needed performance, is the ability to perform the appropriate time walk correction, without measuring the integrated signal charge. This is done using two features of the front-end electronics, namely the possibility to measure the time at which the signal crosses two different thresholds (so called Low and High threshold respectively), and the time it stays above each of them. Signals passing both the low and high thresholds allow the determination of the time t a particle passes through the detector corrected for the "time-walk"; in fact, in linear approximation,
| (1) |
where and are the high and low thresholds and and are the "leading times" corresponding to the high and the low
thresholds (see figure 8).
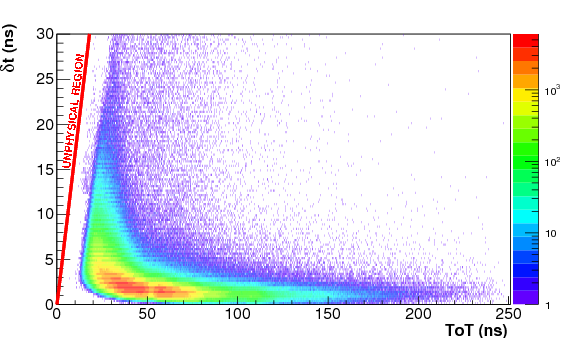
The correction is correlated to as can be seen from the distribution in figure 9. In order to apply the time-walk correction also to the signals which only cross the low threshold, the distribution in figure 9 has been fitted and the correction has been parametrized as a logarithmic function of the .
Details of the tests performed have been reported elsewhere [14], [15], [16]. It is sufficient here to stress that tests done in different conditions, using beams or cosmic rays, have all pointed towards a single hit time resolution of the CHANTI (after time walk and position corrections are applied) of order 1 ns (cfr. in [16]). Regarding the efficiency, the first laboratory measurement was carried out using a prototype made of 5 bars. A 4-fold coincidence of small scintillator counters selected vertical muons crossing the three central bars of the prototype. The signals from the five bars were processed by the CHANTI front-end card and sent to the "" card which converted the analog input signals into LVDS digital signals. The LVDS signals were then processed by a TDC VME module (equipped with the same TDC of the TEL62 card) whose outputs (leading and trailing times) were acquired by a PC. A good event was defined by at least one bar fired giving an analog signal over a fixed threshold and a corresponding full LVDS signal, i.e. a signal with a leading and trailing times, in the time window of the trigger. Data were collected for 6 monospaced different thresholds ranging from 10 to 60 mV. Events were collected at each threshold. Figure 10 shows the efficiency as a function of the threshold.
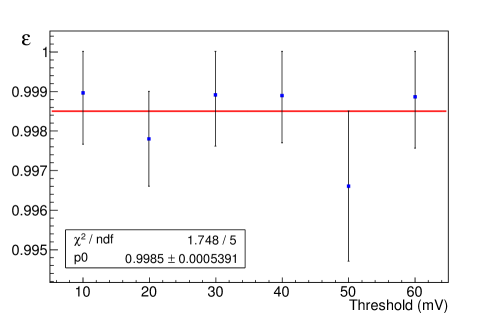
As can be seen the efficiency is the same, within error, for all thresholds and its mean value is . Anyway the two lower thresholds, which correspond to a signal of about pe, are not usable in practice in the final experimental setup; indeed, given the SiPM thermal noise, they would generate a single channel accidental activity in the CHANTI of the order of (or even above) the physical signal rate at full intensity.
5 Results from the first NA62 run
In the course of 2014 the construction of CHANTI was completed. Figure 11 shows the first five CHANTI stations assembled in their vacuum vessel.
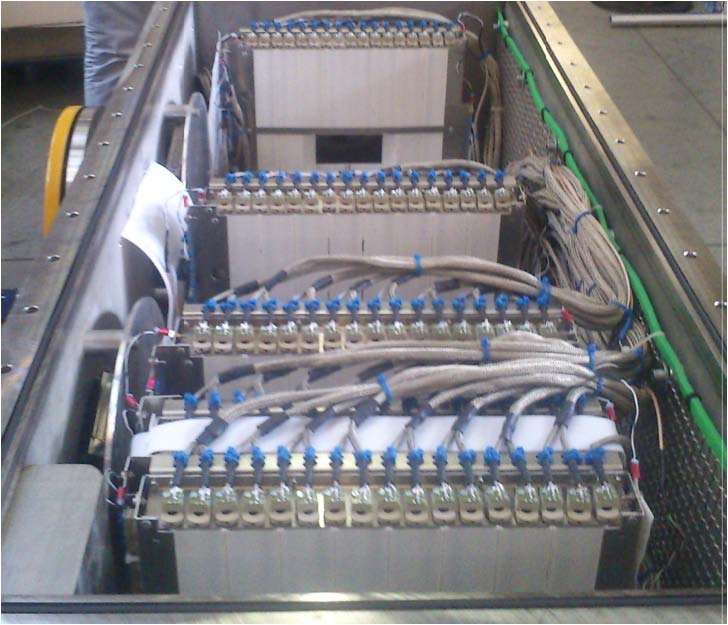
The sixth stays in a vacuum chamber extention at about one meter from the fifth. The whole detector, consisting of six separate stations (figure 3) for a total of 288 physical channels and 576 electronic channels, was installed at CERN on the NA62 beam line. The experiment started data taking with a run carried out between October and December 2014. The main purpose of the run was the "commissioning" of the NA62 apparata. Data were collected in three different conditions:
-
•
in the absence of beam,
-
•
with a beam of hadrons,
-
•
with a beam of muons.
The third condition corresponds to the situation of beam but with the presence of a "filter" according to which the particles that reach the detector are essentially muons.
Data on dark noise (figure 12), collected from the six stations in the absence of beam, allowed to evaluate the amplitude of the single photo-electron signal with the complete electronic chain.
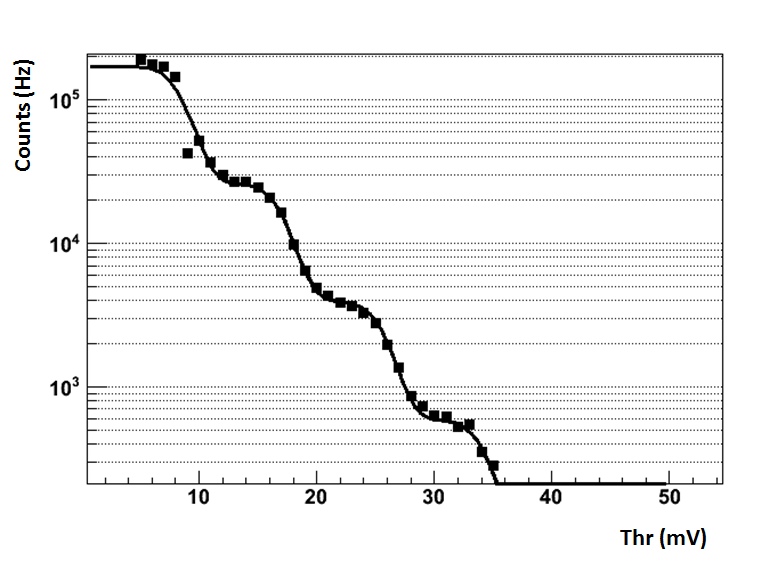
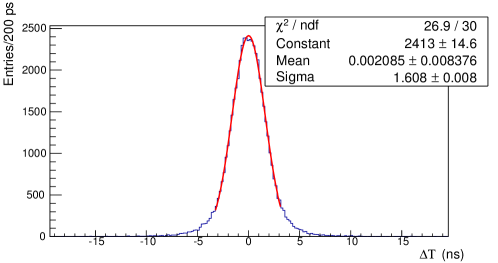
This amplitude is equal to mV for all channels in full agreement with what was obtained previously. Using part of the collected data, the time resolution of the detector was re-measured by the method of the difference between the "leading times" of signals from bars produced by the same track. A plot of this difference, not corrected for time-walk and difference of channels, is shown in figure 13.
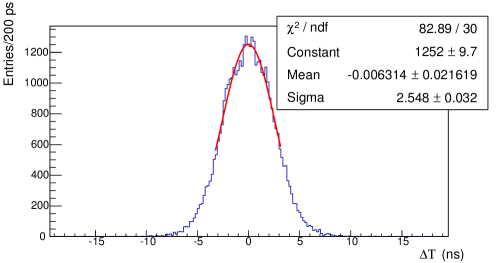
The first correction was parameterized according to the with the method illustrated before; the second was estimated by the difference in the transit time of particles of the same event recorded by CHANTI and by the Cherenkov kaon tagger of NA62 (KTAG). Figure 14 shows the corrected distribution, from which one gets a time resolution of ns, in agreement with the result of tests on prototypes.
When the beam is present, CHANTI is hit by secondary particles produced primarily by the interaction of the beam with the third station of the beam spectrometer (GTK3) as well as by the penetrating particles of the beam halo, that are essentially muons proceeding in a direction parallel to the beam and crossing the CHANTI stations perpendicularly to their plane frames. So two types of events are recorded by CHANTI. Due to the triangular section of the bars (figure 2 on the right), in the case of muons an anticorrelation exists between the amplitudes, and then between the , of the signals recorded in two coupled bars. Since the has a logarithmic dependence from the charge generated by the particle that passes through the bar, a pseudo-charge may be associated to each signal, defined as , with ns. This formula has been determined by the MC program that simulates in detail the CHANTI. It can be used to determine the position where the particle impacts two coupled bars doing a charge weighted average of the nominal positions of the bars and, thus, to study the spatial resolution of the detector. In figure 15 it is shown, as an example, the difference between the x-coordinate (vertical bars) determined by the positions of two coupled bars of the third station and the corresponding one of the fourth station.
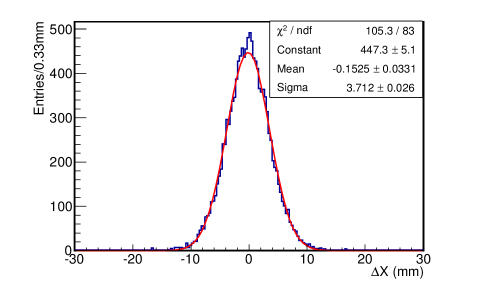
Assuming, as it is reasonable to do, the two stations have the same spatial resolution, from that plot one obtains mm. A systematic study of all stations led to the result mm. This has to be compared with the rms (4.9 mm) of a flat distribution with a pitch of half of a bar base. Using tracks of passing particles ("muons") parallel to the beam direction, the CHANTI efficiency was studied, for each station and for each view, both for coordinates x (view with vertical bars) and y (view with horizontal bars) separately and as a function of the xy position. Let us consider, for example, the study of efficiency as a function of x. A "muon" is defined as an event that gives at least one hit in two vertical coupled bars of a station and in the corresponding bars of four other stations; the sixth station is defined efficient if it presents for the same event at least one hit in the corresponding coupled bars or in one of the two immediately nearby bars. Efficiency is defined as the ratio between the number of times the station was efficient and the total number of selected events. Figure 16
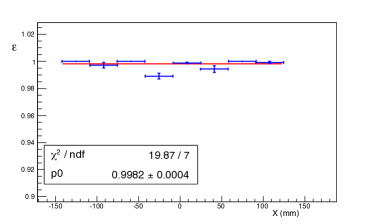
shows the efficiency of the X layer of the first station as a function of the position of the vertical bars. The single layer efficiency, defined as above, resulted . It is worth noting that a layer efficiency ensures that the CHANTI inefficiency for detecting a charged particle, passing through both layers of a station, is less than 0.1%.
6 Conclusions
The design, construction and test of CHANTI, a charged particle detector made of scintillation counters read by Silicon Photomultipliers, have been described. CHANTI will be used as a veto counter in the NA62 experiment at CERN. Measurements done on prototypes and during the first period of the data taking with the complete detector resulted in a single channel resolution of 1.14 ns and a single layer efficiency greater than 0.99 in agreeement with the design values.
Acknowledgements.
We want to thank the technicians of mechanical and electronic workshops of the Naples Section of the National Institute of Nuclear Physics (INFN) for the efforts they put in the development and construction of the detector. We want also thank A. Orlandi and A.Viticchie’ from the National Laboratory of Frascati for their help in polishing and mirroring of the WLS fibers. This work has been partially funded by Italian Ministry of University and Research (MIUR) with the PRIN Grant Prot. Number 2010Z5PKWZ_008.References
- [1] NA62 Collaboration, Proposal to measure rare decay at the CERN SPS. CERN-SPSC-2005-013, 2005.
- [2] A. J. Buras, D. Buttazzo, J. Girrbach-Noe, R. Knegjens, and ,in the Standard Model: status and perspectives, JHEP 11 (2015) 033 [arXiv:1503.02693].
- [3] A. V. Artamonov et al., BNL-E949 Collaboration, Phys. Rev. 092004 2009.
- [4] S. Adler.et al., Measurement of the K branching ratio. Phys. Rev. 052003 2008.
- [5] F. Hahn (ed.) et al., NA62 technical design document. NA62 Document 10- 07.
- [6] D. Beznosko, A. Bross, A. Dyshkant, A. Pla-Dalmau, and V. Rykalin, FNAL- NICADD extruded scintillator. prepared for 2004 IEEE Nuclear Science Sym posium and Medical Imaging Conference (NSS / MIC), October, 16–22, 2004 Rome, Italy.
- [7] http: //outgassing.nasa.gov/
- [8] V. Palladino, Simulation, realization and test of veto systems for NA62 exeperiment. Ph D. Thesis 2010.
- [9] http://www.fluka.org/fluka.php, Fluka Home Page.
- [10] http://geant4.web.cern.ch/geant4/, Geant4 Home Page.
- [11] A. Antonelli et al., The NA62 LAV front-end electronics. \jinst72012C01097.
- [12] B. Angelucci, E. Pedreschi, M. Sozzi, F. Spinella, TTEL62: an integrated trigger and data acquisition board, prepared for 2011 IEEE Nuclear Science Symposium and Medical Imaging Conference (NSS / MIC). October 2011, vol. 823, no 826, pp. 23-29.
- [13] G. Haefeli, A. Bay, S. Gong, H. Gong, M. Muecke, N. Neufeld, O. Schneider, The LHCb DAQ interface TELL1, NIM A560 494- 502 2006.
- [14] F. Ambrosino et al, The CHarged AntiCounter for the NA62 experiment at CERN., ScienceDirect Physics Procedia 372012675–682.
- [15] D. Di Filippo, Simulation and test of the CHANTI detector for the measurement of the ultra-rare branching ratio with the NA62 experiment at CERN. Ph D. Thesis 2011.
- [16] F. Ambrosino et al, The CHarged AntiCounter for the NA62 experiment at CERN., prepared for 14th ICATPP Conference on Astroparticle, Particle, Space Physics and Detector for Physics Application.September, 23–27, 2013 Villa Olmo Como, Italy.