Identification of z Herschel 500m sources using color-deconfusion
Abstract
We present a new method to search for candidate Herschel 500m sources in the GOODS-North field, using a / “color deconfusion” technique. Potential high- sources are selected against low-redshift ones from their large 500m to 24m flux density ratios. By effectively reducing the contribution from low-redshift populations to the observed 500m emission, we are able to identify counterparts to high- 500m sources whose 24m fluxes are relatively faint. The recovery of known starbursts confirms the efficiency of this approach in selecting high- Herschel sources. The resulting sample consists of 34 dusty star-forming galaxies at . The inferred infrared luminosities are in the range L⊙, corresponding to dust-obscured star formation rates (SFRs) of M⊙ yr-1 for a Salpeter initial mass function. Comparison with previous SCUBA 850-selected galaxy samples shows that our method is more efficient at selecting high- dusty galaxies, with a median redshift of and 10 of the sources at . We find that at a fixed luminosity, the dust temperature is K cooler than that expected from the relation at 1, though different temperature selection effects should be taken into account. The radio-detected subsample (excluding three strong AGN) follows the far-infrared/radio correlation at lower redshifts, and no evolution with redshift is observed out to , suggesting that the far-infrared emission is star formation dominated. The contribution of the high- Herschel 500m sources to the cosmic SFR density is comparable to that of (sub)millimeter galaxy populations at and at least 40% of the extinction-corrected UV samples at . Further investigation into the nature of these high- dusty galaxies will be crucial for our understanding of the star formation histories and the buildup of stellar mass at the earliest cosmic epochs.
Subject headings:
galaxies: high-redshift – galaxies: starburst – infrared: galaxies – submillimeter: galaxies1. Introduction
Ultraluminous infrared galaxies (ULIRGs; with rest-frame 8-1000m luminosities in excess of L⊙) are among the brightest far-infrared (far-IR) emitters in the Universe (Sanders & Mirabel 1996; Casey, Narayanan & Cooray 2014 and references therein). The far-IR luminosities of ULIRGs are dominated by reprocessed thermal dust emission due to star-formation activity, corresponding to a star formation rate (SFR) of 170 M⊙ yr-1. Locally, these luminous, dusty star-forming galaxies are rare, but they become more abundant with increasing redshift and dominate the IR luminosity density of galaxies around (Lagache et al., 2005; Chapman et al., 2005; Le Floc’h et al., 2009; Magnelli et al., 2009, 2013). The formation process of ULIRGs is currently in dispute. While mergers are believed to be a dominant process in local ULIRGs, studies have suggested that the driver of star formation in ULIRGs at high redshift () appears different (e.g., Dekel et al. 2009), with a significant fraction being pure disks (e.g., Kartaltepe et al. 2012; Targett et al. 2013). Reproducing the number counts and extreme far-IR luminosities for this population, especially those at the highest redshifts, can place tight constraints on galaxy formation models (Baugh et al., 2005; Swinbank et al., 2008; Coppin et al., 2009). Since a significant fraction of cosmic star formation is likely hidden by dust (e.g., Lagache et al. 2005; Chapman et al. 2005; Casey et al. 2012a, 2012b, 2014; Barger et al. 2012; Lutz et al. 2014; Madau & Dickinson 2014), understanding high- far-IR luminous galaxies is crucial in order to construct a complete picture of galaxy evolution.
Observations at submillimeter (submm) and millimeter (mm) wavelengths have identified a population of ULIRGs at high redshift (e.g., Borys et al. 2003; Pope et al. 2005; Perera et al. 2008; Michałowski et al. 2010a,b; Yun et al. 2012; Wardlow et al. 2011; Roseboom et al. 2013; Casey et al. 2013), which benefits from a strong negative -correction in the (sub)mm. Follow-up studies of submm-selected galaxies (SMGs) have shown that the bulk of SMGs is between (e.g., Chapman et al. 2005), with less than % being at (Chapin et al. 2009; Biggs et al. 2011; Wardlow et al. 2011; Michałowski et al. 2012). While radio identification has been the common technique to precisely localize SMGs at other wavelengths for follow-up observations, a significant number of them remain undetected even in the current deepest radio observations (e.g., Swinbank et al. 2014; Barger et al. 2014), indicating that they are possibly at higher redshifts. Interferometric submm imaging of SMGs has been used to unambiguously identify counterparts in the optical/near-IR in a relatively unbiased way, revealing a significant population of SMGs at 3 (e.g., Younger et al. 2007, 2009; Smolčić et al. 2012a, 2012b, 2015; Miettinen et al. 2015), challenging the previously derived redshift distribution of SMGs (see also Vieira et al. 2013). On the other hand, the selection of SMGs is known to be severely biased against galaxies with warmer dust temperatures (e.g., Chapman et al. 2003; Casey et al. 2009; Magdis et al. 2010; Chapman et al. 2010; Magnelli et al. 2010). Therefore, the properties of the whole high- ULIRG population, such as the redshift distribution, luminosity and number density, are still not well characterized.
The Herschel Space Observatory (hereafter Herschel) carried out observations in the far-IR bands up to 500m and mapped much larger sky areas down to the confusion limit than previous (sub)mm surveys. By sampling the peak of heated dust emission for the first time, Herschel enables a direct assessment of the far-IR spectral energy distribution (SED) of SMGs (e.g., Magnelli et al. 2010, 2012, 2014; Huang et al. 2014; Swinbank et al. 2014). It has provided unbiased measurements of obscured SFR, dust temperature and dust mass for a large number of star-forming galaxies up to (e.g., Elbaz et al. 2010, 2011; Oliver et al. 2012; and references therein).
It has also been shown that Herschel is efficient at detecting galaxies at very high redshift when a well-characterized selection is used (e.g., Pope & Chary 2010). For instance, Riechers et al. (2013) pre-selected sources with red SPIRE colors (i.e., vs. ), yielding a sample of potential sources, including one at , the most distant known ULIRG to date. Nevertheless, the requirement of means that such selection is biased against some dusty star-forming galaxies with warm dust temperatures (Daddi et al. 2009b; Capak et al. 2011; Smolčić et al. 2015), and limited to the brightest 500m sources (30 mJy, Dowell et al. 2014). Therefore, a more conservative and efficient way to select high- ULIRGs is required to better understand the properties of this important population of dust obscured galaxies in the early Universe.
A challenge in studying the properties of high- Herschel sources has been the low resolution of the data, especially in the SPIRE passbands (full width at half maximum, FWHM, 18″, 25″and 36″at 250, 350 and 500m, respectively). Source confusion is a severe issue in the Herschel data, which makes it difficult to identify the correct counterparts and measure fluxes for individual Herschel sources. The most common technique to deconvolve the Herschel sources is the use of Spitzer-MIPS 24m data of better resolution (5.7″) as the position priors to fit their fluxes (e.g., Magnelli et al. 2009, 2013; Roseboom et al. 2010; Elbaz et al. 2011; Leiton et al. 2015). This de-blending approach assumes that all Herschel sources are detectable in the deep 24m images, and thus introduces a bias against 24m-faint galaxies which fall below the detection limit. Moreover, the extraction of 24m catalogs usually requires IRAC source positions as priors, which can introduce additional identification biases. Magdis et al. (2011) have demonstrated that in the Great Observatories Origins Deep Survey (GOODS) fields, about 2% of the PACS sources are missed in the MIPS-24m catalog, most of which being at and with strong silicate absorption features. There has been no systematic study to address this issue for SPIRE sources, though simulations suggest that statistically very few sources would be missed when requiring a 24m prior (Leiton et al. 2015).
Further problems arise when priors are too close for the Herschel flux to be deconvolved: when two 24m priors are closer than the FWHM/3 of any given Herschel band, the flux is usually attributed to one or the other. Previous studies have systematically favored the brightest of the two 24m counterparts (e.g., Magnelli et al. 2009, 2013). While such a choice is generally justified for sources at low redshift, it can mis-identify the counterpart of a very distant source which is faint at 24m but much brighter at Herschel wavelengths, especially in the SPIRE 500m band. For the same Herschel 500m flux, a galaxy can be a factor of 40 fainter in the 24m band than a galaxy at (e.g. Leiton et al. 2015). Indeed, the recent study of Yan et al. (2014) has shown that the brightest 24m source does not necessarily contribute predominately to the far-IR emission seen in the SPIRE bands. It is therefore important to investigate in detail the mis-associated and/or missed population of luminous, high- Herschel sources which could play a significant role in the star formation history in the early Universe (Casey et al. 2012b, 2014; Barger et al. 2012; Dowell et al. 2014).
In this paper, we have undertaken a systematic search for high- Herschel 500m sources in the GOODS-North field, which has the deepest SPIRE observations currently available, using a map-based “color deconfusion” technique. We show that our method, by constructing a / ratio map, can effectively extract high- sources contributing to the 500m emission. The resulting sample consists of 36 galaxies identified at . In Section 2 we present the data and our method; in Sections 3 &4 we present and discuss the derived properties of the galaxies, and we summarize the results in Section 5. Throughout this paper, we adopt km Mpc-1, , , and we use a Salpeter initial-mass function (IMF).
2. Data and method
2.1. Data
The data used in this paper come from the Herschel observations of GOODS-North field as a part of the GOODS-Herschel program. The observations cover a total area of 10′17′ down to depths of 1.1, 2.7, 5.7, 7.2 and 9 mJy (3) at 100, 160, 250, 350 and 500m, respectively. The SPIRE images of GOODS-North are the deepest observations undertaken by Herschel to date, while the PACS data are slightly shallower than the central region of GOODS-South obtained in GOODS-Herschel that was combined with the PEP survey in Magnelli et al. (2013). A detailed description of the observations is given in Elbaz et al. (2011). We take advantage of these deep Herschel observations, along with the deep Spitzer/MIPS 24m observation of the GOODS-North field (PI: M. Dickinson), to identify the best candidates of distant dusty star-forming galaxies seen by Herschel. Other ancillary data are used including /IRAC at 3.6, 4.5, 5.8 and 8m, VLA at 1.4 GHz (5Jy, Morrison et al. 2010), SCUBA at 850m ( catalog, Pope et al. 2006; Wall et al. 2008), SCUBA-2 at 850m (4 catalog, Barger et al. 2014), and AzTEC at 1.1mm (3.8 catalog, Perera et al. 2008; Chapin et al. 2009).
Photometric redshifts used in this paper are drawn from a -band selected multi-wavelength catalog in the GOODS-North field, spanning 20 photometric bands from NUV to IRAC 8m. We refer the reader to Pannella et al. (2015) for a more detailed description of the multi-wavelength data, catalog production and photometric redshift estimation. This catalog contains 14828 galaxies, % of which are brighter than the 5 limiting magnitude of , and 3775 galaxies having spectroscopic redshifts. By comparing to the spectroscopic subsample, Pannella et al. found that the relative accuracy [] of photometric redshifts reaches 3%, with less than 3% catastrophic outliers (e.g., objects with ). Based on the multi-wavelength photometric catalog, stellar masses were determined with for each of -detected sources (see Pannella et al. 2015 for more details).
2.2. Construction of the / ratio map
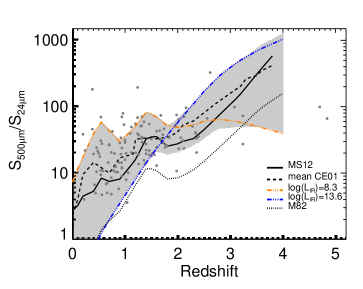
In this section, we present our method to identify candidate high- dusty galaxies. The observed far-IR/24m colours of individual galaxies are known to be correlated with redshift (Leiton et al. 2015). The trend is strongest for the 500m/24m colour. In Figure 1, we show the evolution of the 500m/24m ratio as a function of redshift for the main-sequence SED from Magdis et al. (2012) (solid black line) and the mean trend of Chary & Elbaz (2001; CE01) templates (dashed black line). While the SEDs for galaxies at are poorly constrained, distant galaxies are characterized by large 500m/24m ratios (e.g., / at ). These SEDs are globally in agreement with the observed 500m/24m colour distribution of the “clean” sources in the GOODS-North field (grey dots)161616Clean galaxies are defined as sources with neighbour of within a distance of 20″(e.g., Elbaz et al. 2011), for which blending effects are small.. We note that there exists a population of low-luminosity galaxies below with relatively high / ratios, causing the large scatter of the distribution. They might be cold galaxies with abnormal low dust temperature of 10-20 K (25 per degree2, e.g., Rowan-Robinson et al. 2010). However, given the very small area covered by GOODS-North, we estimated that the number of such galaxies is low () in the field. Some silicate-break galaxies at and may contribute the elevated / ratios due to the shift of the silicate absorption features into the MIPS/24m band at these redshifts, but their fraction is relatively small (less than 10%, Magdis et al. 2011). Alternatively, the large scatter could be partly attributed to the catastrophic photometric redshift outliers, or chance associations of a high- 500m galaxy with a lower redshift 24m prior. These require further investigations.
Therefore, with the assumption that redshift dominates over temperature evolution in producing the observed shift of the IR SEDs, we are able to select distant galaxies against the low-redshift ones based on their large 500 m to 24 m flux ratios. We choose this color over the shorter SPIRE wavelengths because the 500m band probes the peak of far-IR emission up to the highest redshifts. However, due to the source blending issues, it is difficult to unambiguously assign a measured 500 m flux density to a specific object seen in higher resolution images. A single 500m source is usually made of multiple 24m counterparts that are not necessarily associated. Simulations have shown that 500m flux densities can be systematically overestimated due to source blending (Leiton et al. 2015). Therefore, we do not simply search for targets using pre-existing 500m photometric catalogs where flux measurements might be highly uncertain, but use a map-based technique keeping the information of the flux distribution in the observed images.
Our search approach consists of building a 500m/24m ratio map, which relies on the deep /MIPS 24m data. For the GOODS-North field of interest here, the 24m data reach fainter far-IR luminosities than the Herschel bands up to redshift (see Figure 4 in Elbaz et al. 2011). To build our / ratio map, we use the real SPIRE 500m map that we divide by an image containing all 24m detections down to 21Jy (at a level of 3, totally 2704 galaxies), which are distributed at their actual positions. We do not use the real -MIPS 24m image because we found that even after smearing the image to the 500m beam, negative pixels due to noise fluctuations introduced fake sources in the / ratio map. In brief, we added point sources using the 500m point spread function (PSF) at the positions 24m sources under identical astrometric projection as the 500m map, scaling each PSF to the 24m flux, to build an image that matches the actual 500m map in beam size and pixel scale. The astrometric accuracy of the 500m map is verified by stacking at the positions of 241 24m sources with in the range 10-35 mJy in the field. The stacked map has an offset from the center of the 24m counterparts of arcsec, which is small compared to the 7.2 arcsec pixel size of the 500m map. In order to take into account the astrometry uncertainties of the Herschel data, a random astrometric error of 0.5″ was introduced to the source positions. Note that in this beam-smeared image, 24m flux density for each source is kept, and the background is dominated by the smeared faint sources populating the whole image.
We then construct a 500m/24m ratio map by dividing the actual 500m image by the beam-smeared 24m map. Since low- galaxies are expected to have much lower / ratios compared to high- ones (Figure 1), this procedure thus effectively reduces the contribution to the map from the bulk of the low-redshift galaxy population, while considerably boosting the signal from candidate distant sources.
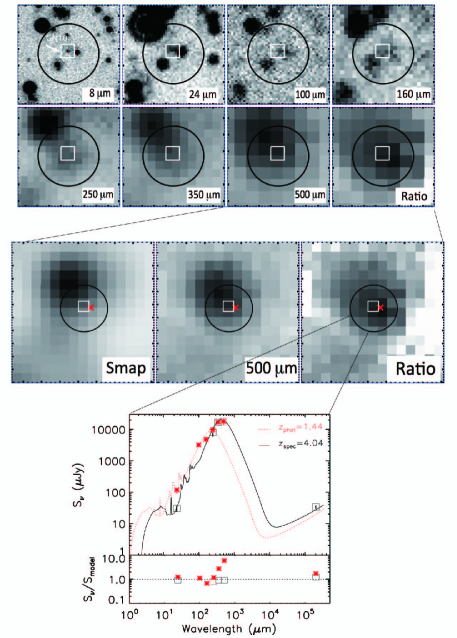
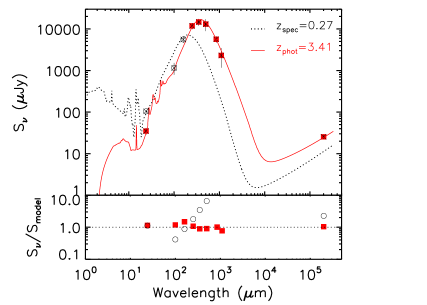
In Figure 2, we show an example of a spectroscopically confirmed SMG (GN10, Daddi et al. 2009a) identified in the / ratio map (see Section 2.3.1), whose 500m flux was initially wrongly associated to a nearby source at due to the strong source blending. It can be seen from Figure 2 that GN10 is faint at 24m, and its SPIRE emission particularly at 500m is heavily blended with nearby sources, making it difficult to identify directly. In contrast, the galaxy is unambiguously uncovered in the / ratio map at a position coincident with its 24m counterpart. Note that the measured SPIRE 350m and 500m flux in the public catalog (Elbaz et al. 2011) is associated with the nearby galaxy. However, as shown in Figure 2 (lower panel), SED fittings using the whole library of CE01 SED templates to the 24m to far-IR photometry suggest that this source contributes to % of the measured 500m flux. The use of the starburst SED derived by Magdis et al. (2012) didn’t improve the fittings and yielded similar results, strongly suggesting that the source is likely wrong associated as the counterpart. Conversely, the best-fitting SED model at the redshift of GN10 yields a much better result (31.9), indicating it should dominate the measured 500m emission. This demonstrates the effectiveness of our method for uncovering and selecting high- 500m sources. The selection efficiency of our method will be investigated in detail on simulated data (Section 2.3.1) and a validation of the method using SCUBA2 data is presented in Section 2.3.3.
2.3. Object identification in the map
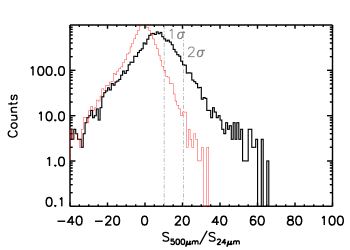
Given that the ratio is very sensitive to high- sources, we then perform a systematic search for candidates on the ratio map using SExtractor (Bertin & Arnouts 1996). Since the noise distribution is highly non-Gaussian in the final ratio map, it is difficult to define a minimum signal-to-noise (S/N) requirement for source extraction. We therefore used simulations to determine the minimum S/N threshold in order to optimize the “purity” and completeness of the resulting sample. Based on such simulations (see Section 2.3.1), we adopted a minimum S/N of 2, corresponding to a minimum / ratio of 20.4, where the noise fluctuation, or defined as “effective” noise, was estimated from the dispersion of pixel distribution in the ratio map, P(D) plot, as shown in Figure 3 (black curve). Note that this S/N requirement based on simulations cannot be translated to a nominal flux detection limit in a trivial way, but it is sufficient for our purpose of identifying candidate high- galaxies. A more detailed description on the simulations and the detection efficiency will be given in the next section.
2.3.1 Selection efficiency
For our sample to be robust and meaningful, we need to determine the efficiency of our selection of infrared-luminous galaxies. To do this we perform Monte-Carlo (MC) simulations by injecting fake sources into the actual maps. The positions of injected sources are randomly distributed but are chosen to avoid overlapping within known sources detected in the ratio map (Section 2.3). In the simulations, we assumed a mean / color evolution with redshift, as shown by the dashed curve in Figure 1. The evolutionary trend is derived by averaging the / color over a suite of CE01 templates for a given redshift bin. As we will describe later, we used mainly the CE01 library to fit the mid-to-far-IR photometry and derive the integrated far-IR luminosities. The CE01 library comprises a total of 105 SEDs with a range of dust temperatures and is widely used to characterize the far-IR properties of ULIRGs (e.g. Magnelli et al. 2012; Swinbank et al. 2014). The simulation samples a range from 5 mJy to 30 mJy in nine steps and a redshift range in six steps. We estimated the efficiency of detection at a given flux and redshift as the fraction of the injected sources that were recovered in the ratio map, using the same selection procedure as above171717Sources are considered recovered if they are found within 2 pixels of the injected position with a peak S/N above ..
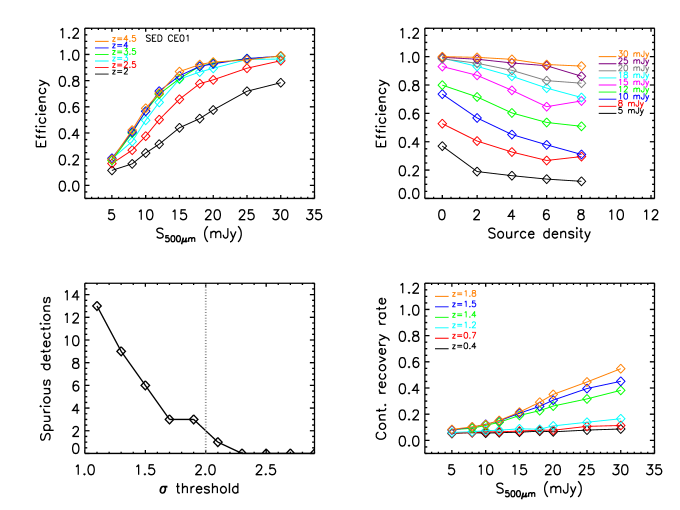
We carried out =200 independent simulations for each of the flux densities, each of which has =20 sources injected. was chosen to be small enough to avoid overlapping between the simulated sources. The averaged detection efficiency over the simulations forms the final detection efficiency, which is displayed as a function of redshift and in Figure 4. This figure shows that, as expected, the recovery efficiency increases at high flux densities and redshifts. For instance, for a =15 mJy (typical confusion limit, Nguyen et al. 2010) source at redshift , the selection efficiency is 45%, while it increases to % for galaxies with the same flux. Above , the curves of the detection rate as a function of flux evolve very similarly, suggesting that our method is effective at selecting high redshift sources with a completeness of % for a 10 mJy source. Note that the detection efficiency for each real source depends on the intrinsic SED, as well as the possible presence of source blending.
Due to the contamination of bright nearby sources, which is particularly strong in the SPIRE 500m band, the selection could introduce a bias against the areas where the projected number density of 24m sources is higher. Our random distribution of sources in the real m map allows for checking the effect of the “local” confusion noise on source detections. We find that the recovery rate decreases with the increase of projected 24m source density ()181818For a given galaxy of interest, the source density, , is defined as the number of 24m sources within a 20″radius. . As shown in Figure 4 (right), for a galaxy at with =10 mJy, the probability that the source with is detected in the ratio map is 60%, while it decreases to less than 40% in regions where there are more than six 24m sources within a radius of 20″. Correcting for such bias, the detection efficiency would be higher. Visual inspection of source spatial distribution suggests that sources appear to be found in areas where the projected 24m source density is relatively low. Note that sources which are significantly fainter than their close neighbours in the SPIRE/500m would not pass our S/N selection. There are (rare) ULIRGs detected at submm and/or mm that are too faint to be detected in the SPIRE data, such as the one at (HDF850.1, Walter et al. 2012). Such sources would not be selected by our method and hence would be missing from our sample. In addition, our minimum S/N requirement in detecting sources in the ratio map discriminates against galaxies with M82-like SED unless they are at (Figure 1).
2.3.2 Counterpart Identification
We describe in this Section the procedure used to attribute shorter-wavelength counterparts to the Herschel 500m sources detected in the / ratio map. It is important to note that the use of this ratio map constructed from a list of 24m sources does not preclude the identification of 500m sources with no 24m counterparts. Such sources will naturally emerge as objects with a high ratio. In the following, we show how probabilities of association are determined for potential 24m counterparts. We also define a quantitative threshold below which no 24m counterpart is considered reliable, hence identifying 24m dropouts. Once a source was detected in the ratio map, we searched for potential counterparts in the higher-resolution 24m image out to a radius of 15 arcsec from the centroid. The search radius was determined from our simulations (Section 2.3.1), where we found that for more than 90 per cent of sources, the extracted positions are less than 15 arcsec from the input positions, i.e., the probability of missing potential counterparts is less than 10 per cent191919This search radius also represents a 2 positional uncertainty, with FWHM/(S/N) (Ivison et al. 2007), where FWHM = 36 arcsec, for a detection in the 500m map with S/N=3.. Note that at the extreme depth reached by the 24m imaging reported here, the cumulative surface density of 24m sources yields 1-8 sources per search area with a median of 3 sources. For larger radii, one will find more counterparts but the probability of chance associations will also increase.
The primary method for identifying the most likely counterparts to each 500m source is ‘-statistics’ ( Downes et al. 1986), by calculating the Poissonian probability of sources in a high-resolution catalog (24m and/or radio) that lie within the search radius, . Given a potential counterpart with flux density in the high-resolution imaging, the probability of finding at least one object within of at least that flux density is exp, where is the surface density of sources above flux density . gives the likelihood that a 500m source is associated with a counterpart in a higher-resolution map by chance. The lower the -value, the less likely it is that the candidate is associated with a 500m source by chance, and the higher the probability of a genuine match. However, as has been pointed out in the literature (e.g., Yun et al. 2012), the often adopted high-resolution 24m or radio continuum data for the counterpart identification may suffer from a systematic bias against high- sources. Since the main goal of the ratio map is to favor higher- sources which have statistically higher / ratios, we replace the surface density of in the computation of -value by to take into account the redshift information. For a given counterpart, is the surface density of objects brighter than which have redshifts above . This means that in a catalog that is cut at flux density for a given counterpart, we considered only those with redshifts above in calculating the probability of it being a chance association.
Unlike what happens at shorter wavelengths, the best counterpart for a 500m detection is not the brightest 24m prior but instead results from a combination of source luminosity and redshift. To account for this, For a given potential 24m counterpart, we do not use the number density of sources above flux at the 24m in calculating the Poissonian probability of chance associations, but of 24m counterparts brighter than a “predicted” 500m flux density, . This is obviously only possible in a field such as GOODS-North with a high redshift completeness. To estimate for each 24m counterpart and then determine a density criterion based on it, we assume a characteristic 500/24m flux density ratio that depends on redshift following the trend shown with a dashed line in Figure 1. Such a redshift dependence of the 500/24m color represents the evolutionary trend of mean / ratio of CE01 SEDs. Since high-redshift 500m sources are expected to present a larger / ratio and hence a higher probability of being detected in the ratio map, this procedure will naturally select the corresponding 24m sources as potential counterparts and reduce the probability of chance associations with lower-redshift sources. However, one has to treat this statistic with caution, as we assumed that lower- galaxies with abnormal IR SEDs that would have similarly high / ratios are rare (e.g., Rowan-Robinson et al. 2010). We will comment on later in this paper, 17 per cent of identifications might be due to the contaminations from some of the lower- populations. Note that using the observed 500m flux to predict 24m flux is an alternative way to identify counterparts, but maybe problematic (regardless of the uncertainty in choosing IR SEDs), since without a perfect knowledge of priors, the precise measurements of the 500m flux are impossible due to the effect of blending, resulting in the predictions of 24m flux with high uncertainty.
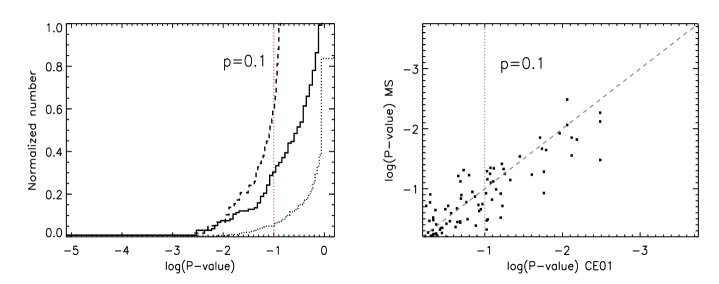
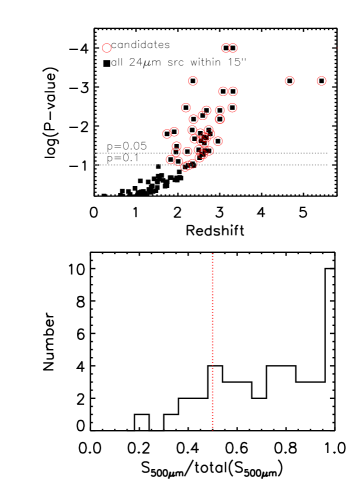
In order to define a threshold for our modified -value calculated for the 24m catalog, , that will correspond to a realistic association probability, we use the realistic mock Herschel data that are described in detail in Schreiber et al. (2015). We construct a / map for the mock Herschel data and detect candidate high- sources using the same procedure as we described above. In Figure 5 (upper), we plot the -statistics calculated using the formulation above, against the redshifts for all input 24m sources within the search radius (filled squares). We found that at a threshold of , 90% sources detected in the ratio map would have at least one 24m counterpart at (red circles), and no source below has a -value greater than 0.1. Figure 5 (lower) shows the distribution of the ratio of 500m flux of candidate counterparts () to the total 500m flux of all 24m sources within the search radius. This ratio provides a measure of the importance, in terms of 500m flux, of the identifications. A ratio close to 1 indicates that the 500m emission is dominated by a single (high-) 24m counterpart. Only 14% (6/42) 500m sources detected in the ratio map have more than one 24m galaxy with additional source(s) contributing up to % of the total 500m flux, and five of them in fact have multiple counterparts. Therefore 86% (36/42) of the 500m sources have been associated with a single source, which is main contribution to the 500m emission (50%), suggesting a high efficiency of the identifications.
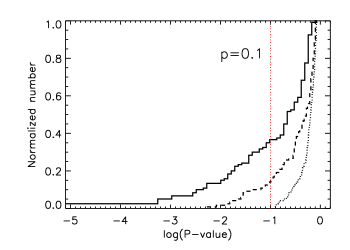
In Figure 6, we plot the cumulative distribution of our modified -values when taking into account the redshift information for all 24m counterparts within the search radius (solid line). Also shown is the distribution of the traditional -values which were calculated using only the 24m flux, as often adopted in literature (dotted line). Based on the resulted Poisson probabilities, almost none of the associations would be judged to be significant at 90% confidence (i.e., ). Using the predicted 500m flux instead (dashed line) would result in slightly more sources with , but still not statistically high enough to quantify the formal significance of the identifications.
2.3.3 Validation of the method with SCUBA2
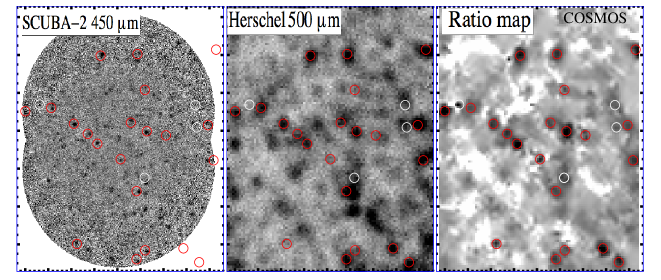
In order to further test our method and its efficiency in uncovering candidates of high- Herschel 500m sources, we build a / map using the data from the COSMOS field for which we have a SCUBA-2 450m image for direct comparison. The higher resolution of SCUBA-2 (7.5″ FWHM, Geach et al. 2013) at 450m, compared to 36″ at 500m, offers a unique opportunity to assess the reliability of the high- 500m sources identified using our / method. Figure 7 shows the SCUBA-2 450m image of the COSMOS field (left). The corresponding Herschel 500m image of similar size is shown in the middle. On the right, we show the Herschel 500m to 24m flux ratio map, overlaid with detected sources (red circles) using the same search criteria as described in Section 2.1. It can be seen that many bright 500m sources in the actual map (middle) disappear in the / map. This is likely due to the fact that many of them are dominated by low- galaxies where the / ratios are low. Conversely, while some sources appear relatively faint and undetectable in the actual 500m map (close to the confusion limit 6mJy), they are more unambiguously seen in the ratio map (e.g., the last two panels in Figure 9). These fainter 500m sources are in fact clearly seen in the deeper SCUBA-2 450m imaging (rms2.5-4.0 mJy/beam) of COSMOS.
When compared to the field covered by the SCUBA-2 450m map, a total of 22 sources are detected in the ratio map, and 18 of them have 450m counterparts within 15″. For the remaining four sources without SCUBA-2 counterparts, three are located close to the edge of the SCUBA-2 map where the local noise level is relatively high (white circles in Figure 7). We also checked the positional offsets between the sources identified in the ratio map and the SCUBA-2 450m sources. We found that the positional offsets for most sources are less than 10″. Considering the SCUBA-2 beam size of 7″ which is close to the pixel size of Herschel 500m map (7.2″), this strongly suggests a physical association between the sources detected in the ratio map and those in the SCUBA-2 map.
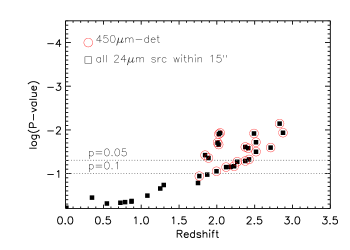
With the same -statistics and cut (), we present in Figure 8 the counterpart identifications to high- 500m sources in the COSMOS field, where the higher resolution SCUBA-2 450m imaging allows for more precisely localizing the 24m counterparts. We found a similar trend of -value against redshift as in Figure 5 . At a -value cut of , most, if not all, 500m sources detected in the ratio map have at least one 24m counterpart at 2. Most high- 500m sources that we identified are also detected in the SCUBA-2 450m image with positions coincident with the 24m counterpart, suggesting a low probability for chance associations. These results further support the reliability of our approach for counterpart identification. We therefore adopt a cut on the Poisson probabilities of for the counterpart identifications to our sample.
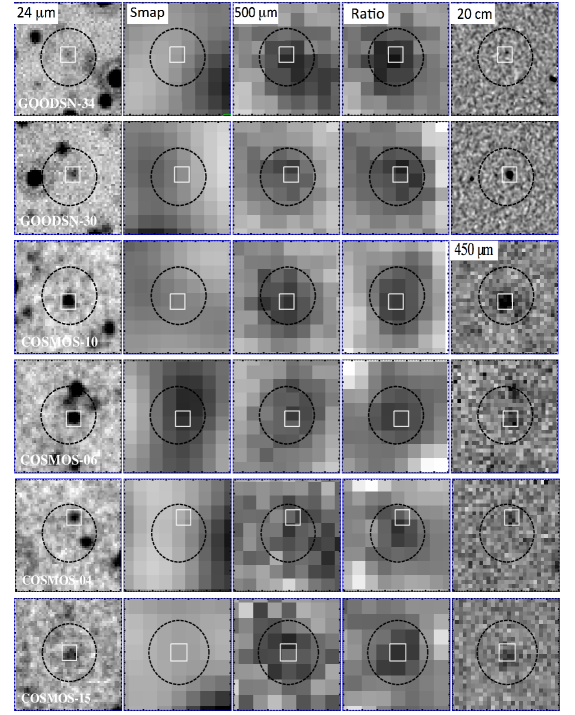
In Figure 9, we show examples of the identifications of two relatively clean sources from our catalog where the blending effect is small, as well as four sources in the COSMOS field. Though they could be also identified in the original 500m map, this demonstrates that the detection in the ratio map is without any doubt coincident with a high-z source: one is spectroscopically confirmed at and another has a photometric redshift at . Further support comes from the comparison with the SCUBA2 data at the 450m, showing that candidate high- 500m sources have been unambiguously identified.
In order to considering alternative counterparts for the few sources with no 24m counterpart, which may be an IRAC source with a predicted 500m flux density greater than the one associated with the 24m counterparts, we in fact considered two extrapolations of , the one derived from the observed 24m and the one derived from star-formation main-sequence relation (Column 8 in Table 1). The latter approach is based on redshift and stellar mass measurements, associating an SFR to each IRAC source using the main-sequence relation (Schreiber et al. 2015). The SFR was converted into a total IR luminosity using the Kennicutt (1998) relation202020 We used a mass-dependent dust extinction, i.e., IR excess IRX = , to decompose the SFR into a dust-obscured component seen in the FIR and a dust-free component which emerges in the UV (e.g., Heinis et al. 2014). . We then assigned a favorable CE01 SED to each galaxy based on the IR luminosity to predict . We used the UVJ selection technique (Whitaker et al. 2012) to isolated passive galaxies and excluded them from the counterpart catalog. Although the main-sequence approach provides only a lower limit to SFR and hence estimate of , it will help to discriminate against candidates of high passive galaxies which are undetected at 24m. Note that 500m detections that do not present 24m counterparts fulfilling the -value criterion will therefore be considered as 24m dropouts.
Using the above procedure, we have found at least one 24m counterpart for 28 (out of 36) sources detected in the ratio map (Table 1). In eight cases where no such counterparts can be found, we first proceed to search in the IRAC 3.6m catalog using the same radius and value cut. This results in two further identifications in the IRAC band (GH500.01 and GH500.15). For the remaining six sources, we used the radio data for counterpart identifications. Out of a total of 36 sources, seven have more than one potential 24m counterpart, and seven are found to have additional counterpart(s) from the IRAC identifications. Such multiple statistical associations could be partly due to the source clustering at similar redshifts (e.g., GH500.26, GH500.27). Therefore, a unique counterpart is identifiable in about 60 per cent of the cases, while two or more candidates are present in others. For the latter case, we choose the one(s) detected in the radio (if available) as the most probable counterpart for further analysis (Table 2)212121For GH500.08, we choose the one of not being detected in the radio as best counterpart (see Appendix A.).. Candidate and radio counterparts and their computed -statistics222222 In computing the -statistics for the radio catalogue, we used the nominal method without taking into account the redshift information (e.g., Pope et al. 2006). are given in Table 1.
We note that some bright silicate absorption galaxies at and which have depressed 24m emission (Magdis et al. 2011), may have elevated / ratios meeting our selection criteria. By inspecting the photometric redshift and far-IR SED, we found one such lower- galaxy (GH500.06) that may coincidently have a large / ratio and we excluded it from our sample. In addition, there are five sources at redshifts less than (GH500.03, GH500.11, GH500.22, GH500.24, GH500.36), among which three are spectroscopically confirmed at , and , and another two has a photometric redshift of and , respectively. As we are mainly interested in the population of Herschel 500m sources, we exclude them from the following analysis.
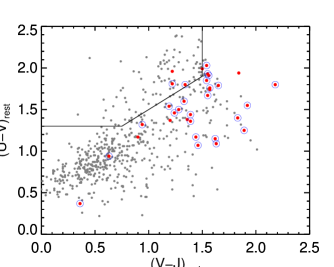
For the remaining 35 sources (including four with more than one candidate counterpart), we provide the coordinates, photometric redshift (or spectroscopic redshift if available), mid-IR to radio flux densities, and the derived far-IR 8–1000m luminosity and dust temperature in Table 2. Their distribution in the rest-frame (U-V) vs. (V-J) color digram is shown in Figure 10. It can be seen that most objects (32/36, 90%) can be classified as dusty starburst galaxies (Whitaker et al. 2012), consistent with their high dust attenuation of 2 mag inferred from the UV-MIR SED fittings. We note that there are two sources (GH500.10a and GH500.25) falling into the regime for quiescent galaxies. However, both are significantly detected in the Herschel PACS 160m ( mJy, Table 2), suggesting the presence of ongoing obscured star-formation. The possibility of wrong identifications seems low, as both are relatively isolated and well detected in the 24m and radio. Since the two sources have relatively high photometric redshift at where the UVJ selection is still poorly explored (e.g., Straatman et al. 2013), whether they can be considered quenched remains further investigations. Indeed, their specific SFRs (8-40/yr) are already 2x higher than the sSFR= /yr of similarly massive star-forming galaxies at 3 (Schreiber et al. 2015).
The Herschel/SPIRE fluxes are from the GOODS-Herschel catalog (Elbaz et al. 2011), or derived from point-spread function (PSF) fitting using GALFIT (Peng et al. 2002) for cases where the flux could be wrongly attributed to nearby 24m sources due to blending, or is not measured in the catalog. A description of the Herschel/SPIRE flux measurements is presented in Appendix B. Note that due to the poor resolution of the Herschel data, measuring reliable SPIRE flux densities for individual galaxies, especially those at 500m, is a challenging task. The de-blending approach of using 24m data of better resolution would be still affected by the degeneracy between the positions of the sources and flux uncertainties attributed by faint sources. Given the case of heavily blending, the SPIRE flux measurements should be treated with some caution. The thumbnail images for each identified source are presented in Appendix C. Among 14 sources that have two or more candidate radio/24m counterparts, four (GH500.13, GH500.26, GH500.28, GH500.35) have counterparts separated by only 5″or less. Three of these cases are treated as single systems because the counterparts are consistent with being at the same redshift and are assumed to be interacting galaxies. These three sources are so closely separated that deblending the Herschel/SPIRE flux is impossible, hence we report the combined fluxes of the two counterparts in Table 2. For GH500.35, we cannot assess whether the three counterpart galaxies are interacting systems or spatially clustered, and we assume that the source with the brightest 24m flux is the only counterpart, which should be treated with caution.
2.3.4 Contaminants
We have visually inspected all sources which pass our S/N cut in order to search for noise artifacts and blends of bright sources. To check for false detections caused by map noise artifacts and/or from sources well below the nominal “flux” detection limit, we run our search procedure on the / map by removing all individually detected 500m sources in the catalog used in Elbaz et al. (2011). The P(D) plot of the / ratio map omitting all 500m detections in the existing catalog is shown in Figure 3 (red curve). It can be seen that few pixels have values above our S/N cut of /=20.4, suggesting that the contamination from noise artifacts is negligible. Figure 4 (lower panel) shows the number of spurious sources as a function of detection threshold. As one would expect, the number of false detections depends strongly on the chosen S/N threshold. At a 2 cut, the result suggests that two detections will be spurious in our ratio map, corresponding to a spurious source rate of % (2/36). Note that while increasing the S/N requirement would decrease the number of false sources, it would also remove a fraction of real but slightly fainter sources from the map. Therefore, we adopt 2 as the detection S/N cut for sources in the ratio map, because it provides a good compromise between the catalogue size and source reliability.
The above estimate, however, provides only an lower limit to the number of contaminants. As shown in Figure 1, the diversity in IR SED of galaxies means that lower redshift sources would have probabilities of being detected in the ratio map if they have similarly high / ratios, contaminating the selection of sources. We account for this effect statistically by performing simulations to measure the recovery rate for injected low- sources of varying flux density, using the similar procedure described in Section 2.3.1. For each injected source we assumed an IR SED randomly selected from the CE01 libraries to predict its 24m flux density at a given redshift. Note that we didn’t assume any peculiar IR SED for injected sources to avoid bias in detections. Although very “cold” galaxies have more chance of being detected, they are expected rare given the small area covered by GOODS-North. Since lower redshift sources are not expected to be detected in our data except those with abnormal high / ratios, any source recovered in the map would be considered as a contaminant. The average recovery rate for low contaminants as a function of flux density is shown in Figure 4 (lower right panel). It can be seen that sources below 1.2 have a low probability to be detected, but the detection rate increases with redshift above 1.4 due to the increased fraction of sources with higher / ratios. The low contaminants become more significant at higher flux density, making them non-negligible effect in selecting galaxies. In fact, such low sources have been identified in the ratio map. As we mentioned above, we found 6 out of 36 sources at (%) that could be contaminants in our catalog, which is consistent with the simulation result of 20% detection rate at mJy, a median flux for catalog sources.
3. Basic observed source properties
3.1. Redshift distribution
In this section, we present the redshift distribution for our Herschel 500m sources. To derive the redshift distribution, we take spectroscopic redshifts if available, based on optical and/or CO spectroscopic observations (Barger et al. 2008; Daddi et al. 2009a, b), and otherwise photometric redshifts based on a -selected multi-wavelength photometric catalog (Pannella et al. 2015). Spectroscopic redshifts are available for 12 out of the 35 Herschel sources (33%) in the sample. Note that the photo for one source (GH500.15) is not available, as it is not detected in the band. Although SED fittings in the far-IR suggests it likely being at (Section 4), we exclude the source in the following analysis due to the relatively poor constraint on the photo.
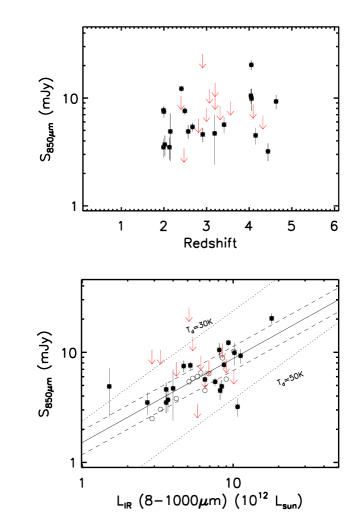
The redshift distribution for the 34 Herschel sources identified from the ratio map is shown in the upper panel of Figure 11. For comparison, we also plot the redshift distribution for SMGs (red) from Chapman et al. (2005). Each distribution is normalized to the total number of sources in the sample. The redshift distribution derived by Chapman et al. (2005) is based on a sample of SMGs drawn from various SCUBA/850m surveys with radio counterparts targeted for spectroscopic redshift follow-ups. It can be seen that the distribution of our /-selected sample is in sharp contrast to that SCUBA/850m SMGs. The median redshift for our sample is =3.07, with a significant fraction of sources (10/34, 29%) at . The radio-identified SCUBA SMGs have a lower median redshift of =2.6 (considering only sources at ), for which only 18% of the population is at . Part of this difference could be due to the identification bias in the sample of Chapman et al. The redshift distribution of SCUBA SMGs includes only sources with robust radio detections; the highest-redshift sources may fall below the depth of radio data and are likely to be missed. On the other hand, the sample considered here is confined to 500m sources significantly detected in the ratio map which efficiently selects sources at the highest redshifts. Lower-redshift submm sources are down-weighted in the ratio map in an effort to obtain a homogenous sample of galaxies at as possible.
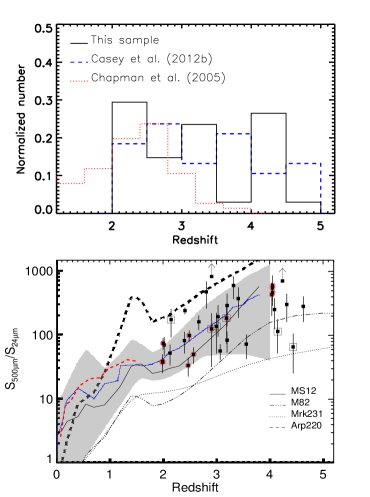
A recently published spectroscopic survey of Herschel /SPIRE sources with optical counterparts determined from high-resolution radio/24m imaging found a population of ULIRGs at (Casey et al., 2012b), and a median redshift of (blue dashed line in Figure 11, upper). It should be noted that this population is only a tail of spectroscopically confirmed Herschel sources in their survey, the majority of them (95%) being at (Casey et al. 2012a). Though the sample of Herschel sources in Casey et al. (2012b) is likely biased towards optically bright population for which spectroscopic identifications are made, the redshift distribution appears similar to that derived from our sample. A Kolmogorov-Smirnov test shows that the probability that both samples are drawn from the same underlying parent distribution is 0.43. Note that while the Casey et al. (2012b) redshift distribution is relatively flat from z=2 to 5, our sample shows a tentative excess at . This could be due to cosmic variance, since our sample probes a small volume in a single field, while the Casey et al. data cover several deep fields over a much larger (5 times) sky area232323Casey et al. (2012b) sample comes from a spectroscopic survey of bright SPIRE sources (10-12 mJy) in four HerMES legacy fields, including the Lockman Hole, COSMOS, ELAIS-N1 and ECDFS (see their Table 1).. In fact, Daddi et al. (2009b) have reported a proto-cluster structure at in the GOODS-North field (see their Figure 13) which includes three CO-detected SMGs within 25″ at the same redshift.
Using a / ratio method, we find 10 Herschel 500m sources at in the GOODS-North field, corresponding to % of the whole sample. Eight of these candidates have mJy. This suggests significantly more ULIRGs at the highest-redshift end compared to other surveys (e.g., Smolčić et al. 2012 and references therein). This will enrich our understanding of obscured star formation in the early Universe. Excluding four spectroscopically confirmed sources at the same redshift which are likely associated with a protocluster at (Daddi et al. 2009a, b), we can place a lower limit on the surface density of ULIRGs at deg-2. This value is more than an order of magnitude higher than what is expected in cosmological models (Baugh et al. 2005; Swinbank et al. 2008; Coppin et al. 2009; Béthermin et al. 2012). However, given the very small area covered by GOODS-N and lack of the spectroscopic confirmation for most candidates, these values should be taken with caution. A complete view of the properties of the ULIRG population will require a detailed submm follow-up and robustly determined redshifts. Notably, recent ALMA follow-up of a bright sample of lensed SMGs discovered with the SPT yielded at least 10 spectroscopically confirmed sources at (Vieira et al. 2013; Weiß et al. 2013), challenging the current models for galaxy formation and evolution.
In Figure 11 (lower panel), we show the measured / ratio (Table 2) for each of our sources as a function of redshift, along with the various model SED predictions. The / ratios of our galaxies are all over 30, and are in good agreement with the dusty SEDs allowed by current models, albeit with a large scatter. The large / ratios therefore support the expectation that most sources, if not all, in our sample are indeed at . In the next section, we will investigate the far-IR properties of individual galaxies.
3.2. Infrared luminosities and dust properties
To derive the far-IR emission and SED characteristics of the sample, we fit the photometry with a library of galaxy templates including CE01 and the well-studied SEDs of the local starburst M82, the ULIRG Arp220 and the dusty AGN Mrk231. The SEDs for the latter three local galaxies are taken from the SWIRE template library (Polletta et al. 2007). Our library consists of a total of 108 templates with characteristic dust temperatures () in the range K. The SED fitting results are shown in Figure D1 in the Appendix, and their infrared luminosities and dust temperatures are given in Table 1.
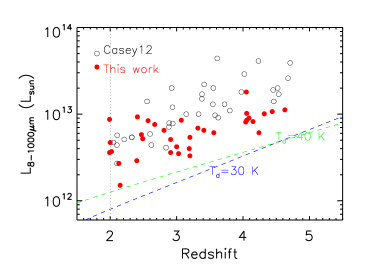
We compute the infrared luminosity of each source by integrating the best-fit SED between rest-frame 8 and 1000m. The luminosities for this sample range from 1.5L⊙, implying infrared SFRs of 260–3100 M⊙ yr-1with a Salpeter IMF. Note that the IR luminosities can be determined to less than 50% accuracy when excluding SPIRE 350 and 500m measurements for 60 per cent of sources where the data at longer wavelengths (500m ) are available. This suggests that they are among the most extreme star-forming galaxies seen in the early Universe (e.g., Casey et al. 2014 and references therein). Figure 12 shows the infrared luminosity against redshift (filled red circles). The distribution of the Casey et al. (2012b) spectroscopically confirmed sample of SPIRE sources is shown for comparison (open circles). Our /–selected population and the Casey et al. (2012b) sample each probe different regions of parameter space. Though the redshift distribution is similar (Section 3.1), our sources are systematically lower in luminosity by dex at a fixed redshift. While the Casey et al. (2012b) sample may not be representative of all high- 500m sources due to their selection of brighter objects for spectroscopy follow-ups, our selection is offering a unique probe of intrinsically fainter objects, which is important for a complete view of the properties of the Herschel population. Note that, as we mentioned above, it is important to understand the different volumes probed for a more meaningful comparison of the typical luminosities in the two samples.
The dust temperature is derived using the code of Casey (2012), which fits the far-IR photometry with an SED consisting of a modified blackbody spectrum and a power-law component in the mid-IR portion (m ). The combination of a greybody and mid-IR power-law takes into account both galaxy-wide cold dust emission and smaller-scale warm dust emission (e.g., Kovács et al. 2006; Casey 2012). To reduce the number of free parameters, we fix the slope of the mid-IR power-law to for sources which are not detected in PACS. In addition, the emissivity index of the blackbody spectrum on the Rayleigh-Jeans portion is fixed to (a commonly chosen value of in the literature, e.g., Chapman et al. 2005; Pope et al. 2005; Younger et al. 2009), since we have not enough data points at longer wavelengths (850m ) to constrain in a meaningful way. However, we note that there is very little change in the derived by fixing within the range of .
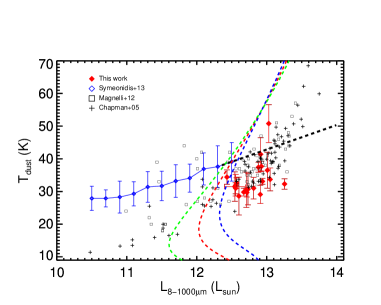
We present in Figure 13 the dust temperature against infrared luminosity for the sources in our sample which have a meaningful constraint on the dust temperature from the submm and/or mm measurements. We include in the comparison the measurements for SCUBA SMGs from Chapman et al. (2005) as well as the SPIRE galaxies from Symeonidis et al. (2013), which appear to closely follow the relation that the dust temperature increases with infrared luminosity, as observed in the local IRAS 60m-selected sample (e.g., Chapman et al. 2003). To examine whether our high- sample has temperatures similar to those of local samples and at , we divided our sample into two bins of with roughly equal numbers of sources: 12.2log10(/L⊙)12.8 and 12.8log10(/L⊙)13.4. The derived median temperatures and luminosities are and 36.5 K for and 8.7L⊙, respectively. As Figure 13 shows, at a fixed luminosity the high- galaxies in our sample tend to have cooler dust temperatures (K) compared to that expected from the relation of SPIRE galaxies (Symeonidis et al. 2013). This could be partially due to the selection in the 500m band, which is biased against the warmer sources, even at these high redshifts.
By comparing the dust properties between local galaxies () observed with AKARI and galaxies in the redshift range selected by Herschel , Hwang et al. (2010) found modest changes in the relation as a function of redshift. Herschel -selected galaxies appear to be 2-5 K colder than that of AKARI-selected local galaxies with similar luminosities. Such evolution of the relation with redshift has also been reported by the studies of Rex et al. (2010) and Chapin et al. (2011), and recently by Symeonidis et al. (2013) and Swinbank et al. (2014) with a much larger Herschel dataset. The offset in the relation may imply that high- ULIRGs have a weaker average interstellar radiation field than local analogs of a similar luminosity, which could be due to a more extended distribution of dust and gas (e.g., Hwang et al. 2010). However, we note that dust temperatures derived in this work and others in the literature suppose that the emission-weighted sum of all the dust components could be well fitted by a single modified blackbody model. In reality, the far-IR emission of a galaxy results from the combination of a series of blackbodies associated to a temperature distribution depending on a number of factors, including dust emission spectral index, dust grain distribution and geometry (e.g., Casey 2012, Magnelli et al. 2012), that is often summarized by an effective dust temperature associated to the peak emission of the far-IR SED.
3.3. High- Radio/far-IR relation
For the 28 radio-detected sources, we measured the far-IR/radio ratio, , to investigate the far-IR/radio correlation for ULIRGs at . The tightness of the far-IR/radio relation is very useful in many aspects in the study of galaxy evolution, e.g., estimate of the SFR of dusty starbursts in the absence of far-IR data (Condon 1992; Barger et al. 2012), and search for radio-excess AGN (Del Moro et al. 2013). However, controversial results have been obtained in literature studies on the evolution of such relation. Recent studies based on Herschel data claimed a redshift evolution of the correlation (e.g., Ivison et al. 2010a; Casey et al. 2012a, b; Magnelli et al. 2010, 2012, 2014; Thomson et al. 2014). On the contrary, Sargent et al. (2010) showed that, by taking into account the sample selection effect, the far-IR/radio relation is roughly invariant up to redshift , and possibly up to higher redshift (in agreement with Bourne et al. 2011; Barger et al. 2012; Pannella et al. 2014). Both results are inconsistent with the theoretical prediction that this tight relationship should break down at high redshift due to rapid Compton cooling of the relativistic electrons (e.g., Condon 1992).
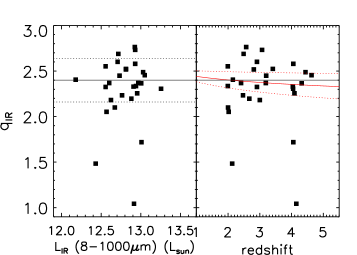
We use the ratio () of rest-frame 8–1000m flux to 1.4 GHz radio flux as defined in Ivison et al. (2010a). The rest-frame radio power was computed assuming and a radio spectral index of (e.g., Thomson et al. 2014). For these radio detected sources, the measured ranges from 1.04 to 2.76 with a median value of 2.37. In Figure 14, we plot the versus (left) their far-IR luminosities and (right) their redshifts. Using the Herschel data in the GOODS North field, Ivison et al. (2010b) performed a stacking analysis of 24m-selected galaxies at , and found a median value of (solid line in Figure 14) and a scatter of 0.24 (dashed lines). Our galaxies have values in good agreement with this range. Only three galaxies (GH500.21, GH500.27c, and GH500.30) in Figure 14 lie off the far-IR/radio correlation. This is likely due to the existence of a strong AGN, which contributes significantly to the radio emission hence lowers the (e.g., Del Moro et al. 2013). This is consistent with the observed excess of 24m emission in GH500.30 (see Figure D1 in the Appendix). We note that our selection is not sensitive to high- AGN, which are expected to be bright at 24m and thus have depressed / ratios unless they are extremely luminous in the far-IR.
Since the radio continuum of galaxies without strong AGN is predominantly produced by supernova remnants from young stellar populations, our results suggest that the far-IR luminosity for high- Herschel sources is dominated by heated dust emission due to star-forming process in massive galaxies, with little contribution from old stars. Parameterizing the evolution in the form , and excluding three galaxies with a strong AGN contribution to the radio emission, we find , which is consistent with no evolution. For comparison, Ivison et al. (2010b) found a slight evolution with (red solid curve with dotted uncertainties). By extending to higher redshifts (out to ) than most other studies, our data suggest no evolution of . This agrees with the recent finding by Pannella et al. (2014), who studied the far-IR/radio correlation up to in a stacking analysis of Herschel data for a mass-selected sample of star-forming galaxies.
4. Discussion
4.1. Misidentified high-redshift sources in the Herschel catalog
The large beam sizes (FWHM20-40″) of the Herschel/SPIRE images mean that obtaining robust multi-wavelength identifications and photometry for SPIRE sources is challenging. Herschel point source photometry is frequently performed by flux extraction at positions of known 24m sources or 1.4 GHz radio sources (e.g., Elbaz et al. 2011; Roseboom et al. 2010, 2012), as these wavelengths have much better resolution (″) and, like Herschel, are good tracers of star-formation activity (e.g., Ivison et al. 2010a). However, this is particularly problematic for high-redshift sources that are faint or undetected in 24m and radio surveys, resulting in ambiguous and/or incorrect counterpart identifications (Roseboom et al. 2010; Yan et al. 2014).
Our map-based approach has the advantage of identifying the correct counterparts to high- Herschel sources which are bright at 500m but relatively faint at 24m. When using 24m priors for a Herschel catalog, if the SPIRE beam contains several blended 24m sources that cannot be deblended, the brightest 24m source is usually chosen as the counterpart. This can lead to misidentifications for high- sources as we show in Figure 15 for the case of GH500.19. Within the 500m beam, there are two closely-separated (10″) 24m sources, one spectroscopically confirmed at and another at , both possibly contributing to the Herschel flux. While the far-IR emission is taken to be associated with the galaxy at , the far-IR SED is inconsistent with the low-redshift solution. At , the fit to the IR photometry has for all the templates in the library, with a minimized (dotted line). In contrast, the best-fitting template at yielded a much lower (red solid line). We therefore conclude that the galaxy is likely to be the true counterpart to the Herschel source, and the low-redshift candidate at is ruled out. Our method correctly identified the object as the counterpart, while in this case the usual radio identification would favor the low-redshift counterpart, which is the brightest radio source within the Herschel beam.
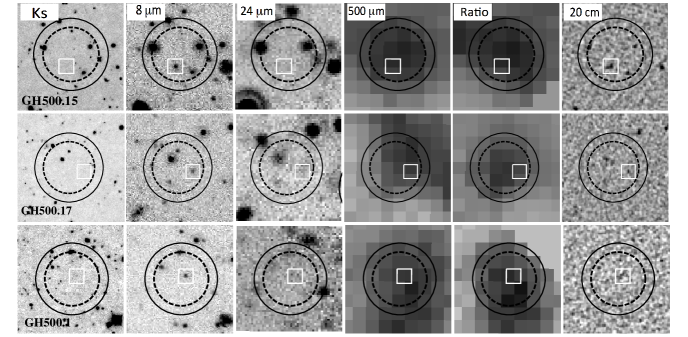
By effectively reducing the confusion from low- sources using the map-based / ratio, we have identified three potential high- 500m sources that are not detected at 24m, of which two are likely to be at . In Figure 16, we present the images in the ground-based band, IRAC 8m, MIPS 24m, Herschel 500m, the / map, and the VLA radio image. There is no 24m source within 5″ of the radio counterpart, while a galaxy is clearly detected by Spitzer in all four IRAC bands. All three sources are relatively faint in the band, and the extremely red colors of , if due to the strong, redshifted Balmer/4000Å break of an evolved stellar population, imply that they are likely at . Indeed, the photometric redshift analysis suggests that two of them are at and respectively. The remaining source, which is not seen at and shorter wavelengths, is a bright submm source (Pope et al. 2006; Perera et al. 2007; Barger et al. 2014). Since there is no photometric redshift available for this galaxy, we fitted its far-IR to radio photometry with a suite of CE01 templates, and found a best-fit redshift of . The high redshifts of 24m-dropout Herschel sources which have properties very similar to the well-studied SMG GN10, if confirmed, would have important implications for galaxy formation and evolution.
To summarize, among 36 unique 500m sources identified in this paper, we find five cases (14%) where the 500m flux is incorrectly associated with a brighter 24m prior in the official Herschel catalog. Three high- 500m sources that are not detected at 24m are revealed in the /map (8%, see Section 4.2). In three further cases, the Herschel 500m flux in the catalog is probably given to nearby sources due to strong source blending (8%). Therefore, using the deepest 24m and 500m imaging in the GOODS-N field, we estimate that at least 20% of dust obscured galaxies in our sample were mis-identified or missed in the current catalog. This missing fraction of high- ULIRGs population should be taken into account in studies of starburst galaxies in the early Universe. Due to the small volume of the GOODS-N field, it is important to apply our method to larger survey fields with comparable depths (e.g. HerMES) to build a statistically significant and more complete sample of Herschel sources. However, detailed, high-resolution submm interferometric follow-ups, e.g., with NOEMA or ALMA, are required to unambiguously identify the correct SPIRE source counterparts, and resolve their multiplicities.
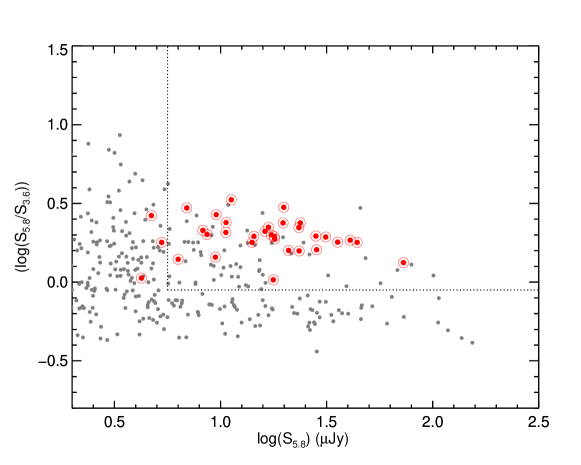
While Herschel is highly sensitive to 1-2 galaxies whose SED peaks in the far-IR, the long-wavelength submm bands (such as 850m and 1mm) are optimized for higher-redshift galaxies. It is thus interesting to compare the Herschel galaxies with submm sources detected by SCUBA (for example). Among our 34 Herschel sources, 20 have been previously reported as SMGs selected at 850m (Pope et al. 2006; Wall et al. 2008), although three are outside of the SCUBA coverage. Therefore, twelve of our sources are not listed in the 850m catalog. In Figure 17, we show the locations of sources with and without 850m detections on the S850μm- and S850μm- planes. We find that there is a correlation between S850μm and , although it is subject to possible selection effects, as submm observations could be biased against galaxies with warm dust temperatures and therefore relatively faint 850m flux densities for the same total luminosity (e.g., Chapman et al. 2010).
Using the best-fitting dust SED, the predicted 850m flux densities (open circles in the lower panel of Figure 17) for our Herschel sample appear to be consistent with the S850μm- relation. These sources have fitted SED dust temperatures in the range of 30–40 K (Table 1), hence their non-detections in 850m cannot be simply attributed to the selection effect. In fact, most of galaxies which have not been detected in 850m lie at the edge of GOODS-North field where the local noise level of SCUBA map is relatively high (e.g., Pope et al. 2006). The median noise value for the non-detections is 3.1 mJy, compared to the 0.9 mJy for those detected by SCUBA in our sample. As illustrated in Figure 17 (lower panel), most of the non-detections could be due to the relatively low S/N given their expected 850m flux densities. More sensitive submm imaging of the GOODS-North field, e.g. from SCUBA-2 (Geach et al. 2013), may detect the 850m emission in these high- Herschel sources and enable a more detailed study of their dust properties.
4.2. Implications for Star-formation-rate density
The star-formation-rate density (SFRD) represents the total star formation occurring per unit comoving volume. The importance of ULIRGs to the buildup of stellar mass can be determined by comparing their SFRD contribution to other galaxy populations (i.e. UV-selected). This is particularly important for understanding the role of dust obscuration at high redshifts. At lower redshifts (), ULIRGs are rare and their contribution to the SFRD is negligible. However, the importance of ULIRGs grows towards , where they could contribute half of the total SFRD (e.g., Le Floc’h et al. 2005; Magnelli et al. 2013). At , the contribution of ULIRGs to the SFRD is highly uncertain due to their limited numbers (Chapman et al. 2005; Wardlow et al. 2011; Michałowski et al. 2010a). Our Herschel sample therefore provides an important opportunity to investigate the SFRD contribution from the high- ULIRG population.
To estimate the contribution of our Herschel sources to the cosmic SFRD, we used the Kennicutt (1998) relation to convert the far-IR (8-1000m ) luminosity into a dust-obscured SFR, assuming a non-evolving Salpeter IMF (Section 3.2). We split the individual SFR measurements into two redshift bins: and with 18 sources in the former and 16 in the latter. The SFRD in each redshift bin was measured by dividing the SFR of each galaxy in that bin by the comoving volume and summing them. We correct this number by the ratio for each individual source, where is the maximum accessible volume within which a source could reside and still be detectable by our survey. is calculated using the survey area of GOODS-North and the luminosity detection limit which is determined by setting a flux limit of 9 mJy at 500m ( detection threshold, Elbaz et al. 2011).
We note that the SFRs of individual sources could be affected by gravitational lensing, which would make the observed IR luminosities artificially large, thus overestimate the SFRs. The probability of lensing as a function of 500m flux density (see Wardlow et al. 2013, Figure 9) suggests that galaxies with mJy have a low probability of being lensed by a factor of . Wardlow et al. (2013) also show that there is little dependence of the conditional magnification probability on redshift at . Note that the brightest source in our sample (GN500.19, also known as GN20) has mJy, and only three sources are above 30 mJy (see Table 1). For the median value of mJy for SPIRE sources in this sample, the predicted lensed factor would be less than 2. Therefore, the gravitational lensing effect (if there is any) would not change significantly the Herschel source contribution to the SFRD. Source clustering can boost the flux at the 500m by 20% on average (Schreiber et al. 2015), but since such clustering only affects sources at the same redshift, it does not change our SFRD estimation for the given redshift bin.
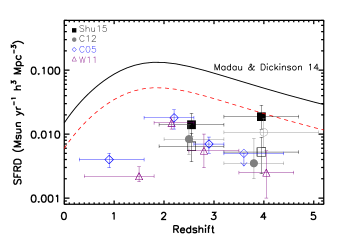
The contribution of our sample to the SFRD is shown in Figure 18 as black filled squares. We compare our results with previous works based on the SMG samples of Chapman et al. (2005, blue diamonds) and Wardlow et al. (2011, purple triangles). Using our new technique to explore the dusty, high-redshift star-forming galaxies seen by Herschel, we recover more of the obscured cosmic star formation as shown in Figure 18. In particular, we observe an increase of the ULIRGs’ contribution to the SFRD from to (filled squares). Note that Casey et al. (2012b) found a similar increase in the SFRD contribution from their SPIRE–selected galaxies (open circle in their Figure 9), when taking into account the sources with less confident spectroscopic redshifts in the bin . The results imply that extremely dusty starbursts may contribute significantly to the build-up of stellar mass in the early Universe (about 40% of extinction-corrected UV samples, e.g., Madau & Dickinson 2014)242424Our SFRD is strictly a lower limit to the contribution from the overall ULIRG population, since we have not corrected for incompleteness in the sample.. This result may be affected by cosmic variance in the GOODS-North field where the number of high- ULIRGs is systematically high compared to other surveys (Section 3.1). Conversely, if we consider only the spectroscopically-confirmed subsample, the SFRD contribution of our Herschel–selected ULIRGs (open squares) is similar to that of SMGs, which peaks at . Future spectroscopic observations of the other candidates in our sample, in particular those at , are therefore required to more robustly constrain their SFRD contribution, and to understand the importance of dust-obscured star-forming activity in ULIRGs in the first few Gyr of the Universe.
5. Conclusions
In this paper we present a new, map-based method to select candidate ULIRGs using the / color. Our approach offers a relatively unbiased search for ULIRGs at , and recovers a fraction of 500m sources which would otherwise be misidentified and/or missed due to incorrect 24m counterpart associations or non-detections at 24m. We provide a catalog of 34 dusty galaxies (all ULIRGs) uniformly selected in the GOODS-North field, and the main results are as follows:
-
•
From a combination of spectroscopic (comprising 34% of the sample) and photometric redshifts, we found that our Herschel–selected galaxies have a median redshift of and 10 of them are at . The redshift distribution is different from that of the SCUBA 850m-selected SMGs (5 mJy), but is consistent with SPIRE–selected galaxies between from the spectroscopic survey of Casey et al. (2012b), though the latter sample has IR luminosities systematically higher by dex on average. The observed / colors are in agreement with the dusty SEDs allowed for normal low- star-forming galaxies, albeit with a large scatter.
-
•
We observe a correlation between dust temperature and infrared luminosity. The median far-IR luminosity is L⊙, which corresponds to a median SFR M⊙ yr-1, with a range of M⊙ yr-1 (assuming a Salpeter IMF). The median dust temperature is K. In comparison with Herschel-selected galaxies from Symeonidis et al. (2013), we find that at a fixed luminosity, our sample has cooler dust temperatures than that extrapolated from the relation at , which may be attributed to the more extended gas and dust distribution in the high- ULIRGs. The result could also be partially explained by the selection at 500m, even at these high-redshifts, which biases towards galaxies with colder dust temperatures for a fixed luminosity.
-
•
The radio-detected subset of our sample (28/34, excluding three likely strong AGN) follows the far-IR/radio correlation from previous work (Ivison et al. 2010a, b) with a median value of =2.37. The result is consistent with no evolution of the correlation with redshift out to .
-
•
By splitting the sample into two redshift bins ( and ), we find that the contribution from our sample to the overall SFRD at is comparable to 850-selected SMGs and Herschel/SPIRE-selected ULIRGs. However, in the higher-redshift bin (), the SFRD contribution of our sample appears to be a factor of higher than that of SMGs, and is about 40% of that of UV-selected star-forming galaxies. We caution that this result may be affected by cosmic variance and apparent overdensity of ULIRGs in the GOODS-North field. Future exploration of the ULIRGs population in larger survey fields and spectroscopic follow-ups will be crucial to set more robust constraints on their contribution to the cosmic SFRD.
References
- Barger et al. (2008) Barger, A. J., Cowie, L. L., & Wang, W.-H. 2008, ApJ, 689, 687
- Barger et al. (2012) Barger, A. J., Wang, W.-H., Cowie, L. L., et al. 2012, ApJ, 761, 89
- Barger et al. (2014) Barger, A. J., Cowie, L. L., Chen, C.-C., et al. 2014, ApJ, 784, 9
- Baugh et al. (2005) Baugh, C. M., Lacey, C. G., Frenk, C. S., et al. 2005, MNRAS, 356, 1191
- Bertin & Arnouts (1996) Bertin, E., & Arnouts, S. 1996, A&AS, 117, 393
- Béthermin et al. (2012) Béthermin, M., Daddi, E., Magdis, G., et al. 2012, ApJ, 757, L23
- Biggs et al. (2011) Biggs, A. D., Ivison, R. J., Ibar, E., et al. 2011, MNRAS, 413, 2314
- Borys et al. (2003) Borys, C., Chapman, S., Halpern, M., & Scott, D. 2003, MNRAS, 344, 385
- Bourne et al. (2011) Bourne, N., Dunne, L., Ivison, R. J., et al. 2011, MNRAS, 410, 1155
- Capak et al. (2011) Capak, P. L., Riechers, D., Scoville, N. Z., et al. 2011, Nature, 470, 233
- Casey et al. (2009) Casey, C. M., Chapman, S. C., Beswick, R. J., et al. 2009, MNRAS, 399, 121
- Casey (2012) Casey, C. M. 2012, MNRAS, 425, 3094
- Casey et al. (2012a) Casey, C. M., Berta, S., Béthermin, M., et al. 2012a, ApJ, 761, 139
- Casey et al. (2012b) Casey, C. M., Berta, S., Béthermin, M., et al. 2012b, ApJ, 761, 140
- Casey et al. (2013) Casey, C. M., Chen, C.-C., Cowie, L. L., et al. 2013, MNRAS, 436, 1919
- Casey et al. (2014) Casey, C. M., Narayanan, D., & Cooray, A. 2014, Phys. Rep., 541, 45
- Chapin et al. (2009) Chapin, E. L., Pope, A., Scott, D., et al. 2009, MNRAS, 398, 1793
- Chapman et al. (2003) Chapman, S. C. et al. 2003, ApJ, 588, 186
- Chapman et al. (2005) Chapman, S. C. et al. 2005, ApJ, 622, 772
- Chapman et al. (2010) Chapman, S. C. et al. 2010, MNRAS, 409, L13
- Chary & Elbaz (2001) Chary, R. and Elbaz, D. 2001, ApJ, 556, 562
- Condon (1992) Condon, J. J. 1992, ARA&A, 30, 575
- Coppin et al. (2009) Coppin, K. E. K., Smail, I., Alexander, D. M., et al. 2009, MNRAS, 395, 1905
- Daddi et al. (2009) Daddi, E., Dannerbauer, H., Krips, M., et al. 2009a, ApJ, 695, L176
- Daddi et al. (2009) Daddi, E., Dannerbauer, H., Stern, D., et al. 2009b, ApJ, 694, 1517
- Del Moro et al. (2013) Del Moro, A., Alexander, D. M., Mullaney, J. R., et al. 2013, A&A, 549, AA59
- Dekel et al. (2009) Dekel, A., Birnboim, Y., Engel, G., et al. 2009, Nature, 457, 451
- Dowell et al. (2014) Dowell, C. D., Conley, A., Glenn, J., et al. 2014, ApJ, 780, 75
- Downes et al. (1986) Downes, A. J. B., Peacock, J. A., Savage, A., & Carrie, D. R. 1986, MNRAS, 218, 31
- Elbaz et al. (2010) Elbaz, D., Hwang, H. S., Magnelli, B., et al. 2010, A&A, 518, L29
- Elbaz et al. (2011) Elbaz, D. et al. 2011, A&A, 533, A119
- Geach et al. (2013) Geach, J. E., Chapin, E. L., Coppin, K. E. K., et al. 2013, MNRAS, 432, 53
- Greve et al. (2008) Greve, T. R., Pope, A., Scott, D., et al. 2008, MNRAS, 389, 1489
- Heinis et al. (2014) Heinis, S., Buat, V., Béthermin, M., et al. 2014, MNRAS, 437, 1268
- Huang et al. (2014) Huang, J.-S., Rigopoulou, D., Magdis, G., et al. 2014, ApJ, 784, 52
- Hwang et al. (2010) Hwang, H. S., Elbaz, D., Magdis, G., et al. 2010, MNRAS, 409, 75
- Ivison et al. (2010) Ivison, R. J. et al. 2010a, MNRAS, 402, 245
- Ivison et al. (2007) Ivison, R. J. et al. 2007, ApJ, 660, L77
- Ivison et al. (2010) Ivison, R. J. et al. 2010b, A&A, 518, L31
- Kartaltepe et al. (2012) Kartaltepe, J. S., Dickinson, M., Alexander, D. M., et al. 2012, ApJ, 757, 23
- Kennicutt (1998) Kennicutt, Jr., R. C. 1998, ApJ, 498, 541
- Koprowski et al. (2014) Koprowski, M. P., Dunlop, J. S., Michałowski, M. J., Cirasuolo, M., & Bowler, R. A. A. 2014, MNRAS, 444, 117
- Kovács et al. (2006) Kovács, A., Chapman, S. C., Dowell, C. D., et al. 2006, ApJ, 650, 592
- Lagache et al. (2005) Lagache, G., Puget, J.-L., & Dole, H. 2005, ARA&A, 43, 727
- Leiton et al. (2015) Leiton, R., Elbaz, D., Okumura, K., et al. 2015, arXiv:1503.05779
- Le Floc’h et al. (2009) Le Floc’h, E., Aussel, H., Ilbert, O., et al. 2009, ApJ, 703, 222
- Lutz (2014) Lutz, D. 2014, ARA&A, 52, 373
- Madau & Dickinson (2014) Madau, P., & Dickinson, M. 2014, ARA&A, 52, 415
- Magdis et al. (2010) Magdis, G. E., Elbaz, D., Hwang, H. S., et al. 2010, MNRAS, 409, 22
- Magdis et al. (2011) Magdis, G. E., Elbaz, D., Dickinson, M., et al. 2011, A&A, 534, A15
- Magdis et al. (2012) Magdis, G. E., Daddi, E., Béthermin, M., et al. 2012, ApJ, 760, 6
- Magnelli et al. (2009) Magnelli, B., Elbaz, D., Chary, R. R., et al. 2009, A&A, 496, 57
- Magnelli et al. (2012) Magnelli, B. et al. 2012, A&A, 539(155).
- Magnelli et al. (2010) Magnelli, B., Lutz, D., Berta, S., et al. 2010, A&A, 518, L28
- Magnelli et al. (2013) Magnelli, B., Popesso, P., Berta, S., et al. 2013, A&A, 553, A132
- Magnelli et al. (2014) Magnelli, B., Ivison, R. J., Lutz, D., et al. 2014, arXiv:1410.7412
- Michałowski et al. (2010) Michałowski, M., Hjorth, J., & Watson, D. 2010a, A&A, 514, A67
- Michałowski et al. (2010) Michałowski, M. J., Watson, D., & Hjorth, J. 2010b, ApJ, 712, 942
- Michałowski et al. (2012) Michałowski, M. J., Dunlop, J. S., Ivison, R. J., et al. 2012, MNRAS, 426, 1845
- Miettinen al. (2015) Miettinen, O., Smolčić, V., Novak, M., et al. 2015, A&A, 577, A29
- Morrison et al. (2010) Morrison, G. E., Owen, F. N., Dickinson, M., Ivison, R. J., & Ibar, E. 2010, ApJS, 188, 178
- Nguyen et al. (2010) Nguyen, H. T., Schulz, B., Levenson, L., et al. 2010, A&A, 518, L5
- Oliver et al. (2012) Oliver, S. J., Bock, J., Altieri, B., et al. 2012, MNRAS, 424, 1614
- Pannella et al. (2014) Pannella, M., Elbaz, D., Daddi, E., et al. 2014, ApJ, 807, 141
- Peng et al. (2002) Peng, C. Y., Ho, L. C., Impey, C. D., & Rix, H.-W. 2002, AJ, 124, 266
- Perera et al. (2008) Perera, T. A., Chapin, E. L., Austermann, J. E., et al. 2008, MNRAS, 391, 1227
- Polletta et al. (2007) Polletta, M., Tajer, M., Maraschi, L., et al. 2007, ApJ, 663, 81
- Pope et al. (2005) Pope, A., Borys, C., Scott, D., et al. 2005, MNRAS, 358, 149
- Pope et al. (2006) Pope, A., Scott, D., Dickinson, M., et al. 2006, MNRAS, 370, 1185
- Pope & Chary (2010) Pope, A., & Chary, R.-R. 2010, ApJ, 715, L171
- Rex et al. (2010) Rex, M., Rawle, T. D., Egami, E., et al. 2010, A&A, 518, L13
- Riechers et al. (2013) Riechers, D. A., Bradford, C. M., Clements, D. L., et al. 2013, Nature, 496, 329
- Roseboom et al. (2010) Roseboom, I. G. et al. 2010, MNRAS, 409, 48
- Roseboom et al. (2012) Roseboom, I. G., Ivison, R. J., Greve, T. R., et al. 2012, MNRAS, 419, 2758
- Roseboom et al. (2013) Roseboom, I. G., Dunlop, J. S., Cirasuolo, M., et al. 2013, MNRAS, 436, 430
- Sanders & Mirabel (1996) Sanders, D. B., & Mirabel, I. F. 1996, ARA&A, 34, 749
- Sargent et al. (2010) Sargent, M. T., Schinnerer, E., Murphy, E., et al. 2010, ApJ, 714, L190
- Schreiber et al. (2015) Schreiber, C., Pannella, M., Elbaz, D., et al. 2015, A&A, 575, A74
- Smolčić et al. (2012) Smolčić, V., Navarrete, F., Aravena, M., et al. 2012a, ApJS, 200, 10
- Smolčić et al. (2012) Smolčić, V., Aravena, M., Navarrete, F., et al. 2012b, A&A, 548, A4
- Smolčić et al. (2015) Smolčić, V., Karim, A., Miettinen, O., et al. 2015, A&A, 576, A127
- Swinbank et al. (2008) Swinbank, A. M., Lacey, C. G., Smail, I., et al. 2008, MNRAS, 391, 420
- Swinbank et al. (2014) Swinbank, A. M., Simpson, J. M., Smail, I., et al. 2014, MNRAS, 438, 1267
- Symeonidis et al. (2013) Symeonidis, M., Vaccari, M., Berta, S., et al. 2013, MNRAS, 431, 2317
- Targett et al. (2013) Targett, T. A., Dunlop, J. S., Cirasuolo, M., et al. 2013, MNRAS, 432, 2012
- Thomson et al. (2014) Thomson, A. P., Ivison, R. J., Simpson, J. M., et al. 2014, MNRAS, 442, 577
- Vieira et al. (2013) Vieira, J. D., Marrone, D. P., Chapman, S. C., et al. 2013, Nature, 495, 344
- Wall et al. (2008) Wall, J. V., Pope, A., & Scott, D. 2008, MNRAS, 383, 435
- Walter et al. (2012) Walter, F., Decarli, R., Carilli, C., et al. 2012, Nature, 486, 233
- Wang et al. (2007) Wang, W.-H., Cowie, L. L., van Saders, J., Barger, A. J., & Williams, J. P. 2007, ApJ, 670, L89
- Wang et al. (2009) Wang, W.-H., Barger, A. J., & Cowie, L. L. 2009, ApJ, 690, 319
- Wardlow et al. (2011) Wardlow, J. L. et al. 2011, MNRAS, 415, 1479
- Wardlow et al. (2013) Wardlow, J. L., Cooray, A., De Bernardis, F., et al. 2013, ApJ, 762, 59
- Weiß et al. (2013) Weiß, A., De Breuck, C., Marrone, D. P., et al. 2013, ApJ, 767, 88
- Whitaker et al. (2012) Whitaker, K. E., Kriek, M., van Dokkum, P. G. et al. 2012, ApJ, 745, 179
- Yan et al. (2014) Yan, H., Stefanon, M., Ma, Z., et al. 2014, ApJS, 213, 2
- Yun et al. (2012) Yun, M. S., Scott, K. S., Guo, Y., et al. 2012, MNRAS, 420, 957
- Younger et al. (2007) Younger, J. D., Fazio, G. G., Huang, J.-S., et al. 2007, ApJ, 671, 1531
- Younger et al. (2009) Younger, J. D., Fazio, G. G., Huang, J.-S., et al. 2009, ApJ, 704, 803
| Name | RA24μm | Dec24μm | Dist. | ||||||||
|---|---|---|---|---|---|---|---|---|---|---|---|
| (J2000) | (J2000) | (arcsec) | (Jy) | (Jy) | |||||||
| (1) | (2) | (3) | (4) | (5) | (6) | (7) | (8) | (9) | (10) | (11) | |
| GH500.01⋆ | 12:35:39.50 | 62:13:11.9 | 4.24 | 2.9 | 0.0098 | 6.60.3 | 19.91.4 | ||||
| GH500.02 | 12:35:39.54 | 62:12:43.8 | 3.03 | 0.9 | 0.057 | 0.047 | 7.50.2 | 14.41.1 | |||
| GH500.03 | 12:35:53.12 | 62:10:37.2 | 1.53 | 1.60 | 9.7 | 0.081 | 0.079 | 0.13 | 91.50.3 | 100.81.0 | |
| GH500.04 | 12:35:54.28 | 62:13:43.5 | 3.2 | 6.7 | 0.018 | 0.022 | 0.109 | 9.60.1 | 18.00.6 | ||
| 12:35:53.24 | 62:13:37.5 | 2.8 | 3.4 | 0.093 | 0.069 | 0.068 | 6.60.2 | 9.50.5 | |||
| GH500.05 | 12:36:05.68 | 62:08:38.4 | 3.21 | 8.6 | 0.053 | 0.085 | 4.50.1 | 6.30.5 | |||
| GH500.06† | 12:36:08.81 | 62:11:43.7 | 1.31 | 1.33 | 7.1 | 0.173 | 0.167 | 0.056 | 79.70.4 | 64.20.6 | |
| GH500.07† | 12:36:08.60 | 62:14:35.37 | 2.15 | 6.1 | 0.228 | 0.212 | 0.086 | 5.10.1 | 10.60.4 | ||
| GH500.08 | 12:36:08.84 | 62:08:04.1 | 3.56 | 2.4 | 0.0087 | 0.0088 | 10.00.2 | 23.80.6 | |||
| 12:36:10.59 | 62:08:10.7 | 4.54 | 11.8 | 0.0033 | 0.033 | 0.04 | 2.50.2 | 2.40.6 | |||
| GH500.09 | 12:36:16.11 | 62:15:13.7 | 2.70 | 2.57 | 1.4 | 0.028 | 0.118 | 0.05 | 10.50.2 | 23.40.6 | |
| GH500.10 | 12:36:16.51 | 62:07:03.0 | 3.07 | 6.7 | 0.0076 | 0.014 | 0.13 | 24.60.6 | 44.10.9 | ||
| 12:36:15.61 | 62:06:43.1 | 4.09 | 14.1 | 0.016 | 0.023 | 0.07 | 2.90.2 | 5.20.6 | |||
| GH500.11 | 12:36:18.49 | 62:09:03.3 | 1.61 | 0.15 | 0.061 | 0.061 | 57.70.2 | 56.80.7 | |||
| GH500.12 | 12:36:18.39 | 62:15:50.6 | 1.90 | 2.0 | 2.3 | 0.079 | 0.056 | 0.011 | 16.20.2 | 31.30.6 | |
| GH500.13 | 12:36:20.98 | 62:17:09.8 | 1.49 | 1.99 | 2.5 | 0.067 | 0.151 | 0.055 | 14.90.1 | 23.50.3 | |
| 12:36:21.27 | 62:17:08.2 | 2.32 | 0.91 | 0.205 | 0.075 | 0.010 | 13.80.1 | 24.60.4 | |||
| GH500.14 | 12:36:22.66 | 62:16:29.7 | 1.92 | 2.47 | 7.2 | 0.024 | 0.266 | 0.03 | 19.90.3 | 35.70.9 | |
| 12:36:22.07 | 62:16:15.9 | 4.63 | 7.4 | 0.0033 | 0.005 | 0.12 | 3.40.2 | 11.20.6 | |||
| GH500.15⋆ | 12:36:27.19 | 62:06:05.4 | 4.4 | 7.2 | 0.014 | 0.11 | 1.90.2 | 5.10.7 | |||
| GH500.16† | 12:36:31.29 | 62:09:58.0 | 2.02 | 1.7 | 0.11 | 0.219 | 0.014 | 13.20.2 | 20.90.5 | ||
| GH500.17† | 12:36:32.65 | 62:06:21.1 | 2.91 | 9.1 | 0.226 | 0.13 | 3.60.1 | 9.50.4 | |||
| 12:36:34.53 | 62:06:13.1 | 4.31 | 11.3 | 0.055 | 2.10.2 | 2.50.6 | |||||
| GH500.18 | 12:36:33.40 | 62:14:08.5 | 4.04 | 1.7 | 0.022 | 0.042 | 0.089 | 0.50.1 | 1.40.5 | ||
| GH500.19 | 12:36:44.03 | 62:19:38.4 | 3.41 | 6.9 | 0.035 | 0.029 | 0.123 | 2.30.09 | 6.91.1 | ||
| GH500.20 | 12:36:46.07 | 62:14:48.9 | 2.67 | 2.6 | 0.062 | 0.121 | 0.02 | 7.90.2 | 14.10.5 | ||
| GH500.21 | 12:37:00.26 | 62:09:09.9 | 2.13 | 12.5 | 0.077 | 0.075 | 0.004 | 22.10.2 | 40.80.7 | ||
| GH500.22 | 12:37:00.96 | 62:11:45.6 | 2.01 | 1.76 | 3.92 | 0.036 | 0.058 | 0.022 | 61.50.2 | 79.50.5 | |
| GH500.23 | 12:37:01.52 | 62:20:24.8 | 3.00 | 0.39 | 0.060 | 0.038 | 0.049 | 8.70.2 | 17.40.6 | ||
| 12:37:02.12 | 62:20:24.9 | 5.92 | 3.81 | 0.001 | 1.10.2 | 1.20.4 | |||||
| GH500.24† | 12:37:01.10 | 62:21:09.6 | 0.79 | 0.8 | 7.9 | 0.87 | 0.316 | 0.005 | 239.80.6 | 118.01.2 | |
| GH500.25 | 12:37:02.55 | 62:13:02.3 | 4.44 | 2.2 | 0.003 | 0.007 | 0.12 | 3.90.08 | 8.30.3 | ||
| 12:37:02.90 | 62:13:07.0 | 4.49 | 7.5 | 0.039 | 1.50.08 | 2.40.3 | |||||
| GH500.26 | 12:37:07.21 | 62:14:08.2 | 2.45 | 2.48 | 1.1 | 0.048 | 0.059 | 0.12 | 17.60.1 | 28.40.6 | |
| 12:37:07.58 | 62:14:09.5 | 5.1 | 2.48 | 3.9 | 0.149 | 0.018 | 0.10 | 24.10.3 | 51.50.8 | ||
| GH500.27 | 12:37:11.81 | 62:22:12.3 | 4.16 | 4.04 | 8.6 | 0.0087 | 0.015 | 0.046 | 8.30.2 | 19.71.0 | |
| 12:37:09.73 | 62:22:02.3 | 4.10 | 4.04 | 9.1 | 0.022 | 0.014 | 0.139 | 7.50.3 | 16.80.9 | ||
| 12:37:08.73 | 62:22:02.5 | 4.39 | 13.4 | 0.015 | 0.028 | 4.40.2 | 3.50.4 | ||||
| 12:37:08.78 | 62:22:01.8 | 4.19 | 4.04 | 14.7 | 0.021 | 0.025 | 0.014 | 4.00.09 | 4.20.4 | ||
| 12:37:09.42 | 62:22:14.5 | 1.65 | 1.63 | 11.4 | 0.187 | 0.049 | 0.127 | 57.20.2 | 68.20.9 | ||
| GH500.28 | 12:37:11.37 | 62:13:31.0 | 1.79 | 1.99 | 1.6 | 0.043 | 0.056 | 0.02 | 54.80.1 | 72.90.6 | |
| GH500.29 | 12:37:12.05 | 62:12:12.0 | 2.86 | 2.91 | 7.3 | 0.076 | 0.046 | 0.10 | 9.20.09 | 17.90.5 | |
| 12:37:14.29 | 62:12:08.5 | 2.2 | 3.15 | 9.3 | 0.013 | 0.063 | 17.50.1 | 26.30.5 | |||
| GH500.30 | 12:37:13.86 | 62:18:26.3 | 4.15 | 2.1 | 0.010 | 0.011 | 0.003 | 4.40.09 | 10.60.6 | ||
| GH500.31 | 12:37:28.08 | 62:19:20.2 | 4.32 | 2.3 | 0.0087 | 0.0033 | 0.11 | 7.70.4 | 16.21.6 | ||
| 12:37:29.24 | 62:19:28.6 | 4.65 | 12.89 | 0.025 | 2.90.2 | 4.20.3 | |||||
| GH500.32 | 12:37:28.11 | 62:14:21.82 | 3.32 | 5.06 | 0.047 | 0.071 | 1.80.08 | 4.70.6 | |||
| GH500.33 | 12:37:30.78 | 62:12:58.9 | 2.41 | 0.9 | 0.071 | 0.102 | 0.017 | 17.10.9 | 17.72.3 | ||
| GH500.34 | 12:37:38.30 | 62:17:36.2 | 3.13 | 3.19 | 1.5 | 0.059 | 0.193 | 0.13 | 4.30.2 | 8.60.8 | |
| 12:37:39.37 | 62:17:35.0 | 4.33 | 7.69 | 0.023 | 4.10.6 | 3.60.9 | |||||
| GH500.35 | 12:38:00.27 | 62:16:21.2 | 2.4 | 4.6 | 0.085 | 0.045 | 14.40.3 | 28.20.7 | |||
| 12:38:00.84 | 62:16:11.8 | 2.19 | 6.5 | 0.094 | 0.051 | 40.00.2 | 48.30.8 | ||||
| 12:37:58.82 | 62:16:11.7 | 1.98 | 10.6 | 0.096 | 0.119 | 10.20.1 | 19.70.5 | ||||
| GH500.36† | 12:38:12.54 | 62:14:54.3 | 0.60 | 3.8 | 0.307 | 0.638 | 0.059 | 126.50.6 | 116.42.7 |
Note. — Column (1): Name; (2) & (3): coordinates for the 24m counterparts; (4): Photometric redshift; (5): Spectroscopic redshift from Barger et al. (2008); Daddi et al. (2009a,b); (6): Distance of the 24m counterparts from the center of source in the ratio map; (7); Probability for random associations of 24m counterparts is calculated as ], where is the surface density of sources brighter than the predicted 500m flux, , and with redshifts above for a given counterpart of interest (see Section 2.3.2). (8): -values for candidate counterparts from the IRAC 3.6m catalog, which are calculated similar to the 24m catalog, but using the main-sequence relation to predict 500m flux from stellar masses. (9): -values for the radio 1.4 GHz catalogue, but are calculated using (the surface density of sources brighter than radio flux S1.4GHz). Traditionally, a radio counterpart is considered to be robust with . ⋆Counterpart(s) identified from the IRAC 3.6m. †Counterpart(s) identified based on the radio 1.4GHz detection.
| Name | RA | Dec | 24m | 100m | 160m | 250m | 350m | 500m | 850m | 1.1mm | 1.4GHz | LFIR | ||
|---|---|---|---|---|---|---|---|---|---|---|---|---|---|---|
| (Jy) | (mJy) | (mJy) | (mJy) | (mJy) | (mJy) | (mJy) | (mJy) | (Jy) | (K) | |||||
| GH500.1 | 12:35:39.49 | 62:13:11.7 | 4.24 | 5.62.3 | 9.32.1 | 14.93.9 | 6.1 | 27.88.8 | ||||||
| GH500.2 | 12:35:39.60 | 62:12:44.6 | 3.03 | 54.26.8 | 4.21.0 | 7.82.1 | 10.72.7 | 10.64.1 | 3.5 | 31.54.5 | ||||
| GH500.4a | 12:35:54.28 | 62:13:43.5 | 3.2 | 149.98.1 | 1.10.3 | 2.80.9 | 12.72.2 | 17.32.3 | 12.63.9 | 13.8 | 3.11.1 | 28.912.1 | 5.4 | 30.74.8 |
| GH500.4b | 12:35:53.28 | 62:13:37.6 | 2.81 | 32.56.6 | 3.30.9 | 20.62.2 | 23.22.3 | 15.63.9 | 6.4 | 39.84.5 | 6.5 | 34.58.1 | ||
| GH500.5 | 12:36:05.68 | 62:08:38.5 | 3.2 | 37.476.6 | 6.72.1 | 10.22.6 | 11.03.9 | 3.3 | 28.49.9 | |||||
| GH500.7† | 12:36:08.57 | 62:14:35.3 | 2.15 | 55.16.7 | 3.10.9 | 10.12.2 | 11.92.4 | 9.73.4∗ | 4.92.3 | 2.41.2 | 22.17.1 | 1.51 | 23.82.9 | |
| GH500.8 | 12:36:08.84 | 62:08:04.0 | 3.56 | 151.28.2 | 3.51.0 | 9.32.1 | 10.22.7 | 11.04.0 | 6.1 | 35.27.3 | ||||
| GH500.9 | 12:36:16.116 | 62:15:13.7 | 2.57⋆ | 322.510. | 5.74.1 | 12.04.1 | 28.42.1 | 29.02.4 | 16.24.2 | 4.90.7 | 2.91.1 | 35.84.9 | 8.4 | 37.71.6 |
| GH500.10a | 12:36:15.7 | 62:06:43.1 | 4.09 | 45.36.7 | 4.21.0 | 9.32.0 | 9.82.8 | 11.54.1 | 43.55.8 | 9.0 | 41.08.3 | |||
| GH500.10b | 12:36:16.51 | 62:07:03.0 | 3.07 | 302.410 | 3.14.1 | 21.62.0 | 27.52.8 | 17.24.1 | 264.7 | 8.5 | 33.84.9 | |||
| GH500.12 | 12:36:18.31 | 62:15:50.5 | 2.0⋆ | 314.510. | 4.30.4 | 23.41.1 | 42.82.3 | 47.12.1 | 23.64.0 | 7.50.9 | 1.91.1 | 164.46.9 | 4.7 | 29.81.2 |
| GH500.13 | 12:36:20.96 | 62:17:10.0 | 1.99⋆ | 361.310 | 3.980.4 | 15.31.0 | 21.62.0 | 26.42.6 | 13.74.1 | 3.50.7 | 44.92.7 | 3.6 | 31.01.7 | |
| GH500.14a | 12:36:22.66 | 62:16:29.70 | 2.47⋆ | 412.811 | 3.90.4 | 12.30.9 | 23.72.0 | 21.22.5 | 13.94.2 | 3.4 | 91.69.9 | 5.8 | 33.32.5 | |
| GH500.14b | 12:36:22.10 | 62:16:15.9 | 4.63 | 50.46.8 | 8.32.0 | 16.02.5 | 14.34.2 | 9.31.4 | 26.16.1 | 11.2 | 33.73.5 | |||
| GH500.15 | 12:36:27.23 | 62:06:05.7 | 4.4‡ | 7.32.0 | 14.52.8 | 13.74.2 | 9.52.3 | 4.31.1 | 34.35.9 | 10.0 | 35.25.2 | |||
| GH500.16 | 12:36:31.23 | 62:09:57.7 | 2.02 | 209.48.3 | 4.93.9 | 16.11.0 | 25.62.0 | 23.52.7 | 14.84.2 | 1416.1 | 3.7 | 32.61.6 | ||
| GH500.17 | 12:36:32.65 | 62:06:21.1 | 2.91 | 13.62.0 | 19.52.7 | 17.53.2∗ | 3.11.1 | 23.84.3 | 5.1 | 30.55.4 | ||||
| GH500.18 | 12:36:33.42 | 62:14:08.7 | 4.04⋆ | 30.46.6 | 8.22.2 | 14.32.7 | 13.24.2 | 10.51.6 | 5.40.9 | 34.04.0 | 8.1 | 29.12.8 | ||
| GH500.19 | 12:36:44.02 | 62:19:38.4 | 3.41 | 34.96.5 | 11.92.0 | 14.72.8 | 13.14.1 | 5.660.97 | 2.31.1 | 25.42.9 | 6.5 | 31.03.3 | ||
| GH500.20 | 12:36:46.04 | 62:14:48.6 | 2.67 | 129.88.4 | 3.90.4 | 16.61.0 | 25.92.0 | 24.92.6 | 21.14.1 | 5.40.5 | 109.65.3 | 7.6 | 37.41.5 | |
| GH500.21 | 12:37:00.26 | 62:09:09.9 | 2.13 | 246.99.1 | 2.00.4 | 6.60.9 | 16.81.9 | 16.62.8 | 13.04.2 | 3.50.8 | 337.54.3 | 2.7 | 34.42.2 | |
| GH500.23 | 12:37:01.57 | 62:20:24.9 | 3.0 | 55.76.6 | 3.10.9 | 10.42.0 | 13.82.8 | 7.73.9∗ | 48.15.1 | 4.2 | 29.86.3 | |||
| GH500.25 | 12:37:02.55 | 62:13:02.3 | 4.44 | 79.07.6 | 0.90.3 | 6.00.9 | 11.92.0 | 11.62.7 | 5.22.7 | 3.20.6 | 25.34.0 | 10.7 | 50.85.8 | |
| GH500.26 | 12:37:07.18 | 62:14:08.2 | 2.49⋆ | 248.99.1 | 1.60.4 | 8.60.9 | 23.92.0 | 29.02.4 | 24.74.1 | 7.60.6 | 28.34.2 | 5.2 | 29.71.4 | |
| GH500.27a | 12:37:11.89 | 62:22:11.8 | 4.05⋆ | 84.37.8 | 6.10.9 | 17.31.9 | 30.12.3 | 46.64.1 | 20.32.1 | 10.79.4 | 79.313. | 18.0 | 32.31.6 | |
| GH500.27b | 12:37:09.73 | 62:22:02.5 | 4.055⋆ | 30.26.6 | 2.90.9 | 12.42.0 | 15.22.4 | 18.24.0 | 19.94.0 | 8.5 | 33.95.5 | |||
| GH500.27c | 12:37:08.77 | 62:22:01.7 | 4.055⋆ | 38.86.5 | 14.52.0 | 18.02.4 | 18.24.0 | 9.92.3 | 172.99.0 | 10.2 | 36.55.5 | |||
| GH500.28 | 12:37:11.37 | 62:13:31.0 | 1.99⋆ | 748.0 | 11.30.6 | 34.91.5 | 54.12.8 | 49.32.1 | 29.23.9 | 7.70.6 | 4.01.0 | 178.9 | 8.7 | 33.10.9 |
| GH500.29 | 12:37:12.04 | 62:12:11.7 | 2.91⋆ | 51.56.7 | 1.00.3 | 3.61.0 | 11.82.0 | 10.02.6 | 6.54.0∗ | 4.60.7 | 2.01.0 | 31.74.3 | 3.6 | 31.93.3 |
| GH500.30 | 12:37:13.86 | 62:18:26.2 | 4.15 | 63.47.0 | 1.080.4 | 3.51.0 | 10.62.0 | 12.52.8 | 7.33.2∗ | 4.50.8 | 2.41.1 | 6278 | 7.8 | 41.45.1 |
| GH500.31 | 12:37:28.09 | 62:19:20.1 | 4.32 | 44.16.8 | 2.20.8 | 12.32.0 | 13.82.9 | 13.44.2 | 33.65.4 | 10.1 | 36.77.8 | |||
| GH500.32 | 12:37:28.11 | 62:14:21.82 | 3.32 | 34.36.6 | 2.00.8 | 21.12.0 | 21.72.7 | 20.74.0 | 8.4 | 6.9 | 29.53.8 | |||
| GH500.33† | 12:37:30.78 | 62:12:58.7 | 2.41 | 1847.7 | 4.90.4 | 23.41.1 | 52.32.3 | 55.02.1 | 44.83.8 | 12.210.77 | 4.11.1 | 1147 | 9.3 | 28.30.9 |
| GH500.34 | 12:37:38.15 | 62:17:37.1 | 3.19⋆ | 39.36.6 | 9.62.1 | 12.42.8 | 7.33.2∗ | 4.72.3 | 3.41.0 | 26.05.9 | 4.0 | 28.65.8 | ||
| GH500.35 | 12:38:00.27 | 62:16:21.2 | 2.4 | 140.58.3 | 2.10.4 | 6.01.0 | 11.22.1 | 12.72.8 | 11.63.6 | 2.9 | 32.44.9 |
Note. — † IR SED fittings are very poor, thus the inferred far-IR luminosity and dust temperature are highly uncertain. We did not consider the two sources in our analysis. ‡ Redshift from the far-IR SED fit. Although it is likely at high, we did not include this source in our analysis. ⋆ Spectroscopic redshift from Barger et al. (2008); Daddi et al. (2009a,b).
Appendix A Notes on individual sources
Here we present detailed notes on individual Herschel 500m sources found in the
/map. The candidate counterparts in the higher-resolution bands are identified with
(modified) -statistics (Section 2.3.2 and Table 1).
GH500.1: This is a single 500m source ( mJy) revealed with
the / method. There are two 24m sources within the search radius of 15″, but niether has a modified -value less than 0.1. We therefore searched the /IRAC catalog
for candidate counterparts and identified an IRAC source with photometric
redshift as the counterpart based on the -statistics.
The source is weakly detected in the band, but appears relatively bright in the /IRAC bands,
strongly suggesting that it is a candidate high- dusty star-forming galaxy.
GH500.2: There is a single unambiguous 24m counterpart with photometric redshift of .
There is a faint 1.2 mm source (GN 1200.38, Greve et al. 2008) 3 arcsec away from the 24m position.
The source is not detected in the radio or other submm bands.
GH500.3: There are seven 24m sources within the search radius, but -statistics suggest that
a source is the likely counterpart to the 500m source that is detected in
the / map. The source is also detected in the radio.
GH500.4: There are five 24m sources within the search radius, but only two of them, one at
and another at , have a modified -value less than 0.1. While both sources are
detected in the radio, the one at is also identified as the counterpart to a 1.1mm source (AzGN13, Chapin et al. 2009).
The Herschel flux in the official GOODS-Herschel catalog (Elbaz et al. 2011) was given to a nearby
source.
By fitting its far-IR photometry with a suite of CE01 templates, we found that there is a significant
excess of SPIRE flux compared to that predicted from the best template, suggesting that it is likely
a wrong association.
GH500.5: There are four 24m sources within the search radius, but only the one at
has a high probability to be associated with the 500m emission. The source is not detected in the
radio 1.4 GHz and other submm bands.
GH500.6: There is no source in the 24m and IRAC 3.6m catalog with a modified -value less than 0.1.
Therefore, we searched for a candidate counterpart in the radio 1.4 GHz catalog. There are two
radio sources within the search radius, one at and another at .
Since the latter has a much lower probability (=0.056) of being a chance association,
we consider it as the probable counterpart. This source is also identified as the counterpart to the
SCUBA 850m emission (GN02, Pope et al. 2006).
GH500.7: Like GH500.6, there is no source in the 24m and IRAC 3.6m catalog with a modified
-value less than 0.1. The candidate counterpart is therefore identified from the radio 1.4 GHz catalog with
a photometric redshift .
The source is also identified as the counterpart to the SCUBA source GN 23 by Pope et al. (2006).
Nevertheless, we found that the fit with to the far-IR photometric data is poor (=12.5) and
there is a significant excess of emission above 250m compared to the best-fit template.
Allowing the redshift to vary in the fit, we found a much better fit at (=0.49).
Either its photometric redshift was wrong, or it has extremely cold SED that was
not included in the CE01 libraries.
The source is also listed in the SCUBA-2 catalog with source name CDFN43, and the 1.1 mm catalog (ID AzGN24),
for which the same identification was proposed.
Note that the Herschel flux in the official GOODS-Herschel catalog was assigned
to a nearby source, which may suggest severe blending of Herschel flux from multiple counterparts.
GH500.8: There are three 24m sources within the search radius, and two of them have low
-values, with one at and another at .
Although the latter is significantly detected at 1.4 GHz, it is further away from the 500m source centroid
(10″). Our careful flux decomposition suggests
that the source has little contribution to the 500m emission (15%). The strong radio emission is likely
associated with an AGN. We therefore considered the
as the most probable counterpart to the 500m source (S500μm=11 mJy).
GH500.9: There are two heavily blended 24m sources within the search radius, one has a
spectroscopic redshift of and the other has (CDFN29, Barger et al. 2014).
The latter has a radio detection and a modified -value less than 0.1, thus was chosen as counterpart.
Barger et al. (2014) also identified it as the counterpart to the 850m emission (CDFN29, also known as GN04).
Since the blending is an issue, there may be a large uncertainty in the 500m flux.
GH500.10: There are five 24m sources in the search radius, but only two of them have a
modified -value less than 0.1. While both sources are also detected in the radio,
neither is detected in the other submm bands.
GH500.11: Like GH500.9, there are two heavily blended 24m sources within the search radius, one has a
redshift of and the other has .
The latter has a modified -value less than 0.1, thus was chosen as the counterpart.
GH500.12: There are five 24m sources within the search radius, but only one of them has a modified -value less than 0.1,
with a spectroscopic redshift of .
The source is also identified as the counterpart to the SCUBA-2 850m emission based on its strong radio emission
(CDFN14, Barger et al. 2014). The source is also known as a submm source 850-9 (Barger et al. 2012) or GN 19 (Pope et al. 2006).
GH500.13: There are five 24m sources within the search radius, but only two of them
are identified as candidate counterparts based on the -statistics, with one at
and another at .
Both sources are also detected in the radio, but separated by only 2.7″, with
the latter (CDFN34, Barger et al. 2014) being four times brighter than the former.
While the two sources cannot be resolved by SCUBA (GN7, Pope et al. 2006), Barger et al. presented
higher-resolution SMA measurements, separating it into two distinct sources, each with an
860m flux of mJy. As it is impossible to deconvolve the Herschel flux, we report the total flux of the two.
GH500.14: Like GH500.13, there are five 24m sources within the search radius, but only two of them
are considered as candidate counterparts.
Both sources are detected in the radio,
with one being four times brighter than the other. The
brighter radio source has a spectroscopic redshift of 2.47, while the fainter one has
a photometric redshift of .
Barger et al. (2014) measured the SCUBA-2 850m flux of mJy for the fainter radio source (CDFN21, also known as GN9).
Because of their close separation (10″), the SPIRE flux density from the Herschel catalog is
given to the , brighter 24m counterpart.
GH500.15: This source is a 24m dropout galaxy, but
detected in the AzTEC 1.1 mm Survey of the GOODS-N field (AzGN06, Perera et al. 2007).
It is also listed
in the SCUBA-2 sample of 850m sources (Name: CDFN8, mJy, Barger et al. 2014).
This galaxy is not detected in the Ks or bluer bands, but is detected in all four
/IRAC bands, suggesting it is a possible candidate at .
Using the 1.4 GHz to 850m flux ratio, Barger et al. estimated that the source has
a millimetric photometric redshift of 3.7.
By fitting its far-IR to radio photometry with a suite of CE01 templates, we found a
best-fit redshift of for the source.
GH500.16: This object has a single and clear radio counterpart, and is also detected with
SCUBA-2 at 850m (Source ID: CDFN39).
GH500.17: There is single 24m source at within the search radius, but the
probability of this source being a chance alignment with the 500m emission is high. We therefore
searched for candidate counterparts in the IRAC 3.6m catalog, and found a counterpart
at based on the -statistics.
By fitting the far-IR photometry with a range of CE01 templates, we found that the fit with
is very poor (), and the predicted flux based on the best-fitted SED suggests that
the source contributes no more than 10% to the measured 500m emission.
Therefore, the 24m dropout, at a redshift of , is likely to be
the dominant 500m emitter.
GH500.18: This object is part of the Pope et al. (2006) catalog (GN10) and
Perera et al. (2008) catalog (AzGN3).
Similar to GN20, Daddi et al. (2009a) have identified that it has a spectroscopic redshift of 4.042 from a CO emission line.
The source is also listed in the Greve et al. (2008) 1.2 mm catalog and SCUBA-2 catalog.
We note that the SPIRE flux densities in the catalog are assigned to a nearby, brighter 24m source at .
By fitting the far-IR photometry with a range of CE01 templates, we find that the predicted 500m emission for
the source is less than 20% of that reported in the catalog, suggesting an incorrect association, and that most of the 500m flux should be associated with GN10.
GH500.19: There are three 24m sources within the search radius, but only one at
was identified as a candidate counterpart based on the -statistics.
It is detected in the AzTEC 1.1 mm imaging by Perera et al. 2007 (source ID: AzGN28), but not in the
SCUBA map. New SCUBA-2 imaging reveals that the source has an 850m flux of mJy (ID: CDFN19,
Barger et al. 2014).
The SPIRE fluxes in the catalog of Elbaz et al. (2011)
were mis-associated with a galaxy,
which is ″ away from the source.
GH500.20: Like GH500.9, there are four heavily blended 24m sources within the search radius.
Only one source at was identified as the candidate counterpart based on the -statistics.
This sources is also known as GN 12 in the Pope et al. (2006) catalog and CDFN20 in the Barger et al. (2014) catalog.
Chapin et al. (2009) identified this source as the counterpart to the 1.1mm emission (AzTEC 8), though it is 7 arcsec
away from the 1.1mm source centroid.
GH500.21: There are four 24m sources within the search radius, two of which are detected in the radio.
However, only one object at was chosen as a candidate counterpart based on the modified
-statistics computed from the 24m catalog.
This source is also identified as the counterpart to the 850m emission (CDFN44 and GN16, Barger et al. 2014).
GH500.22: Like GH500.21, there are five 24m sources within the search radius, but only one ()
is a probable counterpart to the 500m emission.
This source is also detected in the radio and at 850m (CDFN22 and GN17, Barger et al. 2014).
GH500.23: Among three 24m sources, the one at is identified as a candidate counterpart.
There is another IRAC 3.6m source () separated by only ″, which possibly contributes
to the 500m emission, although it is not detected in the 24m and radio maps.
GH500.24: There are two heavily blended 24m sources within the search radius.
Though both are detected in the radio map, neither has a modified -value less than 0.1
based on the 24m and IRAC 3.6m catalog. We chose the brighter radio source () as
the candidate counterpart.
GH500.25: This source has a single and unambiguous 24m/radio identification,
which is also associated with the SCUBA 850m emission (GN18, Pope et al. 2006).
GH500.26:
This 500m source appears to have two 24m/radio counterparts to the 500m flux.
Nevertheless, both objects are confirmed to have a
spectroscopic redshift of 2.484 (Pope et al. 2006), thus
the 500m emission comes from two interacting galaxies at the same
redshift.
While Barger et al. (2014) identified a single counterpart to the 850m emission (CDFN14),
Pope et al. (2006) reported two radio identifications to the SCUBA 850m emission (GN19).
GH500.27: There are four 24m identifications to the 500 m emission, three of them
are also known as GN20, GN20a and GN20b. They are associated with a protocluster
in the GOODS-North field (Daddi et al. 2009b), and have spectroscopic redshifts of 4.055 based on
CO lines. They are among the brightest submm sources detected with SCUBA.
There is another IRAC 3.6m source at a lower redshift () likely
contributing to the 500m emission, though the probability of random association is relatively high
for the 24m catalog (=0.187).
GH500.28: This object is a significant SCUBA source, GN 39, described in Wall et al. (2008), and
has two radio counterparts, both confirmed to lie at the same redshift ( and , Barger et al. 2008).
As the two sources are separated by only 6″, it is impossible to deconvolve
the SPIRE fluxes, and we report the total flux of the two from the Herschel catalog.
GH500.29: There are two spectroscopically-confirmed 24m sources identified as candidate counterparts
(one at and the other at ).
The source has a radio detection (hence the counterpart identification
is secure), and is associated with a submm source at 850m (CDFN27, Barger et al. 2014) and
1.2mm (GN1200.29, Greve et al. 2008).
The source is, however, not detected in these (sub)mm bands, but
shows a tentative detection in the radio.
Deeper radio imaging (Owen et al. in preparation) will help to confirm the
counterpart.
GH500.30: The source has a robust identification in the
24m and radio catalogs, with a photometric redshift of .
Note that the source is very bright in the radio (S1.4GHz=626 Jy) with a strong radio excess (),
suggesting a significant contribution from an AGN.
The source was reported as an additional 850m source from the Pope et al. (2006) sample with
S850μm= 8.8 mJy (Wall et al. 2008), and was also detected at 1.1mm (ID AzGN26, Perera et al. 2007),
and 1.2mm (GN 1200.6, Greve et al. 2008).
However, it was later reported in the SCUBA-2 catalog with an 850m flux of 4.5 mJy
(Name CDFN28, Barger et al. 2014).
GH500.31: A robust and clean galaxy identified with a 24m/radio counterpart,
which is, however, not detected in any submm bands.
Although the -statistics for the IRAC 3.6m catalog revealed another candidate counterpart
at , the galaxy is not detected in the radio and is far from the 500m source centroid,
thus its contribution to the 500m emission is marginal.
GH500.32: There are seven heavily blended 24m sources within the search radius, but only one at
was identified as a candidate counterpart based on the -statistics.
The source is not detected in the radio and other submm bands.
GH500.33: The source has a robust and unambiguous counterpart identification the 24m /radio.
The galaxy does not appear in the
Pope et al. (2006) catalog (it is at the edge of SCUBA coverage where the sensitivity is low).
Barger et al. (2014) reported the significant SCUBA-2 850m detection of this source
(ID: CDFN4) at , with flux of mJy, making it one of the brightest submm sources ( mJy) in their catalog.
This source also appears in the 1.1mm catalog of Perera et al. (2008), known as AzGN05.
GH500.34: The galaxy has a robust identification in the radio and 24m with a
spectroscopic redshift .
It is also detected at 850m , as GN37 in the Pope et al. (2006) catalog, and
at 1.1mm (ID AzGN9, Perera et al. 2007).
Like GH500.31, the -statistics for the IRAC 3.6m catalog revealed another
candidate at , but it is not detected in the radio.
We chose the source detected in both 24m and radio as the candidate counterpart.
GH500.35: There are three 24m sources identified as candidate counterparts based on the -statistics,
but none of them has a radio or submm detection.
They are estimated to have photometric redshifts of 2.4, 2.2, and 1.98, and
may contribute equally to the SPIRE flux.
Therefore, we are unable to obtain a unique and secure identification.
However, by inspecting the radio image (Morrison et al. 2010), we find a tentative radio detection at
the position of source at . As this source is closest to the peak of the /map,
we consider it as the tentative counterpart of the 500m source. Using deeper VLA interferometry,
or mm interferometric follow-up, it will be possible to further localize the 500m emission.
GH500.36: The source is near the edge of the GOODS-N region, and has a photometric redshift of . However, similar to GH500.7, the best-fit with a suite of CE01 library templates underestimates SPIRE 350 and 500m flux significantly. Although allowing the redshift to vary yields a better fit () at a redshift of 2.6, it is possible that the source has an unusual IR SED, which is much colder than any CE01 templates.
Appendix B Notes on Herschel flux measurements
The Herschel flux measurements for the /-selected ULIRGs are mainly from the photometry catalog of Elbaz et al. (2011). However, as described in Section 4.1, around 30% of our sources (including three 24m dropouts) have no measured 500m fluxes in the catalog. For these objects, Herschel/SPIRE flux densities are derived from PSF-fitting with GALFIT (Peng et al. 2002), using 24m prior positions. We used a very similar source extraction and photometry method to the one described in Elbaz et al. (2011), but fitted a stamp image of size 1.51.5 arcmin2 centered on the source of interest for each of SPIRE bands. In brief, our fittings were performed using an “iterative” approach. We fit simultaneously all 24m priors above the 5 limit within each of the 250, 350 and 500m stamps, but those with derived Herschel fluxes much smaller than the associated flux errors were removed from the prior list. The simultaneous fitting was then repeated using the refined list of 24m priors until no such low-signal-to-noise objects were left. Note that our restriction of the 24m priors to the 5 limit would bias against some fainter 24m sources, especially those at high redshift contributing to the SPIRE emission. We therefore visually checked the residual image to check for residuals at the positions of 24m sources which were excluded from the original input list. If these were found, those objects were added back into the prior list and the fit was re-iterated. The flux density for each object was then found from the best fit (). To assess the reliability of our SPIRE photometry, we performed similar GALFIT fitting to all Herschel 500m sources identified in this paper and compared the results to the catalog of Elbaz et al. (2011), as shown Figure B1. Our measurements are in good agreement with the catalog used in Elbaz et al. (2011), except for high-redshift sources whose SPIRE photometry may be significantly under-estimated in the catalog due to their fluxes being assigned to neighbors with brighter 24m emission.
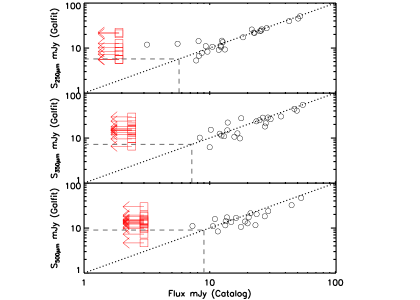
Appendix C Multiwavelength images of high-redshift Herschel sources
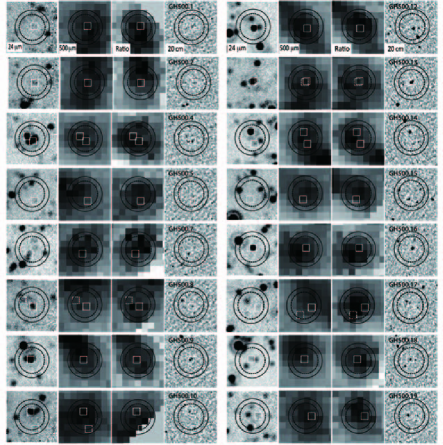
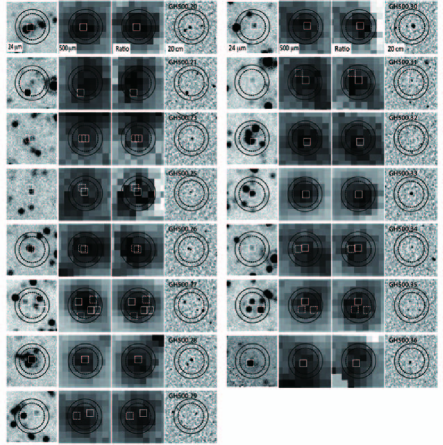
Appendix D Infrared-to-radio SEDs of high-redshift Herschel sources
In Figure D1, we present the measured IR-to-radio photometry and best-fitting SED for each of the 500m sources presented in Table 2. We find that the majority of our 500m sources are well represented by the best-fit SED templates, and only seven ULIRGs display evidence of a radio excess above the best-fit SED.
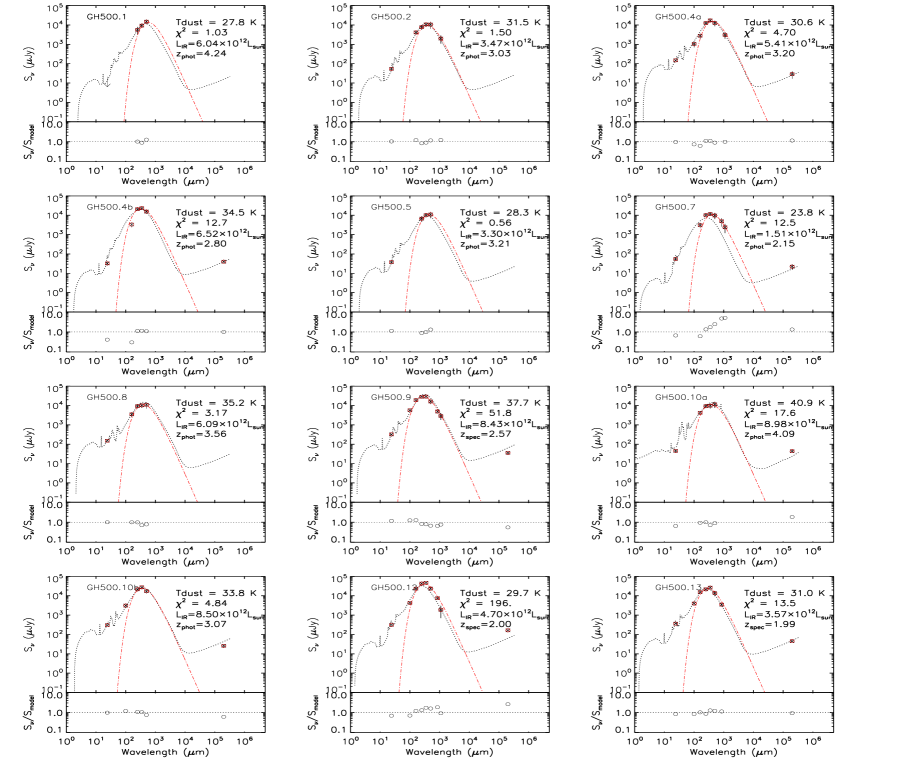
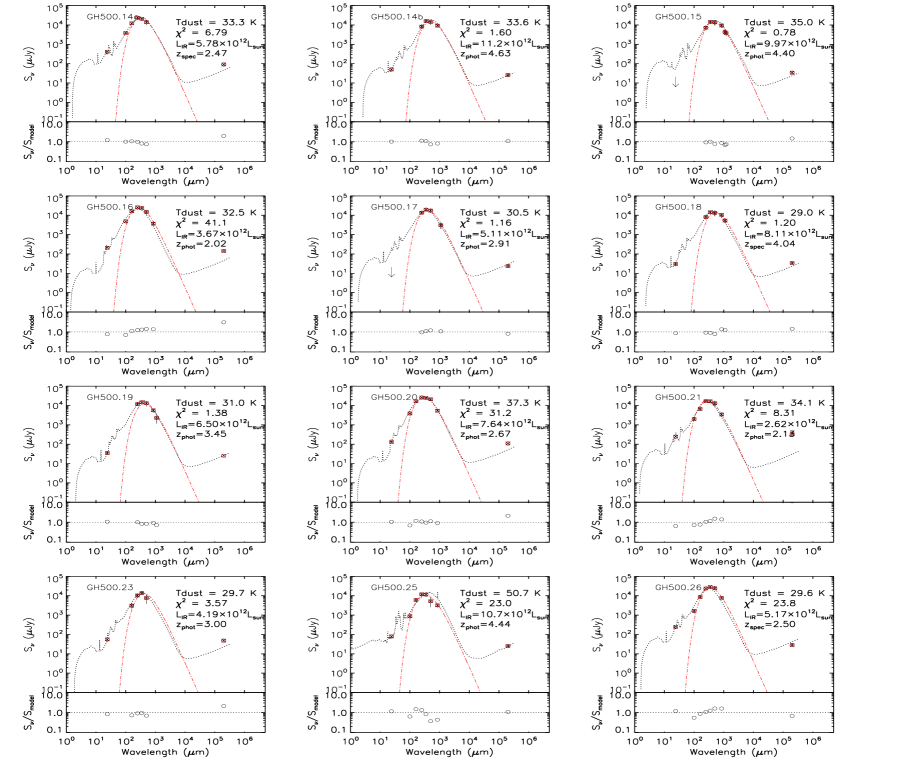
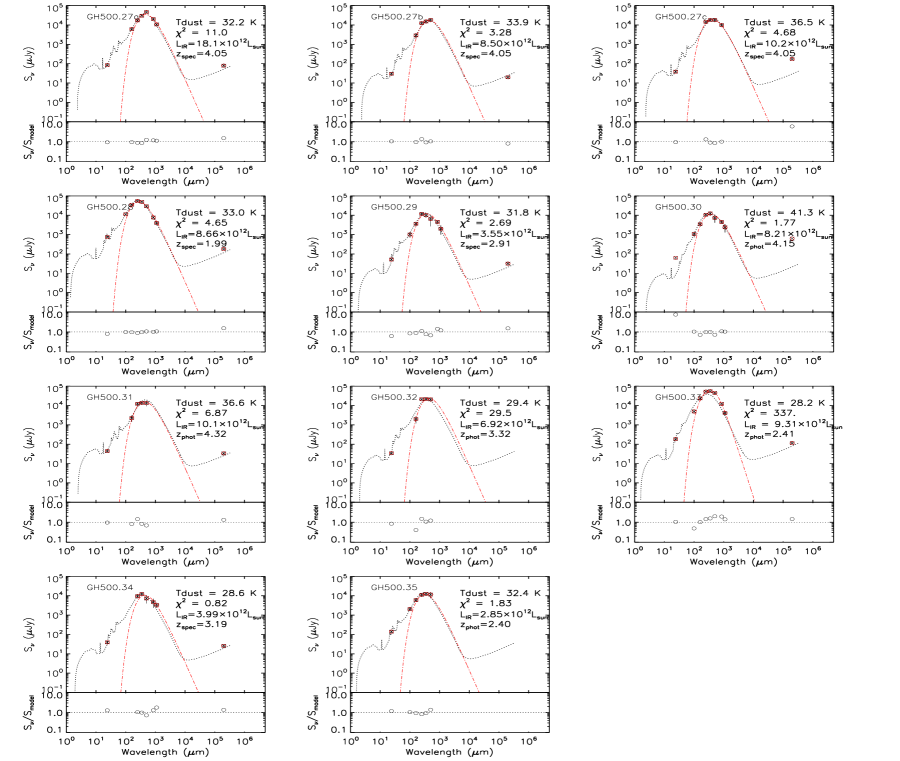
Appendix E Comparison between MIPS and IRAC identifications
In Figure E1 (left), we plot the cumulative distribution of modified -values for all 24m sources within the search radius (solid line), and that for the IRAC 3.6m counterparts (dotted line). The later were calculated using the main-sequence relation and a mass dependent dust extinction to predict the 500m flux from their stellar masses (see the text for details), in order to taking into account alternative counterparts for a few sources with no 24m counterpart satisfying 0.1. Using only the 24m image for counterpart identifications, we find 27 out of 36 sources detected in the ratio map having counterparts with 0.1. A -value cut at 0.1 corresponds to only 30 per cent of the cumulative distribution of -values for the 24m catalog, and 7 per cent for the IRAC catalog. In comparison to the distribution of the traditional -values for the radio catalogue (dashed line), it demonstrates that our approach using 24m data can be useful for identifying secure 500m counterparts in the absence of the radio data, by effectively reducing the number of foreground sources falling into the search area by chance. Note that -statistics for the IRAC catalog that has a high source surface density (79/arcmin2) is in agreement with the calculation starting with the 24m counterparts (Figure E1, right), albeit with a large scatter.
Several studies have shown that high-redshift submm-selected galaxies can be identified through their IR colors as measured by IRAC (e.g., Pope et al. 2006; Yun et al. 2008). By comparing with theoretical color tracks of dusty starbursts, Yun et al. (2008) proposed a dust-obscured young stellar population as the origin of the red IRAC color. In Figure E2, we show the 3.6- and 5.8-m color-flux diagram for all IRAC sources within the search radius (grey dots), with secure counterparts identified with -statistics highlighted in red circles (Table 2). It is apparent that candidate high 500m sources in the GOODS-North are typically redder than the field population. Within the region that was defined to select SMG counterparts (dotted line, Biggs et al. 2011), we recover 91 per cent of the catalogued sources in Table 2, further supporting the reliability of our counterpart identifications.