The variable V381 Lac and its possible connection with the R CrB phenomenon
Abstract
We have performed new medium resolution spectroscopy, optical and near infrared photometry to monitor the variability of the AGB carbon star V 381 Lac. Our observations revealed rapid and deep changes in the spectrum and extreme variability in the optical and near infrared bands. Most notably we observed the change of NaI D lines from deep absorption to emission, and the progressive growing of the [N ii] doublet 6548-6584Å emission, strongly related to the simultaneous photometric fading. V381 Lac occupies regions of 2MASS and WISE colour-colour diagrams typical of stars with dust formation in the envelope. The general framework emerging from the observations of V381 Lac is that of a cool AGB carbon star undergoing episodes of high mass ejection and severe occultation of the stellar photosphere reminiscent of those characterising the RCB phenomenon.
Comparing the Spectral Energy Distribution obtained with the theoretical model for AGB evolution with dust in the circumstellar envelope, we can identify V381 Lac as the descendant of a star of initial mass 2M⊙, in the final AGB phases, evolved into a carbon star by repeated Third Dredge Up episodes. According to our model the star is moderately obscured () by dust, mainly formed by amorphous carbon () and SiC (), with dust grain dimensions around and respectively.
keywords:
stars: variables – stars: individual: V381 Lac – stars: late-type – stars: emission line – infrared: stars.1 INTRODUCTION
Among the AGB stars, a small fraction of carbon rich stars show an extreme variability reminiscent of the hotter R CrB supergiants, e.g. (Feast et al., 2003; Whitelock et al., 2006). Erratic optical variability with large amplitude and dramatic spectral changes are the main signatures of these stars: the fast decline of several magnitudes in luminosity is interpreted as caused by enhanced mass loss events. The very extended atmospheres produce the ejection of clouds (puffs) where carbon rich dust condense in grains. The extinction events are attributed to these dust clouds in our line of sight: either a dust cloud is passing between the photosphere and us, or a sudden very strong ejection of dust by the star itself takes place. Colour changes also occur, being the object redder when fainter. The photometric changes have spectacular spectroscopic fallout: molecular and atomic lines develop in emission during the fading to turn back in absorption when the star recovers the bright state (Whitelock et al., 2006; Clayton, 1996).
Besides the optical variations, the infrared excess is a well known characteristics of the RCB and of their cooler counterpart, the DY Per stars, showing a spectrum more similar to that of an ordinary N AGB type supergiant (see e.g. Feast et al., 1997; Clayton, 1996). The advent of several infrared satellites improved the wavelength coverage of the energy distribution and stimulated the use of mid infrared colour-colour diagrams to select new candidates, (Tisserand, 2012; Tisserand et al., 2013; Miller et al., 2012; Lee, 2015). Differences and similarities have been extensively discussed and categorized although the behaviour of strongly variable AGB stars makes them difficult to be identified unless located in well monitored fields, while scattered observations can yield to misclassification of possibly interesting objects.
The case of V381 Lac (also known as FBS 2213+421) is paradigmatic. Over the years the star has been subject to periods of high luminosity and of rapid, severe obscuration episodes. Classified as a Dwarf Nova by (Dahlmark, 1996) and by Hoard et al. (2002) on the basis of the photometric variability, then as an M5-M6 star by Gigoyan et al. (2006) from a low dispersion objective-prism plate of the First Byurakan Survey (Markarian et al., 1989), it was finally recognised as a Carbon star by Gigoyan et al. (2009). To clarify its nature we started since 2012 a photometric and spectroscopic campaign and collected the available data from literature and public catalogs. This paper is organised inthe following way: in Section 2 we describe the observational material. In Section 3 we analyse the flux variability, the spectroscopic changes and the position of V381 Lac in several infrared colour-colour plots. In Section 4 we present a possible interpretation of the Spectral Energy Distribution on the basis of our evolutionary models for dusty carbon rich stars. In Section 5 we discuss the last event of strong flux variation and draw our conclusions.

2 OBSERVATIONAL MATERIAL
2.1 Optical photometry and spectroscopy
Between July 2012 and September 2015 we obtained simultaneous photometric () and spectroscopic data with the 152cm and 182cm telescopes of the Bologna and Asiago Astronomical Observatories, equipped with the BFOSC and AFOSC (Bologna/Asiago Faint Object Spectrometer And Camera); spectral range is 3900-8500Å, dispersion 3.9 Å/pixel and resolution of about 10 Å. All the spectra were corrected for the atmospheric extinction and normalised at the same wavelength. One photometric point was also obtained with the Roma University telescope (TACOR) and one was kindly obtained for us by the ARA association with the 37 cm telescope in Frasso Sabino. The data were reduced by means of standard IRAF 111IRAF is distributed by the NOAO which is operated by AURA under contract with NFS procedures.
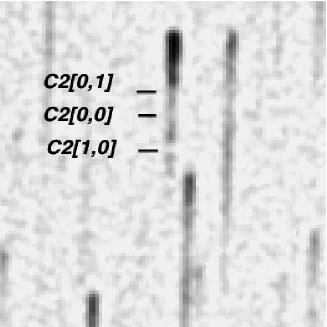
To study the photometric history of V381 Lac we have downloaded from MAST and analysed the digitised images available from POSS I, POSS II and Quick-V surveys in the and bandpasses. Well sampled light curves were obtained from the NSVS- ROTSE telescope (Wozniak et al., 2004) and the AAVSO 222American Association of Variable Star Observers, URL: http://www.aavso.org/vstar/vsots/0100.shtml archive. In the archives of Asiago Observatory we examined the plates of the field, obtained between 1967 and 1969; only an upper limit of =17.7 mag could be derived. We will not mention these plates anymore. We also re-analised the objective prism spectrum visible in the plate of the Digitized First Byurakan Survey, now accessible from the italian Virtual Observatory (http://ia2.oats.inaf.it/). The spectrum, showing the deep absorption bands typical of a carbon star, is presented in Figure 1. From this spectrum we derived approximate magnitudes in the and filters following the same criteria of the DFBS automatic pipeline (Mickaelian et al., 2007). We summarize the archive and our recent optical data in Table 1; typical errors are 0.07 mag for the Loiano, Asiago and Frasso Sabino, 0.1 mag for TACOR.
| emulsion/ | date | JD | ||||
|---|---|---|---|---|---|---|
| instrument | ||||||
| 103aO | 26 Aug. 1952 | 2434250 | 17.07 (0.14) | |||
| 103aE | 26 Aug. 1952 | 2434250 | 13.34 (0.13) | |||
| 103aF | 24 Oct. 1973 | 2441979 | 15.6 0.2 | 13.3 (0.2) | ||
| IIaD | 30 Sep. 1983 | 2445607 | 16.86 (0.10) | |||
| IIIaF | 4 Sep. 1989 | 2447773 | 20:: | |||
| IIIaF | 4 Oct. 1989 | 2447803 | 20:: | |||
| IV-N | 6 Oct. 1989 | 2447805 | 20 | |||
| IIIaJ | 29 Sep. 1992 | 2 448894 | 21:: | |||
| IV-N | 20 Sep. 1995 | 2449980 | 15.65 (0.12) | |||
| IIIaJ | 24 Oct. 1995 | 2445014 | 18.5 (0.3) | |||
| NSVS | May99-Feb00 | 2451 299-575 | 12.2-14.31 | |||
| SDSS | 24 May 2006 | 2453879 | und | und | und | 21.32 |
| AAVSO | July-Nov. 2012 | 2456 109-262 | 17.5-15.8 | 15.5-14.0 | ||
| BFOSC | 18 Jul. 2012 | 2456126 | 17.50 | 14.95 | 13.25 | |
| TACOR | 14 Oct. 2012 | 2456214 | 13.7 | 12.4 | ||
| F.Sabino | 18 Oct. 2012 | 2456218 | 16.09 | 13.75 | 12.33 | |
| AFOSC | 20 Nov. 2012 | 2456251 | 16.20 | 13.67 | 12.20 | |
| BFOSC | 28 Nov. 2013 | 2456624 | 17.40 | 15.61 | ||
| BFOSC | 17 Dec. 2013 | 2456643 | 19.70 | 17.65 | 15.93 | 14.21 |
| BFOSC | 21 Aug. 2014 | 2456890 | 21.5 | 19.5 | 17.85 | |
| BFOSC | 13 Sep. 2014 | 2456913 | 18.17 | |||
| BFOSC | 20 Jun. 2015 | 2457194 | 17.5 | 15.45 | 14.32 | |
| BFOSC | 22 Jul. 2015 | 2457225 | 20.2 | 17.81 | 15.75 | 14.61 |
| AFOSC | 06 Sep 2015 | 2457272 | 19.99 | 18.503 | 16.873 | |
| Notes: 1 ROTSE Red magnitudes; 2 SDSS magnitude; 3 converted to Johnson-Cousin system. | ||||||

2.2 Infrared Photometry
We obtained photometric observations in , , and bands at the 1.1m AZT-24 telescope located at Campo Imperatore (Italy) equipped with the imager/spectrometer SWIRCAM (D’Alessio et al., 2000), based on a 256x256 HgCdTe PICNIC array. From the archives we have also retrieved the data from 2MASS (Skrutskie et al., 2006), IRAS, WISE (Cutri et al., 2013), AKARI (Murakami et al., 2007) and converted fluxes to magnitudes according to the prescriptions of Tanabe et al. (2009) and of the IRAS Explanatory Supplement (1988) for AKARI and IRAS, respectively. Recent and archive magnitudes are reported in Table 2. We do not report the very uncertain value of the WISE 4.6 magnitude.
| source | date | 1.25 | 1.65 | 2.26 | 3.4 | 9.0 | 12 | 18 | 22/25 | 60 |
| 2MASS (1) | 11-10-1998 | 13.207 | 10.196 | 7.788 | ||||||
| C.I. (2) | 21-09-2012 | 8.96 | 7.45 | 6.15 | ||||||
| C.I. (3) | 17-12-2013 | 10.77 | 8.47 | 6.54 | ||||||
| C.I. (4) | 29-09-2014 | 12.74 | 9.65 | 7.33 | ||||||
| C.I. (5) | 22-06-2015 | 11.13 | 9.33 | 7.40 | ||||||
| C.I. (6) | 23-07-2015 | 11.37 | 9.4 | 7.6 | ||||||
| IRAS | 1983 | 0.626 | -0.17 | -0.45 | ||||||
| AKARI | 2006-2007 | 1.13 | -0.14 | |||||||
| WISE | 18-06-2010 | 4.438 | 0.365 | -0.227 | ||||||
| Wavelengths are in m. | ||||||||||
| C.I. = Campo Imperatore, K is in 2MASS system. Errors for July 2015 ad are 0.15 mag | ||||||||||
3 DATA ANALYSIS
3.1 Flux variations
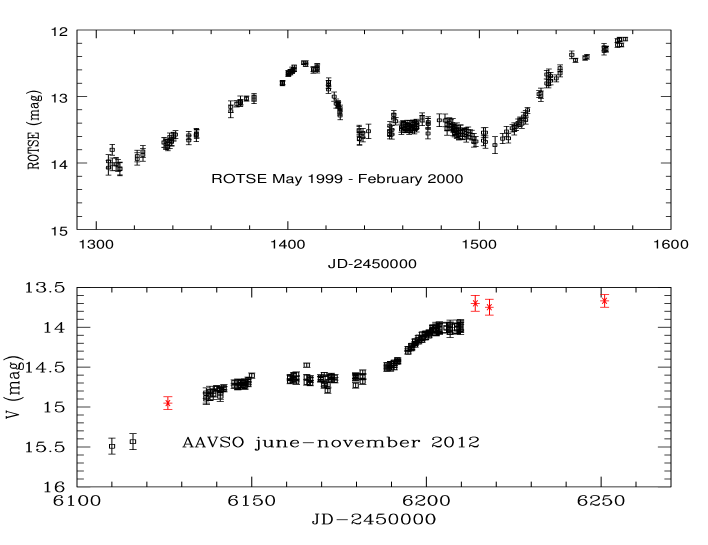
From the photometric optical history presented in Table 1 it is clear that two deep minima occurred in 1989 and 2006. On shorter time scales, variability of 2 mag are shown by the ROTSE and the AAVSO optical light curve, but no periodicity can be identified (see Figure 2).
In the near infrared our data show large changes with respect to 2MASS, and also within one year, strongly correlated with the optical photometric and spectroscopic variations. At longer wavelengths the excursions seem to be smaller on the basis of the data presented in Table 2, obtained at different epochs by different instruments.
3.2 Spectroscopic variations
Our new spectra of V381 Lac at different epochs are shown in Figure 3. Overall, the spectral changes are strongly correlated with the optical flux and with the sign of its derivative. The spectra obtained during bright phases (1973 and 2012) showed strong absorption bands; in the 2012 spectrum the bands typical of a naked N type giant, belonging to the Swan system of the C2 and to the red system of CN molecule, could be easily identified. From a comparison with the spectral atlas of carbon stars by Barnbaum et al. (1996) the spectral class of the object was not earlier than N5 subtype. The Na D at 5890-96 Å doublet was strong in absorption. In December 2013, during a fading phase the continuum was brighter redwards 7800Å and the veiling started to affect the strength of the photospheric absorption bands. The most interesting features of this spectrum were the Na D doublet which changed to strong emission and a faint emission at about 6582Å. In summer 2014 the star was even fainter, the emissions were stronger and the second component of the [N ii] doublet became visible at 6547 Å. In June 2015 the star was in a relatively bright phase: only absorption features with sign of veiling were visible in the spectrum, while the evolution of the photometry from June to July indicated a new brightness decline.
Besides the emission of Na D and [N ii] during the fading phases, we remark the lack of hydrogen lines either in emission or absorption in all the new spectra, while in 2008 H was clearly present in absorption simultaneously with the Na D doublet (Gigoyan et al., 2009).
3.3 Infrared diagrams
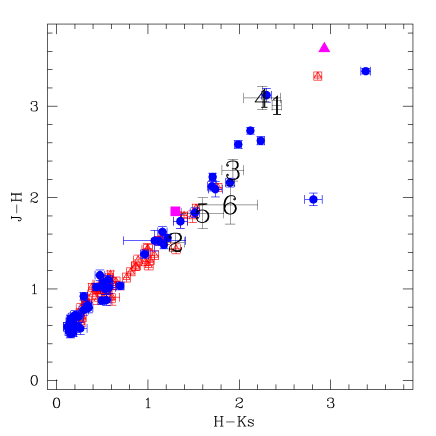
We located our star in the classical colour-colour diagram to study its evolution with luminosity (e.g. Bessel & Brett, 1988; Leggett et al., 2002; Cruz et al., 2003). We show the results in Figure 4 together with those of confirmed carbon stars from FBS and other dataset (Alksnis et al., 2001; Mauron, 2008; Mauron et al., 2014). The positions of V381 Lac corresponding to the dates reported in Table 2 are indicated by the numbers in black. The very red 2MASS point in 1988 (point 1) is indicative of the presence of a cool envelope. In 2012, during a bright phase, V381 Lac was along the strip of the naked carbon stars (point 2) while one year later, during the optical fading, it was moving again towards the dusty stars region (point 3). In the autumn 2014, when the star was already faint, the colours were again very similar to those of 2MASS (point 4) . The magnitudes of Summer 2015 (points 5 and 6 ) are intermediate between maximum and minimum. Two points corresponding to the theoretical models described below are also indicated.
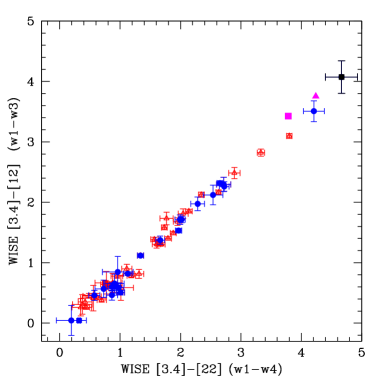
At longer wavelengths we have checked the colours of V381 Lac in diagrams involving the IRAS, WISE and AKARI magnitudes; some of them are very efficient in discriminating dust enshrouded stars (see fig.8 in Nikutta et al. (2014), fig. 4 in Tisserand (2012), and fig. 3 in Nesci et al. (2014) ). In the lack of the 4.6 flux in the WISE-2013 database we have traced the possible colour - colour diagrams using the three remaining filters. An example is given in fig. 5: V381 Lac is represented by the red symbol in the region occupied by obscured carbon stars.
We have tried anyway to get more information from WISE, locating V381 Lac in the classical diagram [4.6][12] vs [12][22] used by Tisserand (2012). That paper is based on the WISE Preliminary release (Cutri et al., 2011) suffering of several problems of calibration. We have applied the appropriate corrections to the magnitudes of V381 Lac according to figure 3 of Tisserand (2012); when this release is used V381 Lac has the following colours [4.6][12] = 2.60 0.13, [12][22] = 0.750.08. In the WISE-2013 release the magnitude [4.6] is reported in red (not reliable), the other magnitudes also changed, while the colours remain similar; taking into account the large uncertainties in the new release too, we consider the above reported colours still acceptable, that locate the star in the zone populated by known RCB stars in figure 6 of Tisserand (2012).
Similar indications are derived from the other possible WISE diagrams and from the diagrams involving AKARI data, taken when the star was in a faint phase. From the IRAS magnitudes computed according to the definition of van der Veen & Habing (1988) the colours of V381 Lac are: [12]-[25]=-0.796 and [25]-[60]= -1.60 in region VII of their figure 5b, populated by stars with evolved carbon rich circumstellar shells, in agreement with the previous results.
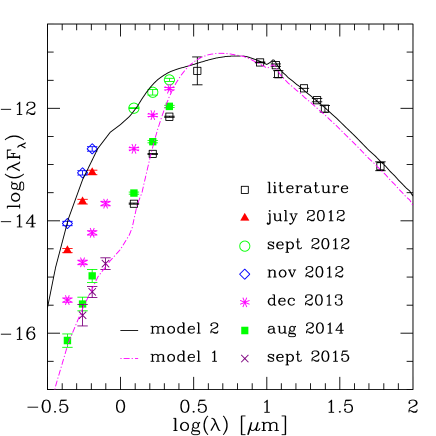
Finally, using the archive and our more recent data we have traced the Spectral Energy Distribution for V381 Lac reported in Fig. 6. In the infrared the AKARI data are well aligned with the WISE and IRAS ones, indicating a smaller variability of the source in the mid–infrared. To avoid confusion we do not plot the June and July 2015 fluxes. These points overlap quite well those of December 2013 when we caught the star during a fading phase. Although in summer 2015 no emission was visible in the spectrum, from the comparison of June and July photometry we argued that a similar evolution was globally occurring. Our guess was confirmed by the data obtained in September. In Fig. 6 we include these last points which correspond to the minimum brightness we have recorded so far.
4 THEORETICAL MODELS
Following the pioneering exploration by Ferrarotti & Gail (2006), various research groups worked on the description of dust formation in the winds of AGBs (Nanni et al., 2013; Ventura et al., 2014). In a recent paper, Dell’Agli et al. (2015) addressed the evolution of the infrared colours of AGB dusty models. In the present paper we compare the observations of V381 Lac with the predictions of these models, to give a possible theoretical characterization of this star.
4.1 The model
The evolution from the pre–main sequence to the end of the AGB phase was calculated by means of the ATON code for stellar evolution (see Ventura & D’Antona, 2009, and references therein). The range of masses investigated is , assuming a chemical composition in the range (). The convective instability is treated according to the Full Spectrum of Turbulence (FST) description, developed by Canuto & Mazzitelli (1991). For carbon stars, we use the mass loss rate by Wachter et al. (2008). For low mass models (), the Third Dredge Up (TDU) drives the bottom of the envelope to regions previously touched by 3 nucleosynthesis; the consequent increase in the surface carbon content eventually leads to the C–star stage. This paper is focused on a carbon star and for this reason, we have applied only the models with mass below . The wind surrounding AGBs is assumed to be accelerated by radiation pressure on dust particles. The growth of dust grains is described by condensation of gas molecules in the wind impinging on the already formed grains. The relevant equations can be found, e.g., in Ferrarotti & Gail (2006). For a given AGB evolutionary time, the location (and temperature) of the inner dust region boundary, the density stratification, the relative percentages of the different dust species (i.e., SiC vs. AmC), the optical depth and the dust grain size are calculated self-consistently by our wind AGB models (Ventura et al. 2014 and references therein) and then used as inputs for the DUSTY code (see Dell’Agli et al., 2015).
| Properties | V381 Lac | |
|---|---|---|
| Star | ||
| 8000-10000 | ||
| 2500 | ||
| 2 | ||
| 1 | ||
| Dust | ||
| Properties | model 1 | model 2 |
| T | 1000 | 600 |
| 0.22 | 0.08 | |
| 0.08 | 0.08 | |
| 0.18 | 0.18 |
4.2 Comparison and results
In Fig. 6, we can clearly distinguish different phases of obscuration that are particularly evident at optical and near–infrared wavelengths.
Using colors and SED, we identify V381 Lac as the descendant of a star of initial mass , in the final AGB phase, after the effects of repeated TDU episodes turned it into a carbon star. Models of smaller mass can be ruled out by the present analysis, because they never reach the observed degree of obscuration. The gradual increase in the surface carbon favors a considerable expansion of the external regions (Ventura & Marigo, 2009, 2010) and the consequent decrease in the effective temperature, which drops to . These conditions favour the formation of great amount of dust, mainly solid carbon, with smaller percentages of SiC. The SED of the star during the heavily obscured phase is nicely reproduced (model 2 in Fig. 6) by our 2 model, in the evolutionary stage when the mass is reduced to 1. The dust layer is formed close to the star and has a temperature around 1000 K. Dust is composed by 80% of solid carbon and 20% of silicon carbide, with grain sizes of and respectively. The optical depth at 10 is . The formation of solid carbon increases the emission in the continuum. The presence of a significant percentage of SiC, evident from the feature at in both models, is confirmed by the slight increase in the flux of the [12] band with respect to the other WISE bands.
To interpret the 2012 observations, when the SED exhibits a smaller degree of obscuration, we assume that the star experienced a phase of smaller mass loss, during which dust formation was suppressed. In this situation the radiation emitted from the central object is reprocessed by the dust layer formed during a previous phase of stronger mass loss, pushed outwards by effects of radiation pressure. In this configuration (model 1 in Fig. 6) the temperature of the dusty layer is 600, while the composition and dimension of dust grains are preserved together with the properties of the central object. Also, in this configuration the density decrease determines a lower optical depth, , with a higher emission in the optical. In Table 3 we summarise the main characteristics of the two different phases described by the models.
5 DISCUSSION AND CONCLUSIONS
Our observations of V381 Lac confirmed its strong photometric variability and showed a simultaneous coherent behavior from the optical to the near frared. A number of deep minima have been recorded in the last 60 years, most notably in 1989 (POSS II) and in 2006 (SDSS) Although the historic light curve is rather undersampled no clear sign of periodicity in the occurrence of fading episodes can be derived.
The magnitude changes decrease with increasing wavelengths. In the diagram the star moves along the strip of the moderately obscured AGB carbon stars, being redder when fainter. This is a common behaviour among stars showing erratic variability, and obscuration events. Feast et al. (1997) and Feast (1997) report an extensive description of different phenomenologies and several examples of the evolution in this diagram. The path followed by the colours of our star is substantially the same in spite of the limited number of our points in filters.
The spectral variations of V381 Lac are strongly correlated with the optical flux, showing a behaviour reminiscent of RCB stars. At maximum, continuum and spectral features are those of a typical N carbon giant. During decline, the photospheric absorptions are progressively diluted by the veiling due to repeated scattering of the light crossing the soot clouds that eclipse the photosphere. Na D and [N ii] doublets go in emission, with increasing intensity as stellar luminosity decreases. These lines, formed in the circumstellar envelope, are likely present with constant flux at all times, but are not visible during maxima, overwhelmed by the bright central object. Extensive descriptions and explanations of these phenomena may be found e.g. in Clayton (1996), Kameswara Rao et al. (2006) and references therein. Notably, during a phase of minimum luminosity, corresponding to the maximum emission of Na D and [N ii] lines, the molecular absorption bands were strong again (see Fig. 3). a similar behaviour is reported by Lloyd-Evans (1997) in the framework of the RCB model ’ … as the cloud gradually dissipates the photospheric spectrum returns to normal long before the re-attainment of maximum light’ .
In the 2008 spectrum H was clearly present in absorption;
the spectrum appears veiled but the photometric phase at that time is unknown.
In the more recent spectra hydrogen lines have never been observed neither in emission, nor in absorption, while, in similar stars, hydrogen is sometimes observed in emission during dimming.
V381 Lac shows a high level of activity, this suggest a high frequency of gas ejection from the central star, which can be responsible for a wide variety of variability between successive events, similarly to what happens e.g. in DY Per, (Alksnis et al., 2002).
The 2008 features still remain an open question: only a frequent monitoring with simultaneous photometric and spectroscopic observations can help in clarifying this difficult scenario.
Based on the fit of our theoretical models with the SED, V 381 Lac is a carbon star with an initial mass during the last pulses of the AGB phase. The central object with a luminosity around and effective temperature , is loosing the external envelope with a high rate () producing a dense carbon-enriched wind. This condition favours the formation of SiC and amorphous carbon in the circumstellar envelope with a grain size of and respectively. The dusty layers enshroud the star, obscuring the stellar radiation in the optical bands. Phases of lower mass loss rate are followed by a decrease in the dust production and a consequent increase of the optical emission.
We cannot exclude the possible presence of a companion of V381 Lac, capable to trigger strong mass loss events like in the case of V Hya, where the obscuration phases do not occur with regular timing (Olivier et al., 2001). We still do not have enough observing material to settle this issue: again, a long term spectroscopic ( at high resolution ) and photometric monitoring would be necessary to this purpose.
ACKNOWLEDGEMENTS
We thank the staff of the Asiago and Loiano observatories for the allocated time and excellent support for the observations. This research has made use of the SIMBAD database, operated at CDS, Strasbourg, France; the Two Micron AllSky Survey database, which is a joint project of the University Massachusetts and the Infrared Processing and Analysis Center/California Institute of Technology; the data from the Widefield Infrared Survey Explorer, which is a joint project of the University of California, Los Angeles, and the Jet Propulsion Laboratory/California Institute of Technology; the Northern Sky Variability Survey (NSVS) created jointly by the Los Alamos National Laboratory and University of Michigan; the AAVSO International Database contributed by observers worldwide. We finally wish to thank our referee G.Clayton for his valuable suggestions which contributed to improve the quality of the paper.
References
- Alksnis et al. (2001) Alksnis A., Balklavs A., Dzervitis U., et al. 2001,BaltA,10, 1.
- Alksnis et al. (2002) Alksnis, A., Larionov, V.M., Larionova, L.V., Shenavrin, V.I.,2002, Balt.A.,11,487.
- Barnbaum et al. (1996) Barnbaum C., Stone R.P., Keenan P.C., 1996, ApJS, 105, 419
- Bessel & Brett (1988) Bessel M.S., Brett J.M., 1988, PASP, 100, 1134
- Canuto & Mazzitelli (1991) Canuto V.M.C., Mazzitelli I., 1991, ApJ, 370, 295 2014,A&A, 569,L4.
- Clayton (1996) Clayton,G. C., 1996, PASP, 108, 225
- Clayton (2012) Clayton,G. C., 2012, JAAVSO,40, 539
- Cruz et al. (2003) Cruz K.L., Reid I.N., Liebert J., et al, 2003, AJ, 126, 2421
- Cutri et al. (2011) Cutri, R.M., Wright, E.L., Conrow, T., et al. 2011, Explanatory Supplement to the WISE Preliminary Data Release, Tech.Rep. http://wise2.ipac.caltech.edu/docs/release/prelim/expsup/ wise_prelrel_toc.html
- Cutri et al. (2013) Cutri, R.M. et al., CDS Catalog II/328
- D’Alessio et al. (2000) D’Alessio, F., Di Cianno, A., Di Paola, A., et al., 2000, SPIE 4008, 748
- Dahlmark (1996) Dahlmark, L., IBVS N.4329, 1996
- Dell’Agli et al. (2015) Dell’Agli F., Ventura P., Schneider R., Di Criscienzo M., Garcia-Hernandez D. A., Rossi C., Brocato E., 2015, MNRAS, 447, 2992
- Feast (1997) Feast,M.W., 1997, MNRAS 285, 339
- Feast et al. (1997) Feast,M.W., Carter,B.S., Roberts,G., et al., 1997, MNRAS 285, 317
- Feast et al. (2003) Feast M. W., Whitelock P. A., Marang F., 2003, MNRAS, 346, 878
- Ferrarotti & Gail (2006) Ferrarotti A.D., Gail H.P., 2006, A&A, 553, 576
- Gigoyan et al. (2006) Gigoyan K.S., Russeil, D., 2006, Astrofizika, 49, 91
- Gigoyan et al. (2009) Gigoyan K.S., Russeil, D., Sarkissian, A., Sargsyan, A.L., 2009, Astrophysics, Vol. 52, No. 3.
- Hoard et al. (2002) Hoard, D.W., Watcher, S., Clark, L.L., Bowers,T.P.,2002, ApJ., 565, 511
- Ivezic et al. (1999) Ivezic Z., Nenkova M., Elitzur M, 1999, User Manual for DUSTY, Univ. Kentucky Internal rep.
- IRAS Explanatory Supplement (1988) IRAS Catalogs and Atlases vol. 1, Explanatory Supplement, ed. C. Beichman, et al., 1988, NASA RP-1190
- Kameswara Rao et al. (2006) Kameswara Rao, N., Lambert, D.L., and Shetrone, M.D., 2006, MNRAS, 370, 941
- Lee (2015) Lee, C.H., 2015 A&A 575, A2
- Leggett et al. (2002) Leggett S.K., Golimowski D.A., Fan X., Geballe T.R., Knapp G.R. et al., 2002, ApJ, 564, 452
- Lloyd-Evans (1997) Lloyd Evans, T. , 1997, MNRAS, 286,839
- Markarian et al. (1989) Markarian, B. E., Lipovetski, V.A., Stepanian, J.A. et al., 1989, Commun. Spec. Astrophys. Obs., 62, 5
- Mauron (2008) Mauron N., 2008, A&A , 482, 151
- Mauron et al. (2014) Mauron N., Gigoyan K., Berlioz-Arthaud P., Klotz A. , 2014, A&A , 562, A24.
- Mickaelian et al. (2007) Mickaelian A.M., Nesci R., Rossi C., Weedman D., Cirimele G., et al., 2007, A&A, 464, 1177, VizieR On-line Data Catalog: III/237A
- Miller et al. (2012) Miller, A. A., Richards, J. W., Bloom, J. S., et al., 2012, ApJ 755, 98.
- Murakami et al. (2007) Murakami, H., Baba, H., Barthel, P., et al. 2007, PASJ, 59, 369
- Nanni et al. (2013) Nanni A., Bressan A., Marigo P., Girardi L. 2013, MNRAS, 434, 2390
- Nesci et al. (2014) Nesci, R., Gaudenzi, S., Rossi, C., et al, 2014, ASTROPLATES 2014, Prague 18-21 March 2014 , p.91, arXiv:1404.3842.
- Nikutta et al. (2014) Nikutta,R., Hunt-Walker, N., Nenkova, M.,4, et al, 2014, MNRAS 442, 3361.
- Olivier et al. (2001) Olivier, E.A., Whitelock, P., Marang, F., 2001, Mon. Not. R. Astron. Soc. 326, 490
- Skrutskie et al. (2006) Skrutskie, M. F., Cutri, R. M., Stiening, R., et al. 2006, AJ, 131, 1163
- Tanabe et al. (2009) Tanabe, T., et al., 2009, PASJ, 60, S375.
- Tisserand (2012) Tisserand, P., 2012, A&A, 539,A51.
- Tisserand et al. (2013) Tisserand, P., Clayton, G.C., Pilecki,B., 2013, A&A, 551,A77.
- van der Veen & Habing (1988) van der Veen W.E.C.J., Habing H.J., 1988, A&A, 194, 125.
- Ventura & D’Antona (2009) Ventura P., D’Antona F., 2009, MNRAS, 499, 835
- Ventura et al. (2014) Ventura P., Dell’Agli F., Schneider R., Di Criscienzo M. et al. 2014, MNRAS, 439, 977
- Ventura & Marigo (2009) Ventura P., Marigo P., 2009, MNRAS, 399, L54
- Ventura & Marigo (2010) Ventura P., Marigo P., 2010, MNRAS, 408, 2476
- Wachter et al. (2008) Wachter A., Winters J. M., Schröder K. P., Sedlmayr E., 2008, A&A, 486, 497
- Whitelock et al. (2006) Whitelock P., Feast M.W., Marang, F., 2006, MNRAS. 369, 75
- Wozniak et al. (2004) P. R. Wozniak, W. T. Vestrand, C. W. Akerlof et al., 2004Astron. J., 127, 2436.