Perturbative thermodynamics at nonzero isospin density for cold QCD
Abstract
We use next-to-leading-order in perturbation theory to investigate the effects of a finite isospin density on the thermodynamics of cold strongly interacting matter. Our results include nonzero quark masses and are compared to lattice data.
pacs:
11.10.Wx,12.38.Bx,12.38.Mh,21.65.QrI Introduction
The thermodynamics of strongly interacting matter at non-vanishing isospin chemical potential, , is relevant in different realms of physics, since there are several systems where the amounts of protons and neutrons are not the same. In the formation process of neutron stars, the initial proton fraction in supernovae is , which reduces with time to values of less than in cold neutron stars Prakash et al. (2001); Weber (2005). In the early universe, shortly after the Big Bang, a large asymmetry in the lepton sector that could shift the equilibrium conditions at the cosmological quark-hadron transition is allowed Schwarz and Stuke (2009). And, of course, in high-energy heavy-ion collisions, the proton to neutron ratio is in Au or Pb beams.
The phase diagram of QCD at finite temperature and isospin density is rich in phenomenology and has been investigated for over a decade Son and Stephanov (2001a, b). Since then, several studies were performed within effective models, on the lattice and most recently even perturbatively Toublan and Kogut (2003); Kogut and Sinclair (2004, 2005a); Toublan and Kogut (2005); Kogut and Sinclair (2005b); Sinclair and Kogut (2006); Andersen (2007); de Forcrand et al. (2007); Cea et al. (2012); Fraga et al. (2009); Palhares et al. (2009); Andersen and Kyllingstad (2009); Kamikado et al. (2013); Sasaki et al. (2010); Ueda et al. (2013); Stiele et al. (2014); Xia et al. (2013); Kanazawa and Wettig (2014); Endrodi (2014); Andersen et al. (2015). Although Monte Carlo simulations do not suffer from the sign problem since the fermion determinant remains real at nonzero , lattice calculations at non-zero isospin have been performed so far with unphysical quark masses Kogut and Sinclair (2004, 2005a, 2005b); Sinclair and Kogut (2006); de Forcrand et al. (2007); Cea et al. (2012); Endrodi (2014), which still limits their quantitative predictive power.
In this paper, we use next-to-leading-order in perturbation theory to investigate the effects of a finite isospin density on the thermodynamics of cold () strongly interacting matter which includes nonzero quark masses. Whenever possible, our results are compared to lattice data from Ref. Detmold et al. (2012). The paper is organized as follows: in Section II we present a brief discussion of the physical scenario and our setup; in Section III we show and discuss our results for the thermodynamical quantities computed; and section IV contains our final remarks.
II Physical scenario and setup
The phase diagram of QCD in the temperature versus isospin chemical potential plane is illustrated in Fig. 1, which should be seen as a cartoon. Along the temperature axis () there is no phase transition, according to lattice calculations at physical quark masses Aoki et al. (2006). At high isospin density, for values of above the pion mass , pion condensation takes place for not too large temperatures. At very high isospin density a Fermi liquid with Cooper pairing is formed as a consequence of an attractive interaction between quarks in the isospin channel Son and Stephanov (2001a). In contrast to the temperature versus baryon chemical potential () plane, there is a first-order deconfinement phase transition for large within the condensed phase, as indicated by the green line in Fig. 1. The authors of Ref. Son and Stephanov (2001b) conjecture that the phase transition line ends at a second-order point 111Other investigations suggest different scenarios concerning the existence of this critical point Cohen and Sen (2015). According to Ref. Cea et al. (2012), the chiral phase transition is located along the purple line in Fig. 1.
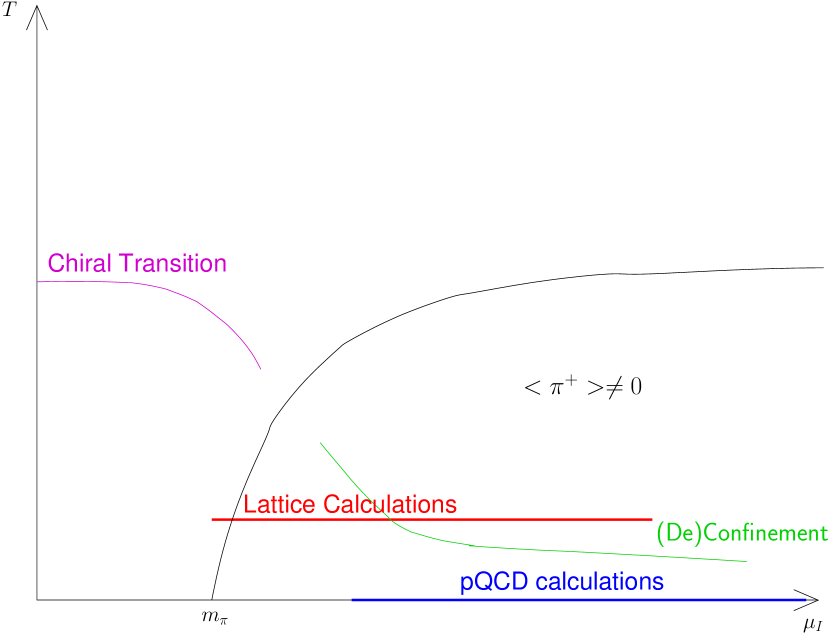
Lattice calculations of Ref. Detmold et al. (2012) were run at nonzero and at a fixed temperature of MeV. The values of covered in the simulations are indicated by the horizontal red line in Fig. 1. Our perturbative calculations were performed for values of the isospin chemical potential which are represented by the blue solid line, at . This difference should not be significant given the comparatively large values of , as was verified a posteriori.
The energy scale of the (de)confinement transition was computed in Ref. Cohen and Sen (2015) using an effective model description and found to be quite low, MeV. Numerical values for the (de)confinement scale were also computed in Refs. Kogut and Sinclair (2004); de Forcrand et al. (2007); Cea et al. (2012).
The phenomenon of pairing mentioned above should not be relevant for our perturbative study, in the same fashion that happens at nonzero (large) baryon chemical potential. The gap is exponentially suppressed for small values of , in the domain of validity of perturbation theory Son (1999); Son and Stephanov (2001a),
| (1) |
where and is the running coupling. We expect that the corresponding gap for nonzero isospin chemical potential will stay below MeV and hence will give a subleading contribution to the thermodynamic potential Alford and Rajagopal (2002).
Since the lattice calculations (red line in Fig. 1) might cross the deconfinement transition (green line) as conjectured in Ref. Cohen and Sen (2015), one can expect that perturbative calculations could provide a reasonable description of lattice results for large enough values of . With the help of Fig. 2 in Ref. Cohen and Sen (2015), a quantitative statement about the scale of at which the deconfined phase appears can be made: for GeV the deconfinement phase transition line crosses MeV, the value used in the lattice simulations of Ref. Detmold et al. (2012) to which we compare our findings.
For the expressions for the thermodynamic potential are available in analytic form up to . The one massive flavor contribution (leading and next-to-leading order) in the scheme is given by (see, e.g. Refs. Fraga and Romatschke (2005); Kurkela et al. (2010); Graf et al. (2015))
| (2) | |||||
| (3) | |||||
where and and are the numbers of colors and gluons, respectively. For calculations with 2+1 massive quark flavors we introduce the isospin chemical potential in the following way:
| (4) |
where is the quark chemical potential. We assume in what follows.
III Results
In order to compare our results with those from lattice simulations presented in Ref. Detmold et al. (2012), we adjusted our parameters accordingly. The strange quark chemical potential is chosen to be zero, and the vacuum pion mass is taken to be MeV. This corresponds to light quark masses and a strange quark mass given by
| (5) |
as extrated from the GOR-relation Gell-Mann et al. (1968). Since , the strange quark plays no role in our analysis.
Our calculations implement a running coupling Vermaseren et al. (1997); Eidelman et al. (2004)
| (6) |
where , and . The scale and is fixed by requiring at GeV Eidelman et al. (2004) and one obtains MeV. See also Ref. Fraga and Romatschke (2005) for details. With these conventions, the only freedom left is the choice of the renormalization scale , which is set to in all of our numerical simulations.
From the thermodynamic potential, Eqns. (2) and (3), we have full access to all thermodynamical quantities, such as the pressure
| (7) |
the isospin density
| (8) |
and the energy density (for )
| (9) |
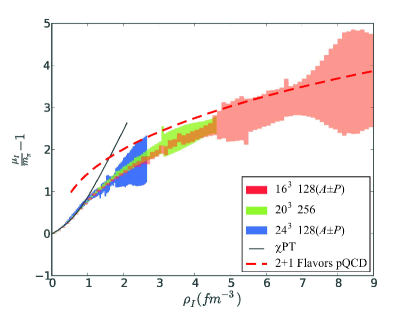
In Figs. 2 and 3 we compare our results with lattice data from Ref. Detmold et al. (2012). In Fig. 2, the ratio of energy density to (isospin density)4/3 is plotted against the isospin density. One can see that for increasing isospin density the two curves approach each other, as expected from asymptotic freedom, although perturbation theory systematically overestimates this quantity within the range of available lattice data extracted from Ref. Detmold et al. (2012). We stress, that the density dependence with a power of 4/3 is characteristic for an ultrarelativistic Fermi gas, the asymptotic limit at high chemical potentials. Note that an isospin density of roughly fm-3 corresponds to a value of GeV. In Fig. 3, the isospin chemical potential (subtracted by and normalized by the pion mass) is displayed versus the isospin density. The results from pQCD agree well with those that correspond to a band of lattice results extracted from Ref. Detmold et al. (2012) for values of the isospin chemical potential larger than about a few times the pion mass.
In Fig. 4 we exhibit the energy density normalized by the Stefan-Boltzmann (SB) form versus , and also compare with the corresponding band of lattice data extracted from Ref. Detmold et al. (2012) who define the SB limit via the isospin chemical potential as:
| (10) |
In terms of quark degrees of freedom the SB limit is given as a function of the quark chemical potential
| (11) |
which gives via the relation a factor 16 difference in the corresponding SB limits. The latter one would be the limit for a gas of quarks at zero temperature and high chemical potentials and hence also the SB limit for pQCD calculations.
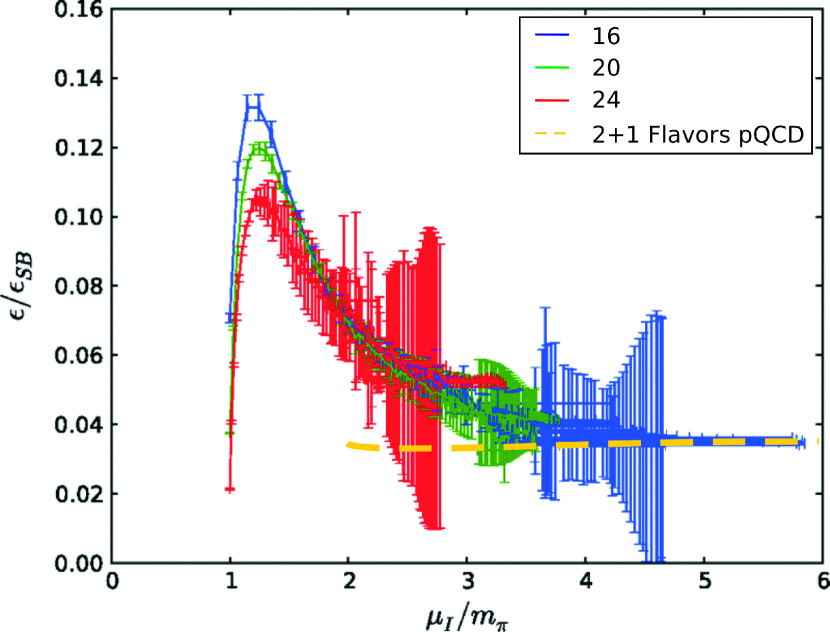
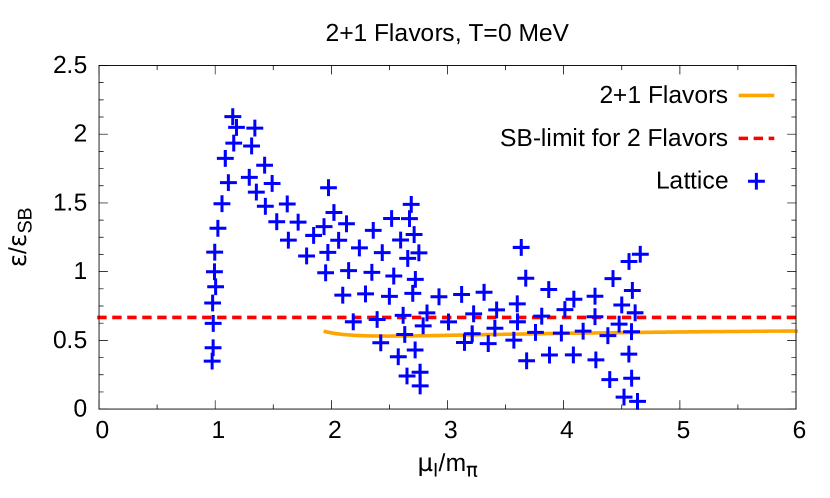
One sees in Fig. 4 that for the pQCD results are compatible with the ones from the lattice. The peak at can not be reproduced since it is caused by the pion condensate which is not captured by perturbation theory. Simulations that are based on chiral perturbation theory (PT) are indeed able to calculate this maximum Carignano et al. (2016). By maximizing the static chiral Lagrangian density the authors derive an analytic expression for the normalized energy density at the peak at leading-order. In general, lattice data is well reproduced by PT at leading-order for low densities, . However, for the results of chiral perturbation theory asymptotically approaches zero as only pion degrees of freedom are incorporated. This is in contrast to the lattice data which reaches at asymptotically high isospin chemical potentials our results from pQCD which is based on quark degrees of freedom. In Fig. 5 the same data of Fig. 4 is shown with regard to the SB limit for a gas of quarks, i.e. rescaled by a factor of 16 which appears when . The SB limit for 2 flavors (horizontal line) is also sketched in Fig. 5 because the strange quark is not contributing in our calculations as so that this SB limit should be considered as the actual limit of a free gas of quarks and gluons. In this sense, our results (orange line) are obviously very close to this limit which is consistent with the notion of asymptotic freedom.
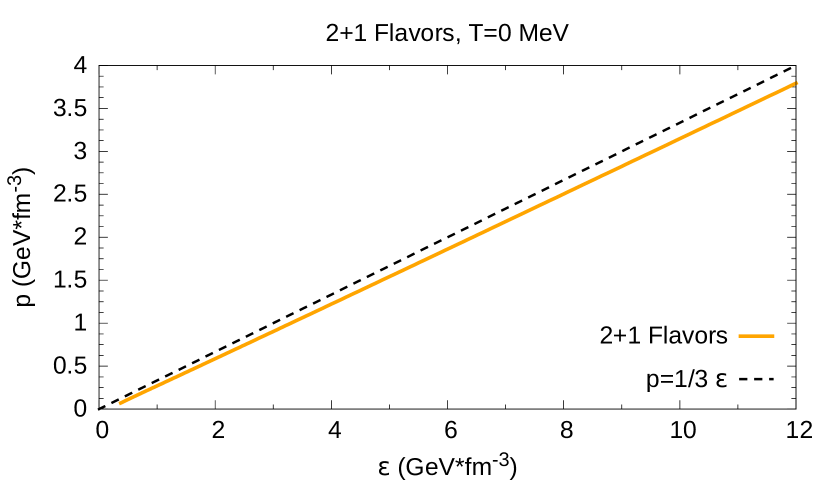
Finally, in Fig. 6 we plot the equation of state to exhibit the deviations from ideality, i.e. . The equation of state follows closely the one for an ideal ultrarelativistic gas.
IV Summary
We investigated thermodynamic properties of massive cold quark matter at zero temperature and baryon chemical potential and non-vanishing isospin density at next-to-leading order in perturbation theory, and compared our results with recent lattice data.
The ratio of energy density to (isospin density)4/3 versus isospin density shows that lattice data and our pQCD results get closer for high densities. Both seem to follow a scaling at high densities, which agrees with the limit for an ultra-relativistic degenerate Fermi gas. The isospin chemical potential plotted against the isospin density shows that the pQCD results and lattice results converge for values of . This is also true for the comparison of the normalized energy density as a function of the isospin chemical potential. The normalized energy density is essentially constant in the high-density limit, as expected.
We also verified that the energy density from the pQCD calculation is not too far from the Stefan-Boltzmann limit for two flavors since the strange quark does not appear in the dense medium under consideration. Furthermore, the deviations from an ideal equation of state are small.
In summary, the results from pQCD seem to be close to the lattice data already for values of , even in the region of pion condensate. It seems that the effect from the gap is suppressed for small values of the coupling constant, as anticipated, and gives a small contribution to the thermodynamic potential which is then dictated at high chemical potentials by a nearly free gas of quarks.
Acknowledgments
The authors want to thank Rainer Stiele, Lorenz von Smekal, Nils Strodthoff and William Detmold for fruitful discussions. ESF is grateful for the kind hospitality of the ITP group at Frankfurt University, where this work has been initiated. TG is supported by the Helmholtz International Center for FAIR and the Helmholtz Graduate School HGS-HIRe. The work of ESF is partially supported by CAPES, CNPq and FAPERJ.
References
- Prakash et al. (2001) M. Prakash, J. M. Lattimer, J. A. Pons, A. W. Steiner, and S. Reddy, Lect. Notes Phys. 578, 364 (2001), arXiv:astro-ph/0012136 [astro-ph] .
- Weber (2005) F. Weber, Prog. Part. Nucl. Phys. 54, 193 (2005), arXiv:astro-ph/0407155 [astro-ph] .
- Schwarz and Stuke (2009) D. J. Schwarz and M. Stuke, JCAP 0911, 025 (2009), [Erratum: JCAP1010,E01(2010)], arXiv:0906.3434 [hep-ph] .
- Son and Stephanov (2001a) D. Son and M. A. Stephanov, Phys.Rev.Lett. 86, 592 (2001a), arXiv:hep-ph/0005225 [hep-ph] .
- Son and Stephanov (2001b) D. Son and M. A. Stephanov, Phys.Atom.Nucl. 64, 834 (2001b), arXiv:hep-ph/0011365 [hep-ph] .
- Toublan and Kogut (2003) D. Toublan and J. B. Kogut, Phys. Lett. B564, 212 (2003), arXiv:hep-ph/0301183 [hep-ph] .
- Kogut and Sinclair (2004) J. B. Kogut and D. K. Sinclair, Phys. Rev. D70, 094501 (2004), arXiv:hep-lat/0407027 [hep-lat] .
- Kogut and Sinclair (2005a) J. B. Kogut and D. K. Sinclair, Lattice field theory. Proceedings, 22nd International Symposium, Lattice 2004, Batavia, USA, June 21-26, 2004, Nucl. Phys. Proc. Suppl. 140, 526 (2005a), [,526(2004)], arXiv:hep-lat/0407041 [hep-lat] .
- Toublan and Kogut (2005) D. Toublan and J. B. Kogut, Phys. Lett. B605, 129 (2005), arXiv:hep-ph/0409310 [hep-ph] .
- Kogut and Sinclair (2005b) J. B. Kogut and D. K. Sinclair, in Workshop on QCD in Extreme Environments Argonne, Illinois, June 29-July 3, 2004 (2005) arXiv:hep-lat/0504003 [hep-lat] .
- Sinclair and Kogut (2006) D. K. Sinclair and J. B. Kogut, Proceedings, 24th International Symposium on Lattice Field Theory (Lattice 2006), PoS LAT2006, 147 (2006), arXiv:hep-lat/0609041 [hep-lat] .
- Andersen (2007) J. O. Andersen, Phys. Rev. D75, 065011 (2007), arXiv:hep-ph/0609020 [hep-ph] .
- de Forcrand et al. (2007) P. de Forcrand, M. A. Stephanov, and U. Wenger, Proceedings, 25th International Symposium on Lattice field theory (Lattice 2007), PoS LAT2007, 237 (2007), arXiv:0711.0023 [hep-lat] .
- Cea et al. (2012) P. Cea, L. Cosmai, M. D’Elia, A. Papa, and F. Sanfilippo, Phys. Rev. D85, 094512 (2012), arXiv:1202.5700 [hep-lat] .
- Fraga et al. (2009) E. Fraga, L. Palhares, and C. Villavicencio, Phys.Rev. D79, 014021 (2009), arXiv:0810.1060 [hep-ph] .
- Palhares et al. (2009) L. Palhares, E. Fraga, and C. Villavicencio, Strong and electroweak matter. Proceedings, 8th International Conference, SEWM 2008, Amsterdam, Netherlands, August 26-29, 2008, Nucl. Phys. A820, 287C (2009), arXiv:0810.2742 [hep-ph] .
- Andersen and Kyllingstad (2009) J. O. Andersen and L. Kyllingstad, J. Phys. G37, 015003 (2009), arXiv:hep-ph/0701033 [hep-ph] .
- Kamikado et al. (2013) K. Kamikado, N. Strodthoff, L. von Smekal, and J. Wambach, Phys. Lett. B718, 1044 (2013), arXiv:1207.0400 [hep-ph] .
- Sasaki et al. (2010) T. Sasaki, Y. Sakai, H. Kouno, and M. Yahiro, Phys. Rev. D82, 116004 (2010), arXiv:1005.0910 [hep-ph] .
- Ueda et al. (2013) H. Ueda, T. Z. Nakano, A. Ohnishi, M. Ruggieri, and K. Sumiyoshi, Phys. Rev. D88, 074006 (2013), arXiv:1304.4331 [nucl-th] .
- Stiele et al. (2014) R. Stiele, E. S. Fraga, and J. Schaffner-Bielich, Phys.Lett. B729, 72 (2014), arXiv:1307.2851 [hep-ph] .
- Xia et al. (2013) T. Xia, L. He, and P. Zhuang, Phys. Rev. D88, 056013 (2013), arXiv:1307.4622 .
- Kanazawa and Wettig (2014) T. Kanazawa and T. Wettig, JHEP 10, 55 (2014), arXiv:1406.6131 [hep-ph] .
- Endrodi (2014) G. Endrodi, Phys. Rev. D90, 094501 (2014), arXiv:1407.1216 [hep-lat] .
- Andersen et al. (2015) J. O. Andersen, N. Haque, M. G. Mustafa, and M. Strickland, (2015), arXiv:1511.04660 [hep-ph] .
- Detmold et al. (2012) W. Detmold, K. Orginos, and Z. Shi, Phys.Rev. D86, 054507 (2012), arXiv:1205.4224 [hep-lat] .
- Aoki et al. (2006) Y. Aoki, G. Endrodi, Z. Fodor, S. D. Katz, and K. K. Szabo, Nature 443, 675 (2006), arXiv:hep-lat/0611014 [hep-lat] .
- Cohen and Sen (2015) T. D. Cohen and S. Sen, (2015), arXiv:1503.00006 [hep-ph] .
- Son (1999) D. T. Son, Phys. Rev. D59, 094019 (1999), arXiv:hep-ph/9812287 [hep-ph] .
- Alford and Rajagopal (2002) M. Alford and K. Rajagopal, JHEP 06, 031 (2002), arXiv:hep-ph/0204001 [hep-ph] .
- Fraga and Romatschke (2005) E. S. Fraga and P. Romatschke, Phys.Rev. D71, 105014 (2005), arXiv:hep-ph/0412298 [hep-ph] .
- Kurkela et al. (2010) A. Kurkela, P. Romatschke, and A. Vuorinen, Phys. Rev. D81, 105021 (2010), arXiv:0912.1856 [hep-ph] .
- Graf et al. (2015) T. Graf, J. Schaffner-Bielich, and E. S. Fraga, (2015), arXiv:1507.08941 [hep-ph] .
- Gell-Mann et al. (1968) M. Gell-Mann, R. Oakes, and B. Renner, Phys.Rev. 175, 2195 (1968).
- Vermaseren et al. (1997) J. Vermaseren, S. Larin, and T. van Ritbergen, Phys.Lett. B405, 327 (1997), arXiv:hep-ph/9703284 [hep-ph] .
- Eidelman et al. (2004) S. Eidelman et al. (Particle Data Group), Phys.Lett. B592, 1 (2004).
- Carignano et al. (2016) S. Carignano, A. Mammarella, and M. Mannarelli, (2016), arXiv:1602.01317 [hep-ph] .