1
MetaScope - Fast and accurate identification of microbes in metagenomic sequencing data
Abstract
MetaScope is a fast and accurate tool for analyzing (host-associated) metagenome datasets. Sequence alignment of reads against the host genome (if requested) and against microbial Genbank is performed using a new DNA aligner called SASS. The output of SASS is processed so as to assign all microbial reads to taxa and genes, using a new weighted version of the LCA algorithm. MetaScope is the winner of the 2013 DTRA software challenge entitled “Identify Organisms from a Stream of DNA Sequences”.
Department of Computer Science and Center for Bioinformatics, University of Tübingen, Sand 14, 72076 Tübingen, Germany
Life Sciences Institute, National University of Singapore, #05-02 28, Medical Drive Singapore 117456 Singapore
Human Longevity Incorp., Singapore
Metagenomics is the study of microbes using DNA sequencing[1]. One major area of application is the human microbiome[2] with the aim of understanding the interplay between human-associated microbes and disease. Other areas of metagenomic research include water[3], waste-water treatment[4], soil[5] and ancient pathogens[6]. Another envisioned area of application metagenomics is in bio-threat detection, for example, when a group of individuals becomes infected by an unknown agent and the goal is to quickly and reliably determine the identity of the pathogens involved.
In 2013 the Defense Threat Reduction Agency (DTRA) sponsored an algorithms competition entitled “Identify Organisms from a Stream of DNA Sequences” with a one million dollar prize. Proposed solutions “must generate equivalent identification and characterization performance regardless of the sequencing technology used” and “…must achieve this in a timeline that is substantively shorter than possible with currently available techniques.” The challenge provided nine test datasets for analysis and proposed results were scored based on the correctness of organisms identified (organisms score), reads assigned (reads score) and genes identified (genes score). This paper describes the winning entry.
Such analysis requires the comparison of a large number of sequencing reads (typically millions of reads) against a large reference database (typically many billions of nucleotides or amino acids). Hence, tools that address this type of problem must be very fast. Because current reference databases only represent a small fraction of the sequence diversity that exists in the environment[7], such tools must also be very sensitive.
MetaScope performs very fast and very accurate analysis of metagenome datasets, including the removal of host reads, if required. MetaScope employs a new fast and sensitive DNA aligner called SASS. The aligner is first used to compare a given set of metagenomic sequencing reads against a host genome, if available, so as to discard reads that probably come from the host genome. The remaining reads are then compared against microbial Genbank[8] using SASS. A second program called Analyzer processes the output of SASS and maps the reads to taxa and genes using a novel variant of the LCA algorithm[9]. The output is written in XML and can, for example, be loaded into the metagenome analysis program MEGAN[10] for further processing.
Like BLAST[11], SASS uses a seed-and-extend approach to alignment. To achieve both high speed and high accuracy, SASS uses spaced seeds[12, 13], a hash-table for seed lookup and is implemented as a parallel algorithm in C++[14]. A crucial heuristic decision is when to extend a given seed match so as to compute a full alignment. SASS uses Myers’ bit vector algorithm[15] and a gain-based termination criterion to decide this. In the context of host-genome filtering, the score obtained in this way is used as a proxy for the full local alignment score and the extension phase is not used.
Removal of all reads that align to the host genome does not completely resolve the problem of false positive taxon assignments because many viruses and vector sequences in Genbank contain human sequences. Hence, in a preprocessing step, we use SASS to compare the viral and vector portion of Genbank against the human genome and then mask every region of the reference sequences that has a significant alignment to some host sequence.
The assignment of reads is often performed using the naive LCA algorithm[9] in which a read is placed on the lowest-common ancestor of all taxa in the NCBI taxonomy for which the read has a high-scoring alignment to a corresponding sequence in the reference database. As the naive LCA algorithm analyses each read in isolation, in the presence of many similar reference sequences from different species, the result is often very unspecific placement of reads. To overcome this, MetaScope uses a new weighted LCA algorithm that proceeds in two steps. First, the naive LCA algorithm is used to assign a weight to each reference sequence, reflecting the number of reads that are assigned to the corresponding species and have a significant alignment to that reference sequence. Then each read is placed on the taxon node that covers 75% (by default) of the total weight of all reference sequences that have a significant alignment with the read.
MetaScope predicts genes based on which annotated genes the alignments of a read overlap with. A read will often align to many different reference sequences and so the potential number of genes to report for a single read can be quite large, containing many false positives. To address this, all genes that are partially overlapped by some alignment of a read are ranked by the weight of the corresponding reference sequence and by the proportion of the gene sequence covered by any reads, and a small number of top ranked genes are reported.
The results obtained by MetaScope on the nine DTRA datasets are listed in Table 1. Slightly different algorithmic parameters are used based on the different sequencing platforms, as described in the Materials section. The accuracy score ranges from and the run time ranges from to minutes per dataset.
| (1) | (2) | (3) | (4) | (5) | (6) | (7) | (8) | (9) | (10) |
|---|---|---|---|---|---|---|---|---|---|
| Name | Sequencing | Number | Average | Seq. | Total | Org. | Reads | Genes | Time |
| platform | of reads | length | acc. | score | score | score | score | (mins) | |
| Testing1 | PacBio | 92 948 | 1883 | 83 | 90.074 | 100 | 85 | 85 | 7:48 |
| Testing2 | PacBio | 98 323 | 1837 | 83 | 98.747 | 100 | 98 | 98 | 8:24 |
| Testing3 | Ion-Torrent | 379 028 | 160 | 98 | 91.949 | 85 | 93 | 96 | 6:28 |
| Testing4 | Roche-454 | 399 671 | 363 | 99 | 91.595 | 75 | 99 | 99 | 6:47 |
| Testing5 | Illumina | 5 550 655 | 150 | 100 | 91.538 | 93 | 99 | 82 | 6:14 |
| Testing6 | Illumina | 6 038 557 | 150 | 100 | 95.357 | 100 | 100 | 86 | 7:27 |
| Testing7 | Ion-Torrent | 323 028 | 159 | 98 | 92.258 | 83 | 99 | 94 | 4:20 |
| Testing8 | Roche-454 | 351 799 | 263 | 99 | 96.843 | 100 | 100 | 90 | 4:49 |
| Testing10 | Illumina | 6 164 558 | 151 | 100 | 97.803 | 100 | 100 | 93 | 12:10 |
We have also investigated the use of an intermediate assembly step (except for PacBio reads). In more detail, all reads that did not align to the host genome (human) were presented to the Newbler assembler[16] as input. The obtained contigs and all unassembled reads were aligned against microbial Genbank using SASS. The output of this was then processed as described above and all assembled reads inherited the taxon assignment of their containing contigs. The results produced by this approach scored equally high as those reported in Table 1, but not better, so we did not pursue this further.
We plan to make Metascope freely available from http://www.metascope.net.
Methods
0.1 Overview
MetaScope is able to accurately analyze millions of sequencing reads in minutes. The MetaScope pipeline takes a file of sequencing reads in FastQ or FastA format as input and produces a report file in XML format as output. The input file represents an host-associated metagenome sample and the aim of MetaScope is to determine the taxonomic and functional content of the non-host portion of the sample. For each organism detected in the input file, the report file contains an estimation of its relative amount, the list of all reads assigned to the organism and the list of all genes identified for the organism.
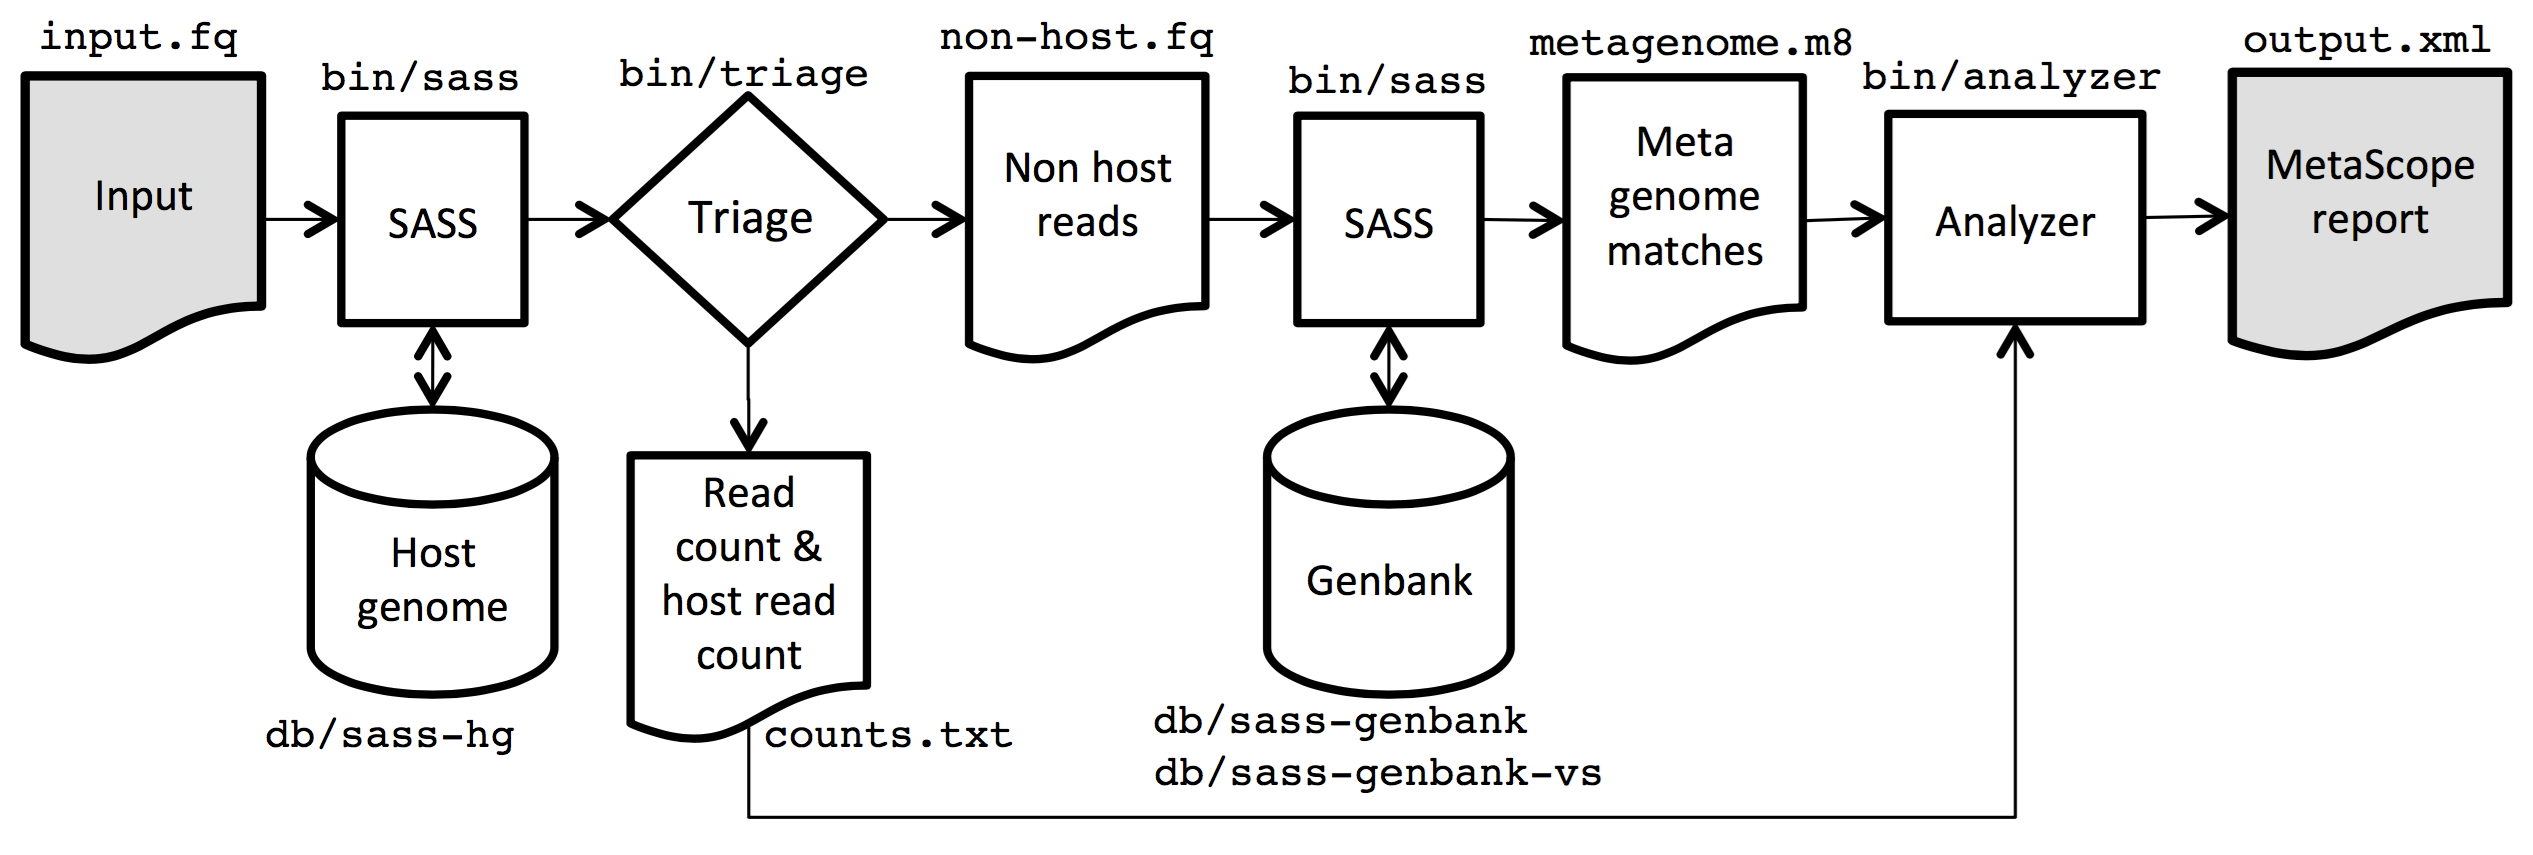
The MetaScope pipeline (see Figure 1) is invoked using the command metascope platform reads work output. The four arguments specify the sequencing platform (one of Illumina, 454, IonTorrent or PacBio), an input file containing all reads in FastQ format, a sample-specific working directory where intermediate files are to be placed, and the name of the output file. In addition, any part of the pipeline can be run individually with more control over programming parameters.
First, the program SASS is used to compare all reads in the input file against the host genome. All detected alignments between reads and the host genome are written to a file called host.m8. Second, a script called triage uses the alignments in host.m8 to count the host reads and to write all non-host reads to a file called non-host.fq. Third, SASS compares the set of all non-host reads against Genbank. All found alignments are written to a file called metagenome.m8. The number of reads and host reads, and the file of all metagenome alignments are provided as input to the MetaScope analyzer, which produces the final MetaScope report output.xml in XML format.
0.2 Sequence alignment
The main computational bottleneck in metagenome analysis is the comparison of the reads against a host database, in the case of a host-associated sample, and then against a comprehensive collection of bacterial and viral sequences, such as Genbank[8]. To address this problem in an efficient manner, MetaScope introduces a new sequence alignment tool called SASS (an acronym for “sequence alignment using spaced seeds”). SASS is written in C++ and uses SeqAn[14] and Boost[17].
Designed to target significant alignments with a bit score of at least 50, SASS aligns DNA sequencing reads at about 50-100 times the speed of discontiguous MegaBLAST[13]. Like BLAST, SASS attempts to exhaustively determine all significant alignments, which is crucial for accurate taxonomic analysis.
Fast pairwise alignment programs usually follow the seed-and-extend paradigm[11]. In this two-phase approach, first one searches for exact matches of small parts of the query sequence in the reference database, such seed matches are evaluated and those deemed promising are then followed up in an extend phase that aims at computing a full alignment.
Existing approaches typically employ an index data structure for the reference database in order to quickly compute all seed matches between the query sequence and the reference. For example, Bowtie2[18] and BWA[19] use a compressed FM-index, which is very memory efficient, but at the expense of a slower access time. In contrast, SASS uses a hash table, which requires more memory, but is much faster. The high speed of the index allows SASS to achieve high speed and good sensitivity even when aligning low quality reads such as produced by PacBio and Ion Torrent sequencers.
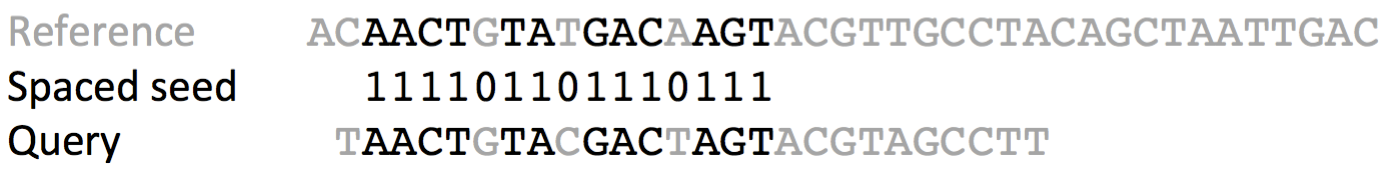
Most aligners employ a simple seed shape that consists of a short word of consecutive positions. The choice of seed length is based on a trade-off between sensitivity and speed. A hash table index permits the use of spaced seeds. These are longer seeds in which only a subset of positions are used (see , as Figure 2). The number and exact layout of the utilized positions are called the weight and shape of the spaced seed, respectively. Spaced seeds are known to perform better than simple seeds in terms of the speed/sensitivity trade-off[12, 13]. By default, SASS uses a single spaced seed, 111110111011110110111111[20].
To sustain the high throughput achieved in the seeding phase, we attempt to avoid unnecessary Smith-Waterman computations in the extension phase. To this end, we evaluate seed matches using a modified version of Myers’ bit vector algorithm for approximate string matching[15], which computes the edit distance between two short patterns encoded in machine words using fast bit-parallel operations. Starting from the location of a seed match, an alignment is extended in both directions by block-wise invocation of Myers’ algorithm in conjunction with a termination criterion based on the score gain. Tentative scores are calculated that approximate the full BLAST score. A full banded Smith-Waterman alignment[21] is only performed on the 100 (by default) best tentative alignments for a read, thus producing accurate standardized BLAST alignment scores for them.
In the case of a host-associated sample, the first step is to identify all reads that come from the host organism. To address this, SASS is used to compare all reads against the host genome. For human, we used assembly release CRCh37 downloaded from NCBI in June 2013. The output of SASS is written to a file called host.m8. To reduce the running time of this calculation, here we compute only the approximated score for any alignment and do not perform a full Smith-Waterman calculation.
Based on the host alignments detected in the previous step, a simple Perl script called triage is then used to determine all reads that do not have a significant alignment to the host genome and only these reads are considered in the downstream analysis. Here, an alignment is considered significant if it has an expected score of less than . These reads are placed in a file called non-host.fq. An additional file, counts.txt is generated that contain the total number of reads and the number of reads that have a significant alignment to the host genome.
Then SASS is used to compare all non-host reads reads (contained in non-host.fq) against a large portion of Genbank (consisting of all bacterial, viral, phage and synthetic sequences), downloaded from NCBI in June 2013. The resulting alignments are placed in a file called metagenome.m8.
SASS uses two different indices for Genbank, depending on the quality and quantity of the sequencing reads. For high quality and high quantity input samples SASS uses an index that is optimized for speed (using longer seeds) whereas for samples of lesser sequencing quality and smaller size, SASS uses an index that is optimized for sensitivity (using shorter seeds).
The files counts.txt and metagenome.m8 form the basis of MetaScope’s taxonomy and gene content analysis, as described in the following sections.
0.3 Taxonomic analysis
The number of reads and host reads, and the file of all metagenome alignments obtained using SASS are provided as input to the MetaScope analyzer, a Perl script that produces the final MetaScope report output.xml in XML format.
The analyzer uses three criteria to decide which alignments are deemed significant and all non-significant alignments are ignored in all subsequent analysis steps. The first criterion is a minimum alignment bit score (option minscore, default is 50). Second, for each read we only consider alignments that have maximal bit score, or that are within of the top score, where is set by a user option called .
The third criterion, which is only applied to Illumina reads, aims at ensuring that a significant alignment covers a large proportion of the corresponding read. Because the quality of an Illumina read tends to degrade toward the end of the read, we calculate the proportion of read covered as alignment length divided by “covered prefix length”, where the latter is the length of the prefix of the read up to the last base that is covered by the alignment. In more detail, an alignment must fulfill to be deemed significant, where and are the alignment start and end position on the read and minover is a user-specified parameter (default is ).
Weighted LCA
The assignment of reads to taxa based on a set of alignments to a reference database is often performed using the naive LCA algorithm[9] in which a read is placed on the lowest-common ancestor of all taxa in the NCBI taxonomy for which the read has a high-scoring alignment to a corresponding sequence in the reference database. This approach is quite conservative and does not work well when there are multiple closely related references in the database, as these will move the assignment to higher level on the phylogenetic tree.
To overcome this, MetaScope uses a new weighted LCA algorithm that proceeds in two rounds. In the first round, the naive LCA is applied to all reads. During this process, each reference sequence is assigned a weight that is the number of reads that have a significant alignment to that reference sequence and for which the naive LCA assigns the read to the same species that the reference sequence has. Reference sequences that are not assigned a weight in this way are assigned weight .
In the second round, each read is then assigned to the lowest taxonomic node that lies above a fixed proportion (user parameter lca default value ) of the sum of weights of reference sequences to which the read has a significant alignment. The lowest rank that we consider here is that of species. Reads that are assigned to a sub-species or strain are moved up to the species level.
To address the problem of over-aggressive taxa assignment, for each assigned taxa node, we calculate and report the average alignment identity between the reads assigned to this node and the reference sequences. If the average identity is below 90% for a species level taxa node, a low_identity tag is reported in the XML output to indicate that a species-level assignment might be too aggressive.
Strain level assignment
Our implementation of the weighted LCA assigns reads down to the level of species, but not further. If the user requests strain-level analysis (option strain) then the analyzer proceeds as follows. For each read that is assigned to a species node, we consider all alignments whose bit score are within percent of the best score for the read, where is determined by a user parameter strain_top (default value 10%). If a significant proportion (controlled by a user parameter strain_lca, default 80%) of the best alignments agree on a strain and these alignments have high sequence identity (controlled by parameter strain_iden, default 95%), then the read is tentatively assigned to that strain. A strain is reported, if a significant proportion (controlled by parameter strain_report, default 80%) of the reads previously assigned to the species are tentatively assigned to the strain.
Gene prediction
To decide which genes to report for a given read, MetaScope produces two separate lists of all genes that are partially covered by an alignment of the read. The first list is ranked by descending weight of reference sequence (as described above) and the second is ranked by descending coverage of genes (that is, by the number of bases of the gene covered by any significant alignment of any read). By default, Metascope reports the top five genes (user parameter maxgene) from each of the two ranked lists.
0.4 Supporting data generation
Data source
All supporting data for MetaScope were downloaded from NCBI. The URLs for the data source are as follows:
-
•
Human genome data: ftp://ftp.ncbi.nlm.nih.gov/genomes/H_sapiens/
-
•
GenBank data in ASN.1 format: ftp://ftp.ncbi.nih.gov/ncbi-asn1/
-
•
GenBank data in Genbank format: ftp://ftp.ncbi.nih.gov/genbank/
-
•
Taxonomy data: ftp://ftp.ncbi.nlm.nih.gov/pub/taxonomy/
Masking Human-like reference sequences
Because virus and synthetic constructs often contain human sequences, we decided to mask all human-like regions in those sequences in our working version of the GenBank microbial database. To do this, we built a SASS index for the human genome reference in sensitive mode (SASS option --index-mode 2). All virus and synthetic construct sequences were then shredded into 100bp fragments with 50bp overlap. We used SASS to align the shredded sequences against the human reference. If a shredded sequence aligned to the human genome with an alignment of 50 bases or more, and at least 80% identity, then the source region of the shredded sequence covered by the alignment was masked by replacing all nucleotides by N’s.
Data preprocessing
DNA sequences were first extracted from GenBank ASN.1 data. Only sequences under GenBank BCT, VRL, PHG, and SYN sections were included. The four sections cover all GenBank sequences from bacteria, archaea, virus, phage, and synthetic constructs.
A mapping of GI numbers to NCBI taxon identifiers was extracted from the GenBank ASN.1 files. We also extracted taxonomic lineage information for each reference sequence from these files, rather than from the NCBI taxonomy dump file because only the ASN.1 files contain the correctly labeled strain description of reference sequences. The NCBI taxonomy file was used to complement the ASN.1-derived taxonomy data.
Information on protein coding regions, such as location, protein accession number, locus tag, description, was extracted from the GenBank flat files.
The set of scripts used to download process all reference data is distributed in the aux folder of the MetaScope package.
0.5 Parameters
The output of different sequencing platforms varies in three main aspects, namely the number of reads produced, the average read length and the sequence quality. Individual Illumina datasets usually consist of millions of reads with a read length of hundreds of base pairs. Roche-454 datasets usually have less than one million reads, with a read length approaching 1000 bp. Ion Torrent datasets contain hundreds of thousands of reads, hundreds of base pairs long, with a lower level of quality than the afore mentioned datasets. Finally, PacBio datasets are usually smaller yet, with read lengths of thousands of base pairs, with a very high level of errors.
| Platform | SASS Index | top | minover |
|---|---|---|---|
| Illumina | normal | 0.05 | 0.9 |
| Ion Torrent | sensitive | 0.05 | 0 |
| Roche 454 | normal | 0.05 | 0 |
| PacBio | sensitive | 0.1 | 0 |
| Unspecified | normal | 0.05 | 0 |
To address these differences, MetaScope uses slightly different parameter settings depending on which sequencing platform was used to generate the input (see Supplement Table 2). For datasets with higher error rates and smaller size, the pipeline uses SASS’ sensitive Genbank index so as to improve the detection of significant alignments in the presence of sequencing errors. Moreover, in the taxonomic analysis of such data, the pipeline employs a relaxed LCA with a top setting of 10% so as to help avoid unreliable placement of reads for PacBio data, but 5% for other platforms. Because Illumina datasets usually contain millions of reads, here a even small sequence error rate can lead to a large number of wrongly assigned reads. Hence, for Illumina we use a minover setting of 0.9 to ensure that significant alignments cover at least 90% of the high quality end of a read.
The MetaScope parameters employed in the DTRA challenge differ slightly from the default settings recommended in Table 2 due to the specific nature of the DTRA testing datasets. Their metagenomic reads appeared to have originated from organisms whose genome sequences are well represented in Genbank and thus they usually have a top-scoring alignment to the correct species (but also to many others). In this situation, we were able to set top to for all sequencing technologies except for PacBio, were was used to accommodate for the high rate of sequencing errors in PacBio data.
The default value for the maxgene parameter (that controls the number of genes reported per read) is , as this value works well on all DTRA challenge datasets. However, for the DTRA challenge Roche-454 datasets we used a value of so has to achieve a particularly high gene score so as to compensate for low organisms scores on the Roche-454 test datasets.
Acknowledgements
This research is partially supported by the National Research Foundation and Ministry of Education Singapore under its Research Centre of Excellence Programme.
Author contributions
All authors contributed equally to the development and implementation of the described software.
Bibliography
References
- [1] Handelsman, J. Metagenomics: Application of genomics to uncultured microorganisms. Microbiology and Molecular Biology Reviews 68, 669–685 (2004).
- [2] Turnbaugh, P. J. et al. The Human Microbiome Project. Nature 449, 804–810 (2007).
- [3] Rusch, D. B. et al. The Sorcerer II Global Ocean Sampling expedition: northwest Atlantic through eastern tropical Pacific. PLoS Biol 5, e77 (2007). URL http://dx.doi.org/10.1371/journal.pbio.0050077.
- [4] Albertsen, M., Hansen, L. B., Saunders, A. M., Nielsen, P. H. & Nielsen, K. L. A metagenome of a full-scale microbial community carrying out enhanced biological phosphorus removal. ISME J (2011). URL http://dx.doi.org/10.1038/ismej.2011.176.
- [5] Mackelprang, R. et al. Metagenomic analysis of a permafrost microbial community reveals a rapid response to thaw. Nature 480, 368–371 (2011).
- [6] Schuenemann, V. J. et al. Targeted enrichment of ancient pathogens yielding the ppcp1 plasmid of yersinia pestis from victims of the black death. Proceedings of the National Academy of Sciences 108, E746–E752 (2011). URL http://www.pnas.org/content/108/38/E746.abstract. http://www.pnas.org/content/108/38/E746.full.pdf+html.
- [7] Wu, D. et al. A phylogeny-driven genomic encyclopaedia of bacteria and archaea. Nature 462, 1056–1060 (2009).
- [8] Wheeler, D. L. et al. Database resources of the National Center for Biotechnology Information. Nucleic Acids Res 36, D13–D21 (2008). URL http://dx.doi.org/10.1093/nar/gkm1000.
- [9] Huson, D. H., Auch, A. F., Qi, J. & Schuster, S. C. MEGAN analysis of metagenomic data. Genome Res 17, 377–386 (2007). URL http://dx.doi.org/10.1101/gr.5969107.
- [10] Huson, D. H., Mitra, S., Weber, N., Ruscheweyh, H.-J. & Schuster, S. C. Integrative analysis of environmental sequences using MEGAN 4. Genome Research 21, 1552–1560 (2011).
- [11] Altschul, S. F., Gish, W., Miller, W., Myers, E. W. & Lipman, D. J. Basic local alignment search tool. Journal of Molecular Biology 215, 403–410 (1990).
- [12] Burkhardt, S. & Kärkkäinen, J. Better filtering with gapped q-grams. Fundamenta Informaticae XXIII, 1001–1018 (2001).
- [13] Ma, B., Tromp, J. & Li, M. PatternHunter: faster and more sensitive homology search. Bioinformatics 18, 440–445 (2002).
- [14] Döring, A., Weese, D., Rausch, T. & Reinert, K. SeqAn an efficient, generic C++ library for sequence analysis. BMC Bioinformatics 9, 11–11 (2008).
- [15] Myers, E. A fast bit-vector algorithm for approximate string matching based on dynamic programming. Journal of the ACM 46, 395–415 (1999).
- [16] Margulies, M. & et al. Genome sequencing in microfabricated high-density picolitre reactors. Nature 437, 376–380 (2005).
- [17] Siek, J., Lee, L.-Q. & Lumsdaine, A. Boost random number library. http://www.boost.org/libs/graph/ (2000).
- [18] Langmead, B. & Salzberg, S. Fast gapped-read alignment with Bowtie 2. Nat Meth 9, 357–359 (2012).
- [19] Li, H. & Durbin, R. Fast and accurate short read alignment with Burrows-Wheeler transform. Bioinformatics (Oxford, England) 25, 1754–1760 (2009).
- [20] Ilie, L., Ilie, S., Khoshraftar, S. & Bigvand, A. M. Seeds for effective oligonucleotide design. BMC Genomics 12, 280 (2011).
- [21] Smith, T. F. & Waterman, M. S. Identification of common molecular subsequences. JMB 147, 195–197 (1981).