Capillary rise dynamics of liquid hydrocarbons in mesoporous silica as explored by gravimetry, optical and neutron imaging: Nano-rheology and determination of pore size distributions from the shape of imbibition fronts
Abstract
We present combined gravimetrical, optical, and neutron imaging measurements of the capillarity-driven infiltration of mesoporous silica glass (Vycor) by hydrocarbons. Square-root-of-time Lucas-Washburn invasion kinetics are found for linear alkanes from n-decane (C10) to n-hexacontane (C60) and for squalane, a branched alkane, in porous monoliths with 6.5 nm or 10 nm mean pore diameter, respectively. Humidity-dependent experiments allow us to study the influence on the imbibition kinetics of water layers adsorbed on the pore walls. Except for the longest molecule studied, C60, the invasion kinetics can be described by bulk fluidity and bulk capillarity, provided we assume a sticking, pore-wall adsorbed boundary layer, i.e. a monolayer of water covered by a monolayer of flat-laying hydrocarbons. For C60, however, an enhanced imbibition speed compared to the value expected in the bulk is found. This suggests the onset of velocity slippage at the silica walls or a reduced shear viscosity due to the transition towards a behaviour typical of polymer-like flow in confined geometries. Both, light scattering and neutron imaging, indicate a pronounced roughening of the imbibition fronts. Their overall shape and increase in width can be resolved by neutron imaging. The fronts can be described by a superposition of independent wetting fronts moving with pore size-dependent square-root-of-time laws and weighted according to the pore size distributions obtained from nitrogen gas sorption isotherms. This finding indicates that the shape of the imbibition front in a porous medium, such as Vycor glass, with interconnected, elongated pores, is solely determined by independent movements of liquid menisci. These are dictated by the Young-Laplace pressure and hydraulic permeability variations and thus the pore size variation at the invasion front. Our results suggest that pore size distributions can be derived from the broadening characteristics of imbibition fronts.
keywords:
imbibition , alkanes , radiography , nanopore , wetting , porosimetry , porous media1 Introduction
Confinement of liquids in pores plays a dominant role in phenomena ranging from clay swelling, oil recovery, wet adhesion and catalysis, to drug delivery, self-assembling, protein folding and transport across artificial nanostructures, bio-membranes and tissues [1, 2, 3, 4, 5, 6, 7, 8, 9, 10, 11, 12, 13, 14, 15, 16, 17, 18, 19, 20]. Porous media are also gaining an increasing relevance in template-assisted (electro-)deposition of nano structures [21, 22, 23, 24] and in the synthesis of soft-hard hybrid materials [25, 26, 27, 28, 29, 30, 31] by melt-infiltration [32], for example in the field of battery and supercapacitor design [33] and for the preparation of multifunctional structural materials [34, 35].
In particular, transport in nanoporous media is of relevance in micro- and nanofluidics [36, 37, 38, 39, 40, 41, 42, 43, 44, 45, 46, 47, 48, 49, 50, 51, 52]. It is both of scientific and technological interest, whether macroscopic wetting and electrowetting properties [53, 54] or values of fluid parameters, such as the viscosity , surface and interfacial tensions , accurately describe a liquid down to very small length scales, on the order of the size of its building blocks [55, 56, 57, 58]. Measurements with the surface-force apparatus (SFA) allow one to study shear viscosities [59, 60, 61, 62, 63, 64, 65] and frictional properties [66, 67, 68] of thin films with thicknesses down to sub-nanometers. They have revealed that in confinement, depending on the shear rate, the type of molecule and the surface chemistry, viscosity values quite different from the bulk values or in remarkable agreement with the bulk ones can be found.
Moreover, given for example the small number of molecules in a crosssection of a nano pore and the importance of wall effects, the validity of the continuum approach of classical hydrodynamics is questionable in restricted geometries. The velocity profile in the proximity of the confining walls plays a crucial role in the determination of the overall transport rates in nanoporous media. Today, it is established that the core concept of “no-slip at the wall” is valid only provided that certain conditions are met: a single-component fluid, a wetted surface, and low levels of shear stress. In many engineering applications these conditions are not fulfilled and studies sensitive to the near-wall velocity profiles have revealed that slippage, that is a finite velocity of the liquid at the wall can occur in systems with surfactants, at high shear rates, for low wettability and low roughnesses of the confining walls [69, 70, 71, 72, 73, 74, 75, 76, 50].
Pioneering experiments to probe transport behaviour through mesoporous media were performed by Nordberg [77] and Debye and Cleland in the mid of the last century [78]. Nordberg studied water and acetone flow, whereas Debye and Cleland reported on the flow of a series of linear hydrocarbons (n-pentane to n-octadecane) through mesoporous silica (Vycor glass, mean pore radius nm). Flow rates in agreement with Darcy’s law, the generalisation of Hagen-Poiseuille’s law for simple capillaries towards porous media [79, 80], were observed. As Abeles et al. [81] demonstrated by an experimental study on toluene using also nanoporous Vycor glass, depending on the size of the pores and on the temperature and pressure of the fluid, flow in porous media can be through gas (or Knudsen diffusion [38]), surface diffusion, and viscous liquid flow driven by capillary forces (termed “spontaneous imbibition”) or by external hydraulic pressure (called “forced imbibition”).
In the following, we focus on spontaneous imbibition of selected linear hydrocarbons (normal alkanes) and one branched alkane (squalane) in a monolithic mesoporous medium. We demonstrate that by a combination of gravimetrical, optical and neutron imaging experiments detailed insights with regard to the capillarity-driven flow properties of hydrocarbons in this mesoporous glass can be gained. Moreover, we present evidence that the roughening of the imbibition front in a network of elongated pores with random radii, such as Vycor, contains important information on the pore size distribution of the porous medium. In fact, based on the observed imbibition kinetics, we derive a pore size distribution from the broadening kinetics which is in remarkable agreement with the pore size distribution derived from nitrogen gas sorption experiments.
2 Theory of capillary rise dynamics
The capillary rise of a wetting liquid beyond its bulk reservoir is a well-known phenomenon. From the physicist’s point of view it is a classical example of interfacial physics. Its driving force is given by the Laplace pressure
| (1) |
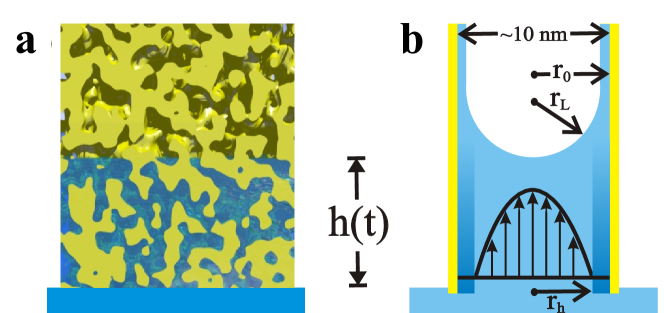
acting on the curved meniscus of the liquid in a pore with radius and contact angle . The effective radius is reduced with respect to because of the adsorption of water molecules on the pore walls prior to contact start – see Fig. 1(b) for a schematic illustration. For high-energy surfaces like silica under standard laboratory conditions (humidity between 20 % and 40 %) such condensation processes are inevitable and not negligible in practice. Therefore, the difference between and is important. Of course, this effect also causes a reduction of the available volume porosity ( with ) since pore space is occupied by water and hence no longer available. The exact value of the initial porosity is accessible by a thorough analysis of the overall mass uptake of the sample.
For a typical alkane with surface tension mN/m (and ) Eq. (1) yields pressures up to 200 bar in pores with radii in the nanometer range. As a direct consequence, the hydrostatic pressure of the order of some millibars (for the rise heights of a few centimeters considered here) can be neglected in the description of the imbibition process so that gravity is not important. Hence, the driving pressure is solely determined by the Laplace pressure: .
This is in strong contrast to common capillary rise experiments with channel diameters in the order of some hundred micron. Here, after the liquid has advanced some centimeters, the hydrostatic pressure compensates the Laplace pressure and the rise process comes to a standstill. Moreover, the rise dynamics are so fast that – without any additional instruments – one can only observe the static equilibrium configuration at the end of the process. Experiments with mesoporous Vycor, by contrast, yield rise heights of some kilometers [82]. Furthermore, due to the much smaller pores, viscous drag is much more important and slows down the overall rise kinetics significantly. Typical rise times in our experiments are of the order of some hours or even days. This fact allows for a straight-forward recording of the dynamics by different means and a detailed quantitative analysis.
In order to describe the kinetics of the imbibition process one needs to consider the flow behaviour of a liquid in a porous substrate like Vycor. According to Ref. [83] this can be done applying Darcy’s law which states that the volume flow rate normalized by the sample’s cross-sectional area is given by
| (2) |
where is the sample’s height along which the driving pressure is applied, the viscosity, the tortuosity, and the hydrodynamic radius of the pore. The latter coincides with the radius over which the flow profile is established in the pore – see Fig. 1(b) for a schematic illustration. It does not necessarily have to agree with the pore radius because of either strongly adsorbed, immobile boundary layers of thickness (, i.e. ), or due to velocity slippage at the pore walls (). Only for the standard no-slip boundary condition is .
It is instructive to consider the network being composed of cylindrical (isotropically oriented) pores with radius , i.e. neglecting the size distribution of the pores and assuming a no-slip boundary condition. The sample’s volume porosity can then be expressed by and Eq. (2) becomes:
| (3) |
The latter relation illustrates the link between Darcy’s law (for a porous substrate with tortuous pores) and the single-channel flow rate following from the Hagen-Pouseuille law. Moreover, it shows the impact of the tortuosity . A value of of about three seems reasonable if one considers that in an isotropic medium such as Vycor, the porosity can, to first approximation, be accounted for by three sets of parallel capillaries in the three spatial directions; but only one third of these capillaries sustain the flow along the pressure drop. A value larger than three reflects the extended length of a meandering capillary beyond that of a straight one.
Following these preliminary considerations, one may now take the leap to the imbibition kinetics. In general, there are three characteristic regimes during a capillary rise process [84, 85, 86]: (i) The initial, ballistic regime when the fluid particles enter the pore. In this region, the transport is governed by competition between inertia and molecule/surface interactions resulting in a linearly increasing capillary rise height [87, 88, 89]. (ii) The regime where inertia and viscous forces compete with capillarity [87, 89]. (iii) The regime of viscous flow, where viscous forces prevail and act against the capillarity-driven liquid uptake by the porous medium [90, 91, 92]. For the time resolution of the present experiments, only regime (iii) is of relevance. The typical time that is required for the viscous flow to dominate in the pore can be estimated with [93] . This typically yields times on the order of some 10 ps.
In the viscosity-dominated regime of the capillary rise, the liquid encounters the pressure drop along a time-dependent length , equivalent to the actual rise height, meaning – see Fig. 1 for a schematic illustration. Moreover, with the initial porosity of the sample the permeated volume can be determined at any time to be . Accordingly, Eq. (2) becomes a simple differential equation
| (4) |
Equation (4) is solved by a law for [91, 92] to yield the rise height
| (5) |
as well as the sample’s mass increase due to the liquid uptake ,
| (6) |
Assuming the liquid bulk parameters to be still valid under mesopore confinement, following Eq. 4 and 5 the proportionality constant becomes:
| (7) |
Thus, can be inferred from both rise height () and mass increase () measurements. As is determined by only matrix-specific quantities (and in particular no liquid properties) it should be a constant for matrices with identical internal structure and chemical composition – independent of the imbibed liquid. Therefore we will refer to as imbibition ability. The larger the faster is the imbibition process. The unit of is inverse square-root of length. It is directly proportional to the square root of the pore dimensions expressed by a pore radius (as can be easily seen by applying ). Hence, the liquid will rise faster in larger pores.
The concept of the imbibition ability enables a direct comparison of measurements with different liquids. Measuring the homologous series of n-alkanes, this approach should reveal any influence of the chain length as . Furthermore, its absolute value contains information on the nanoscopic flow behaviour, especially on the hydrodynamic radius and hence on the exact hydrodynamic boundary condition. Thus, our measurements provide an ideal method for studying the liquid dynamics in the proximity of interfaces as well as in extreme confinement.
3 Materials and methods
3.1 Porous glass substrates
The spatial restrictions in the nanometer range were provided by the sponge-like topology of porous Vycor glass (Corning, code 7930). Vycor is virtually pure fused silica glass permeated by a three-dimensional network of interconnected pores [94, 95, 96, 97]. The experiments were performed with two types of Vycor differing in the mean pore radius only. Their volume porosity is . For convenience the two types will be termed V5 ( nm) and V10 ( nm) in the following. The pore shape in Vycor glasses is to a first approximation ’cylindrical’ with an aspect ratio, i.e. ratio of pore diameter to pore length, larger than 1 as has been inferred from electron micrographs by an analysis of chord length distributions [94, 95, 96].
The matrix properties were determined by nitrogen sorption isotherms performed at 77 K. The isotherms are shown as insets in Fig. 2. We plot the filling , that is, the number of nitrogen molecules adsorbed by the matrix normalized by the amount of nitrogen necessary for its complete filling, versus the reduced vapor pressure . The pressure refers to the bulk vapor pressure of nitrogen at K and to the equilibration pressure after each adsorption or desorption step.
In a subsequent step, the isotherms were analyzed within a mean field model proposed by Saam and Cole [98] for cylindrical pore geometry. Using a trial-and-error technique, we calculated isotherms corresponding to preset pore size distributions and compared the results with our measurements. In several iterations the initial distributions were adjusted until calculations and experiments coincided adequately. The distributions obtained are shown as solid lines in Fig. 2, the associated isotherms are indicated by the solid lines in the insets of Fig. 2. Both Vycor samples seem to have an asymmetric distribution of pore radii with several larger but far more smaller pores.
Apart from the pore radii the capillary rise dynamics are also influenced by the network morphology [99, 100]. The simplest analytical approach in order to account for the spongelike structure of the sample (see Fig. 1(a) for an illustration) is the introduction of the so-called tortuosity . It can be inferred from experiments on the self-diffusion of liquids in porous Vycor compared to the fluid’s bulk kinetics . Small angle neutron scattering measurements of diffusion coefficients [101] resulted in . This value is in good agreement with simulations of Vycor’s pore morphology [102].
We cut regularly shaped blocks of height ( mm) from the delivered rods. Prior to use, we subjected them to a cleaning procedure with hydrogen peroxide and nitric acid followed by rinsing in deionized Millipore water and drying at 200 ∘C in vacuum for two days. This treatment ensures that any organic contamination is removed from the large internal surface of the samples. Until use, the samples were stored in a desiccator.
3.2 Liquid hydrocarbons
The Vycor matrices provide spatial restrictions of only a few nanometers, so they are only ten to 100 times larger than the typical molecular dimensions of simple liquids. Hence, it is not obvious that the standard assumptions of continuum fluid mechanics hold in a system where no more than 1000 molecules per cross-sectional area can be accommodated. To clarify this, we performed a systematic study of the flow dynamics in confinement as a function of the underlying complexity and structure of the liquid’s building blocks.
| alkane | info | (∘C) | (g/ml) | (mPa s) | (mN/m) | (nm) | |
|---|---|---|---|---|---|---|---|
| n-\ceC10H22 | Me99 | 25 | 0.7271 a) | 0.8835 a) | 23.49 a) | 1 | 1.34 |
| n-\ceC12H26 | Me99 | 25 | 0.7466 a) | 1.381 a) | 25.10 a) | 1 | 1.59 |
| n-\ceC14H30 | AA99 | 25 | 0.7595 a) | 2.086 a) | 26.21 a) | 1 | 1.84 |
| n-\ceC16H34 | Me99 | 25 | 0.7681 a) | 3.087 a) | 26.97 a) | 1 | 2.09 |
| n-\ceC18H38 | Fl99 | 36 | 0.7711 a) | 3.407 a) | 26.88 a) | 1 | 2.34 |
| n-\ceC20H42 | Al99 | 41 | 0.7748 b) | 4.06 c) | 27.12 d) | 1 | 2.59 |
| n-\ceC24H50 | Fl99 | 54 | 0.7768 b) | 4.948 c) | 29.78 d) | 1 | 3.09 |
| n-\ceC30H62 | Fl98 | 74 | 0.7765 b) | 5.47 c) | 26.56 d) | 1 | 3.84 |
| n-\ceC40H82 | AA97 | 91 | 0.7748 b) | 7.20 c) | 26.04 d) | 1 | 5.09 |
| n-\ceC60H122 | Fl98 | 107 | 0.7720 b) | 13.14 c) | 24.65 d) | 1 | 7.59 |
| \ceC30H62 s) | Me99 | 30 | 0.8016 b) | 22.13 c) | 28.14 d) | 1 |
The homologous series of linear hydrocarbons (n-alkanes, n-CnH2n+2) is well suited for this purpose. By extending the carbon backbone of the alkane one can change the molecule’s dimensions whilst all other liquid properties (density , surface tension , viscosity , contact angle with silica ) remain almost constant – see Tab. 3.2 for details. In particular, all alkanes completely wet silica which is the basic condition for spontaneous imbibition measurements in Vycor glass. For the main part of this study we used linear hydrocarbons ranging from n-decane (n-\ceC10H22) to n-hexacontane (n-\ceC60H122) corresponding to all-trans molecule lengths between 1 nm and approximately 8 nm. In addition, the branched alkane squalane (2,6,10,15,19,23-hexamethyltetracosane) was also studied in order to investigate the effects of the molecule’s internal structure as opposed to its length.
3.3 Experimental techniques
In this study, we combine three different measurement methods. The capillary rise dynamics of n-alkanes in porous Vycor glass have been recorded by using gravimetrical, optical as well as neutron radiography measurements.
3.3.1 Gravimetrical measurements
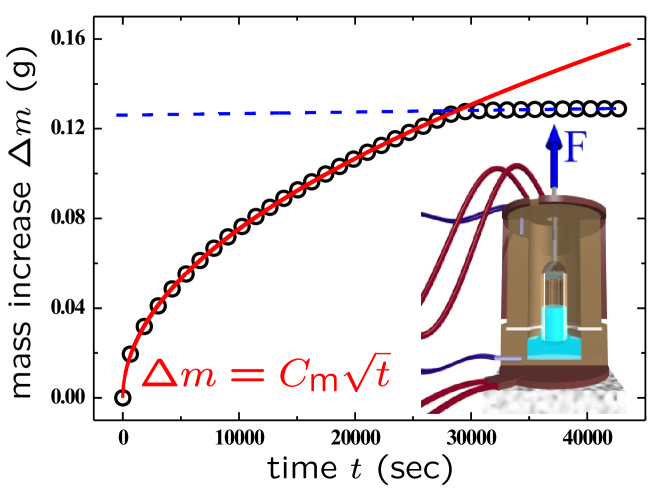
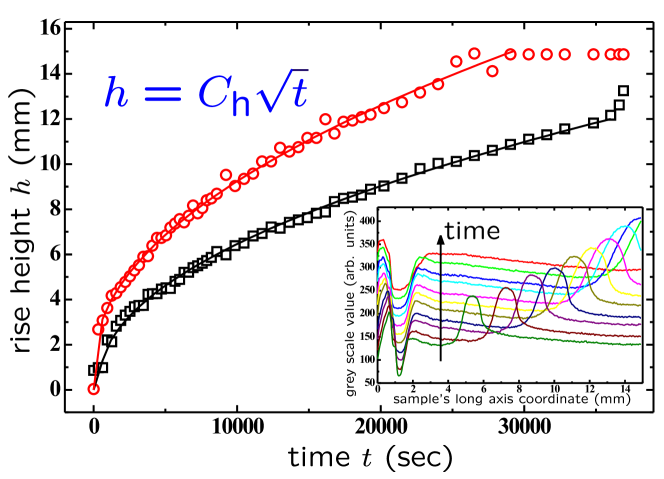
According to Eq. (6) the imbibition dynamics and hence the imbibition ability can be inferred from the increase in the sample’s mass due to liquid uptake during the imbibition experiment. Such gravimetrical measurements can be easily performed by means of a standard laboratory balance. The sample is attached to the balance with a special mounting, hence allowing time dependent recording of the gravitational force acting on the porous block. A surrounding copper cell enables thermostating of both the sample and the liquid reservoir [107] – see inset in Fig. 3 for an illustration. The measurement is started by moving the reservoir upwards until the liquid surface touches the bottom of the porous host. The rise process starts immediately after the contact.
3.3.2 Optical imaging
In case of room temperature measurements that do not require the thermostating copper jacket, the capillary rise process has also been followed optically by means of a CCD monochrome camera placed in front of the setup. At this point one might wonder whether we observed any optical signal. This question is justified as there is indeed no visual difference between the completely filled and the completely empty part of the sample. This is because the length scale of the spatial variations in the refractive index is far too small due to the pore-pore distances of only a few nanometers. Therefore, visible light is neither scattered in the completely empty nor in the completely filled parts of the block. Hence, the measurement of the actual rise height and a subsequent calculation of the imbibition ability via Eq. (5) is not possible.
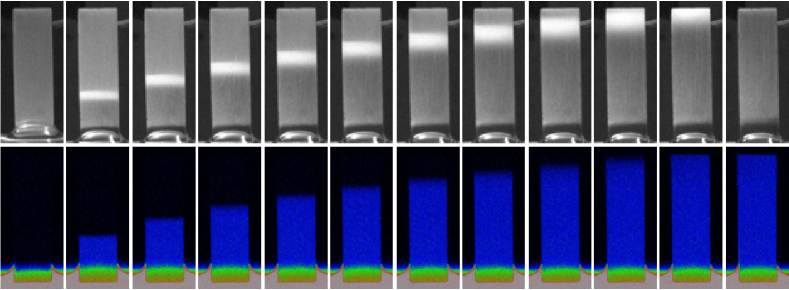
Nevertheless, during the imbibition, an opaque front moves from the bottom of the sample to its top, where it finally vanishes. During this process the front’s width gradually increases – see top row in Fig. 4. Following the above argument, the region of the block showing scattering can be neither completely filled nor completely empty. It contains regions of filled pores as well as still empty ones, resulting in variations of the refractive index on length scales including the wavelength of visible light. This leads to the scattering of light, a phenomenon well known from the emptying of completely filled Vycor samples via percolating paths [108, 109, 110] or collective rearrangements of pore condensate induced by phase transitions [111, 112, 113, 114] in porous glass. Its existence in this context shows that there is no sharp interface that separates the filled from the still empty sample, but an extended front separating the two regions. Unfortunately, the location and the width of the front can not easily be resolved by means of optical measurements alone as strong multiple scattering makes its analysis and hence the quantitative determination of the exact liquid distribution within the light-scattering front impossible. Thus we applied a different method, neutron radiography, that yields the local liquid concentration.
3.3.3 Neutron radiography
Neutron radiography is an ideal method to observe the imbibition dynamics in porous Vycor glass. This is because of the weak interaction of thermal neutrons with silica (total scattering cross sections barn) and oxygen ( barn) as opposed to hydrogen ( barn). Therefore it is easy to perform time-resolved quantitative measurements of the distribution of hydrocarbons within the almost transparent silica matrix. Furthermore, using aluminium ( 1.7 barn), sample cells and holders which only weakly interact with neutrons can be constructed.The experiments were performed at the ANTARES beamline of the Heinz Maier-Leibnitz (FRM II) research reactor of Technical University Munich in Garching, Germany [115].
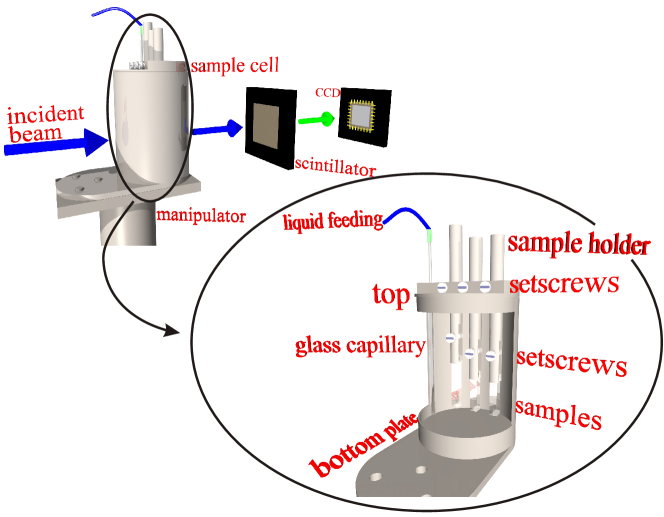
The general design of a neutron radiography experiment and a detailed view of the sample cell is illustrated in Fig. 5. The incident beam of cold neutrons has a maximum divergence of 0.3∘. At the location of the specimen the flux is approximately . After penetrating the sample cell and the samples, the attenuated neutron beam hits a ZnS+LiF detector for the space resolved detection of the neutron intensity. The emitted visible light is recorded by a camera with a CCD chip with pixel, which is - at the selected lens magnification - equivalent to a pixel size in the sample plane of m, giving a field of view of 32.7 32.7 cm2. The measurement is started by pumping the liquid into the initially empty sample cell until the liquid surface touches the bottom faces of the samples. For each image the CCD chip is exposed for a constant time interval of 30 s. This measurement time represents a compromise between sufficient statistics and the best time resolution making sure that no structural detail moved further than the spatial resolution thus avoiding smearing of the concentration profile of the liquid.
In the course of the analysis the obtained transmission images were all corrected using a reference image of the completely empty sample cell taken prior to the measurement of the sample and normalized to the incident beam intensity and detector efficiency using an image of the direct beam. A dark frame containing the constant camera offset and the dark noise signal has been subtracted from all images. The remaining signal is only caused by the liquid sucked in the sample. Therefore, the systematic evaluation of such images as a function of time provides detailed information about the imbibition dynamics. A series of such images is shown in the bottom row of Fig. 4 for n-tetradecane imbibing into a V10 sample 111Note that the same images were published erroneously in [116], which reports on the imbibition of water, although the images show the imbibition of n-tetradecane.. In the processed images, filled areas are coloured whereas still empty parts are not visible. At first sight they resemble the optical set of images in the top row of Fig. 4. But there are basic differences in the information contained: As mentioned previously the optical measurements only reveal qualitative information about the location of partly filled areas. On the other hand, neutrons are scattered by hydrogen, which has nearly equal mass, into 4 space. Thus, almost all scattered neutrons are removed from the path to the detector and hence the direct beam is attenuated, which appears effectively like absorption. Only a small part of the neutrons is scattered under small angles and reaches the detector as a diffuse background, which can be neglected for small amounts of hydrogen. Therefore, the attenuation in the radiography images is directly related to the local liquid concentration and, therefore, allows for a detailed quantitative analysis of the imbibition dynamics and the advancing liquid front based on the liquid distribution within the sample at any given time.
4 Results
4.1 Imbibition ability as a function of molecule length and humidity
For every alkane listed in Tab. 3.2 we performed gravimetrical measurements in V5 and V10. Each liquid/substrate combination was measured at least three times. From the -fits to the obtained mass increase data (as shown in Fig. 3) we extracted the proportionality constant . In combination with Eq. (6) this yields the imbibition ability . The results are shown in Fig. 6 as a function of all-trans molecule length for both V5 and V10.
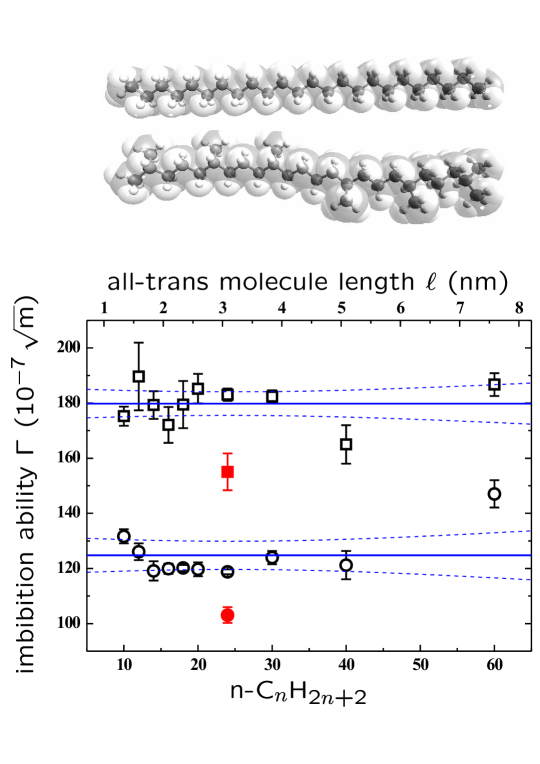
Fig. 6 shows that the measured imbibition abilities can be well described by the arithmetic averages over all measured linear alkanes; for V5 and for V10, respectively. Over a wide range of molecule lengths there is no effect on the imbibition kinetics. This statement is corroborated by the confidence intervals that broaden only slightly for the highest s and, hence, suggest that is -invariant. Apart from the squalane experiments a significant deviation can only be observed for n-hexacontane (n-\ceC60H122) in V5 which will be discussed below.
In addition, using a humidifier, measurements of n-hexadecane (n-\ceC16H34) invading into V5 were performed as a function of relative humidity. The resultant imbibition abilities are listed in Tab. 2 together with the extracted values of the initial porosities . No distinct influence of the humidity on the imbibition dynamics, except for the porosity changes, is detectable.
| RH (%) | () | |
|---|---|---|
| 24 | 0.275 | |
| 34 | 0.262 | |
| 50 | 0.245 |
4.2 Imbibition front broadening as revealed by optical and neutron imaging
Imbibition experiments of n-tetradecane (n-\ceC14H30) and n-hexadecane (n-\ceC16H34, only in V5, but as a function of the relative humidity) imbibing into porous Vycor were optically recorded in order to derive information on the light scattering front’s position and width. The obtained series of pictures (e.g. top row in Fig. 4) were evaluated. Based on time dependent transmission profiles we extracted the front’s upper and lower bound, thereby gaining information on its position and width.
The behaviour of the front in particular the upper and lower bounds of the light scattering front are illustrated in Fig. 7. Comparing the results with the -fits it is clear that both bounds follow the same time dependency as the rise height of a sharp imbibition front given by Eq. (5). This suggests that there is not only one but rather a whole series of imbibition fronts causing the sample to fill inhomogeneoulsy which leads to the observed light scattering. From the front’s upper and lower position, we have calculated -values using Eq. (5). This discussion will be continued later together with the neutron radiography results.
| matrix | fluid | RH (%) | of upper bound | of lower bound |
|---|---|---|---|---|
| V5 | C14 | 117.5 | 94.8 | |
| C16 | 24 | 122.7 | 99.2 | |
| 34 | 122.4 | 90.5 | ||
| 50 | 119.9 | 84.3 | ||
| V10 | C14 | 178.8 | 139.1 |
The optical and gravimetrical results are now compared with the detailed information on the imbibition process obtained from the neutron radiography measurements. We benefit from the sensitivity of this method to the local liquid concentration which results in time dependent information about the fluid distribution within the sample as visualized in the images in the bottom row of Fig. 4. Transmission profiles taken along the sample’s long axis represent the basis of the subsequent analysis. They were normalized in such a way that they directly provide the filling degree of the sample as a function of the height (see inset in Fig. 8).
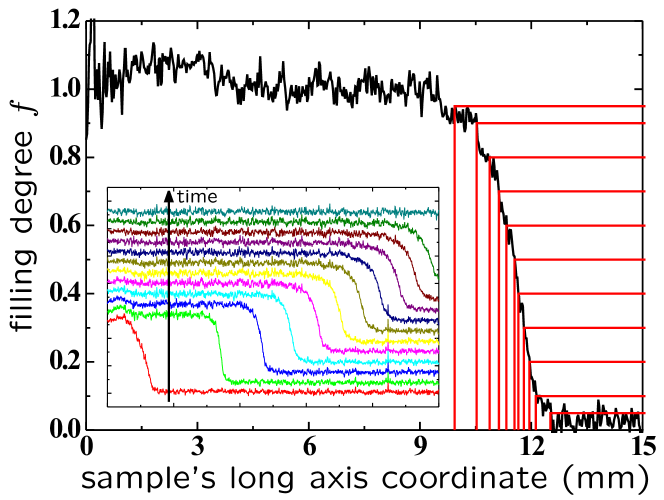
Looking at the profiles shown in Fig. 8(inset) it is clear that there is no sharp interface between the already completely filled () and the still empty part () of the sample. Comparable to the optical results, the advancing front exhibits roughening. Hence, a thorough investigation of the profiles must include the front’s average position as well as its shape. For this purpose each profile was analysed by means of the grid method illustrated in Fig. 8. For a series of filling degrees between zero and unity, we extracted the height at which the profile has a filling degree . Repeating this procedure for all profiles, and therefore at different times, results in a series of rise height curves .
It is not surprising that all these rise height curves again obey a -law. The -dependency is taken into account by normalization with the corresponding measurement for (inset of Fig. 9). It is evident that they all follow the same dynamic behaviour except for the time-independent prefactor , i.e. . Hence, the interface profiles all overlapp, provided one rescales the -axis of the -curves by a transformation .
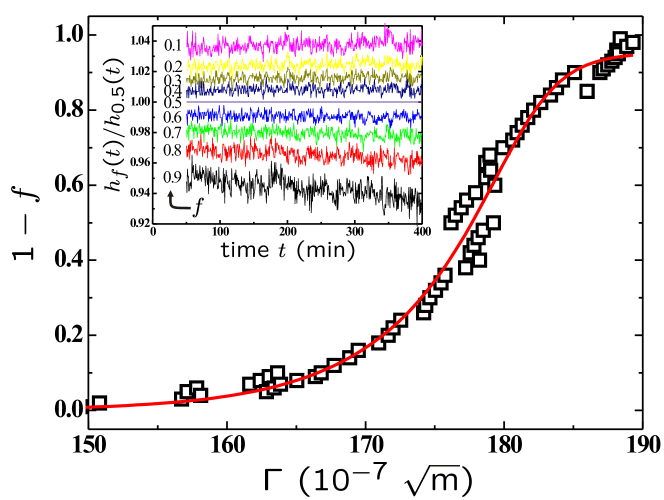
At this point we reconsider Eq. (5) and calculate imbibition abilities from the -values obtained from -fits to the rise height curves . Consequently, for each filling degree one obtains a corresponding imbibition ability . The systematic implementation of this evaluation method provides detailed information on the imbibition dynamics, namely a close link between and . This relationship is illustrated in Fig. 9.
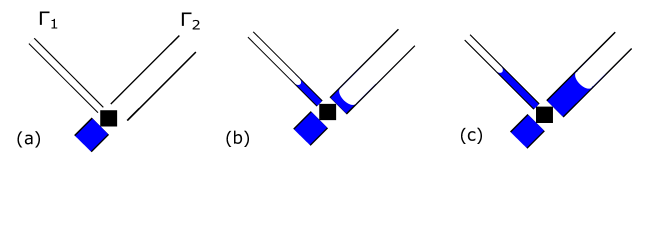
In order to emphasize the relationship’s key information we plotted the fraction of empty pore space, , as a function of . The fraction can be regarded as the cumulative probability to find a pore with an imbibition ability smaller than . This suggests that the filling process in Vycor results from a sequence of capillary filling events which is determined by the imbibition abilities of the porous medium. See Fig. 10 for an illustration of filling events at a junction of an interconnected network of cylindrical capillaries with two radii, and (with ) and thus two distinct imbibition abilities (). This conjecture will be addressed in more detail in the discussion part.
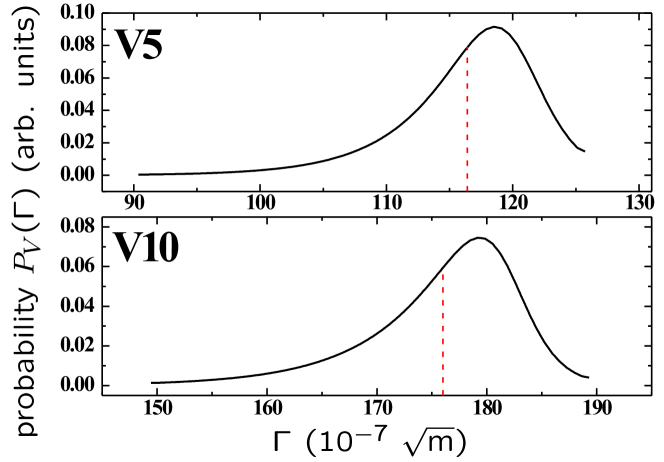
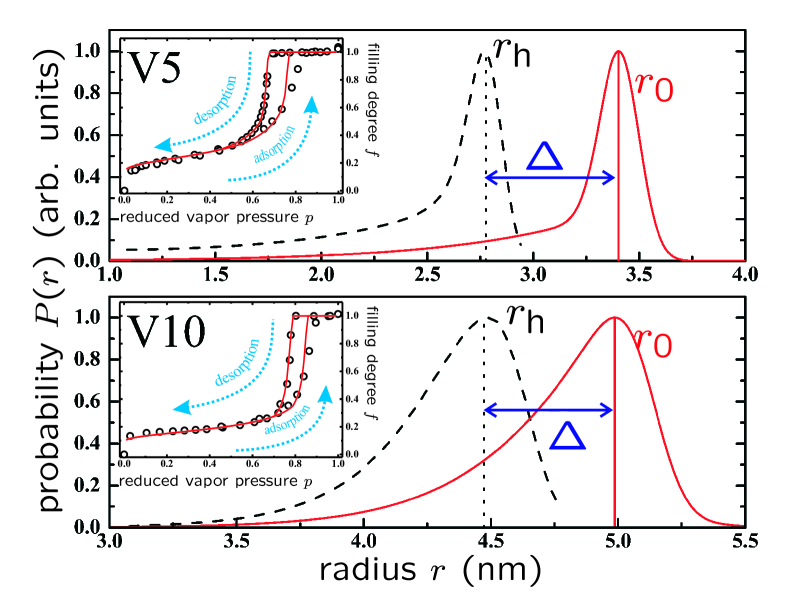
Since in Fig. 9 represents a cumulative probability, one can obtain the probability distribution of imbibition abilities by calculating the first derivative of with respect to . For this purpose we used a polynomial fit to , shown in Fig. 9. The resulting distribution of is shown in Fig. 11 for both V5 and V10.
One has to keep in mind that the calculated probabilities are volume weighted as opposed to the number weighted probabilites of the pore radii in Fig. 2. This is because the absorption of neutrons is proportional to the volume. Therefore, a number of large pores will produce a much higher signal than the same number of smaller pores. We will come back to this point again in the subsequent discussion of the results.
5 Discussion
Based on our results we provide answers to several questions concerning flow dynamics in extreme spatial confinement in general as well as liquid invasion into sponge-like pore networks in particular.
5.1 Nano-rheology of hydrocarbons in mesoporous silica
Our quantitative gravimetrical study on the flow of linear hydrocarbons in mesopores (see Fig. 6) suggests no significant effect of the all-trans molecule length on the overall flow behaviour over a wide range of values. Interestingly, we found indications for significant deviations from the constant average value towards faster overall imbibition dynamics only for the largest molecule (n-hexacontane, n-\ceC60H122, nm) in the smallest pores (V5, nm). One might speculate that the extreme confinement induces alignment or configurational changes [117] of the molecules, thereby, enhancing the imbibition ability. This result is in analogous to other imbibition studies that suggest faster flow kinetics of polymers in comparable restricted geometries [118, 119, 120, 121].
A further interesting result is the decreased dynamics of the branched alkane squalane. The imbibition ability is lowered for both V10 (reduction by 14 %) and V5 (reduction by 18 %). In comparison with the n-alkane of equal length, that is n-tetracosane (n-\ceC24H50), the additional six side branches (regularly arranged methyl groups) seem to significantly influence the liquid’s dynamic behaviour in the pore confinement. This phenomenon can be explained within the framework of sticking layers adjacent to the pore walls that will be part of a more quantitative analysis of the results below.
We now compare gravimetrical and neutron radiography measurements. From Fig. 11 one can extract the most probable values of the imbibition ability as obtained from neutron radiography; for V5 and for V10, respectively. By contrast, the mass increase measurements are not sensitive to a quantity such as the one most probable imbibition rate but rather to the mass (or volume)-weighted average . This is due to the mass’ nature as an integral quantity. In this respect, the volume weighted probabilities in Fig. 11 are advantageous as they directly allow the calculation of . This yields for V5 and for V10, only slight reductions with respect to the peak values are obtained. These values may now be compared to the imbibition abilities obtained from the gravimetrical measurements. Compared to the averages over all measured alkanes [V5: , V10: ] the values of are slightly smaller for both matrices. However, as the radiography experiments were only performed with n-tetradecane it might be appropriate to consider the mass increase measurements of n-\ceC14H30 only. Within the error margins the corresponding values and , respectively, coincide with the values obtained by neutron radiography. Hence, the mass increase experiments are consistent with the neutron radiography measurements as far as the average imbibition abilities are concerned.
5.2 Relation between shape of the imbibition front and pore size distribution
Our findings provide strong evidence that not only one but rather a whole set of (microscopic) imbibition fronts advance in the porous matrix and that these are controlled by the distribution of imbibition abilities, i.e. rise speeds, discussed above. A possible consequence of this phenomenon can be seen in the remarkable similarity between the distributions in Fig. 11 and the pore radii distributions in Fig. 2. They exhibit a similar shape which is composed of a most probable value (peak) with a steeper decrease towards larger values and a rather drawn-out decay towards smaller values, resulting in a distinct asymmetry. Now an aforementioned statement comes into play: the imbibition ability is, in principle, directly proportional to the square root of the pore radius (Eq. 7). Hence the similarity between both distributions is due to the fact that the imbibition ability is directly controlled by the pore radius.
At first glance, this is astonishing in so far as this result may imply that the porous Vycor glass is made up of many independent and intrinsically monodisperse pore networks with pore dimensions which satisfy the pore radius distributions. But the pores are interconnected and thereby one would, naively, assume a compensation of such effects. However, we recently found a broadening of the imbibition front of water in nanoporous Vycor glass [116]. It could be shown that the interface width increases much faster than observed previously for imbibition front broadening in other porous materials, most prominently paper and sand, namely with here . Moreover, the neutron radiography measurements revealed that lateral correlations of the invasion front are short-ranged and independent of time. Thus, the long pores in Vycor indeed seem to allow for simultaneous, but independent imbibition of the individual pores.
In fact, Sadjadi and Rieger showed by simulations of pore networks mimicking the structure of Vycor that spontaneous imbibition crucially depends on the pore aspect ratio [2, 122, 123]. For short pores, neighbouring menisci coalesce and form a continuous imbibition front. Thus the smoothening effect of an effective surface tension within the interface leads to a slow broadening of the front. By contrast, for elongated pores (like in Vycor) individual menisci form, which results in effectively independent capillary filling events in a three dimensional network of cylindrical pores. See Fig. 10(a) for an illustration of this meniscus splitting process at a pore junction and the subsequent filling of two elongated pores (capillaries) with small and large diameter. The speed of these filling events is given by the imbibition ability and thus depends on the pore radii, according to Eq. (7).
The light scattering of the advancing front may also be interpreted by a distribution of imbibition abilities. The visual observation of the front relies on the presence of a partly filled network of pores. Considering rapidly filling large and slowly filling small pores, the emergence of this phenomenon follows directly from the considerations above. Comparing the values at the upper and lower bounds of the n-tetradecane front in V5 and V10 (see Tab. 3) with the --relationships obtained from the neutron radiography measurements (see Fig. 9), the emergence of the light scattering phenomenon can be linked to the filling degree . For both, V5 and V10, the lower and upper bound are found to be located at and , respectively, which implies that for too few pores are filled leading to fluctuations in the refractive index on a length scale larger than the wavelength of visible light and, thus, inducing no light scattering. Beyond fluctuations on adequate length scales are increasingly created. It is remarkable that such fluctuations exist up to high filling degrees as indicated by the lower bound’s imbibition abilities.
5.3 Determination of pore size and hydrodynamic radii distributions from imbibition front broadening
Finally, we turn to a more quantitative interpretation of the obtained results. Applying Eq. (7) we can gain access to the hydrodynamic pore radii if we can estimate the Laplace radius . Eq. (7) suggests that has a smaller effect on the dynamics than and particularly . But, a priori, there are no hints on the exact value of .
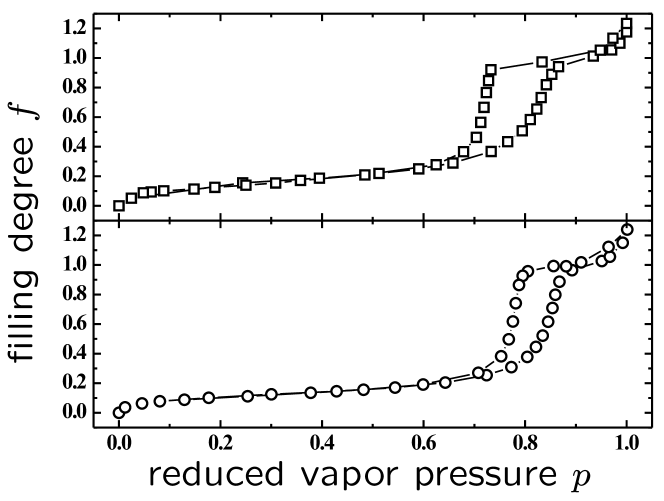
Based on water sorption isotherms in porous Vycor (see Fig. 12) that reveal the thermodynamics of water in the mesopore confinement, we may conclude that under standard laboratory conditions () the sample’s maximum filling degree is 25 % corresponding to approximately 2 layers of water molecules. According to these considerations should be at most 0.5 nm (roughly two times the diameter of a water molecule) smaller than .
In order to estimate the effect of on the overall dynamics we refer to the imbibition measurements of n-hexadecane (n-\ceC16H34) imbibing into V5 as a function of the humidity as discussed in section IV A - see Tab. 2 and Tab. 3. Relative humidities of up to 50 % do not significantly influence the dynamics of the mass increase or (roughly equivalent) the upper bound of the light scattering front, provided one takes into account the gradual and significant decrease in the initial porosity with increasing humidity. Interestingly, the lower bound of the light scattering front noticeably slows down with increasing humidity. This is due to the fact that a coverage with a certain thickness affects smaller pores far more than larger pores. Thus, whereas the numerous larger pores are hardly affected, it has a significant impact on the small pores that show reduced dynamics so that the light scattering front extends to lower values. However, as the small pores are only few and carry only little fluid, this phenomenon does not influence the overall dynamics of the rise process. We may, therefore, assume that the magnitude of only plays a minor role. Nonetheless, for the following analysis we need to quantify . Based on the water sorption isotherms we fix the Laplace radius to nm, corresponding to a reduction caused by approximately one monolayer of water at the pore walls.
Now, we can turn to the relation of the distribution functions of and . The direct connection between the pore radius and the imbibition ability via Eq. 7 allows for a more fundamental analysis of the relation between their distribution functions. With and nm one obtains
| (8) |
Hence, the -distribution can be transformed in a -distribution with , see Fig. 2 for the resulting -distribution. From this plot, it is evident that the distribution of hydrodynamic radii determined from the imbibition front broadening is in remarkable quantitative agreement with the pore size distributions derived from the nitrogen sorption isotherm measurements, provided one allows for a fixed shift with nm and nm for V5 and V10, respectively.
Thus, the imbibition front broadening can indeed be described by independent filling events of cylindrical pores with a size distribution typical of the Vycor glasses investigated. Unfortunately, we performed a detailed pore size analysis based on imbibition front broadening for C14 only and we do not have corresponding data sets for the other hydrocarbons. However, since our analysis is not specific to C14, we believe that the imbibition front analysis presented here can also be applied to other hydrocarbons (or liquids).
We would like to stress that in a network of connected elongated pores (or capillaries) with random radii another important mechanism has to be considered. As Sadjadi and Rieger showed, at pore junctions, where menisci with different Young-Laplace and thus imbibing pressures compete, meniscus propagation in one or more branches (depending on the pore size distribution) can come to a halt, when the negative Young-Laplace pressure of one of the menisci exceeds the hydrostatic pressure within the junction [122, 123, 124, 125]. These arrests of the menisci persist until the hydrostatic pressure in the junction is larger than the Young-Laplace pressure of the arrested menisci, see Fig. 10(b). Due to the viscous drag in the liquid column behind the advancing menisci, the junction pressure increases linearly with the distance of the moving menisci from the junction and this distance follows the Lucas-Washburn dynamics. Hence, the arrested menisci start to move and thus to fill the corresponding pore (or pore segment), when the moving menisci have advanced by a distance, which is proportional to [122, 123, 124, 125]. Note that they move then with a velocity larger than the menisci in the small pores, because of their larger s.
Unfortunately, there is no thorough analysis of the meniscus arrest time statistics and its influence on the front shape evolution as a function of pore size distribution available up to now. However, the menisci arrests result solely in delays of the filling events with delay times that increase with the pore size and with time. They do not prevent the eventual occurrence of those filling events, except for later stages of the filling process [122, 123], when negligible amounts of liquids have to be transported. Then capillarity completely determines the liquid menisci advancement and final position in pore space (capillarity-determined imbibition front broadening). By contrast, the sizeable liquid flow in the porous medium at earlier imbibition times means that both hydraulic permeability and capillarity, quantified by the imbibition ability, determine the liquid supply from the bulk reservoir and menisci advancement, and hence the imbibition front broadening. It is conceivable that a transition between this imbibition ability-determined and a capillarity-determined broadening regime exists. This would also mean that initially preferentially percolating liquid-filled clusters of interconnected larger pores form (with low hydrostatic pressure drops for a given flow rate), whereas later the imbibition front is determined by the occurrence of arrested large menisci and thus empty segments of large pores. Such a transition would be analogous to the situation encountered for imbibition in a set of parallel, independent capillaries in a gravitational field, where initially the menisci in the large pores propagate the fastest and are ahead of the ones in the small capillaries. Whereas finally, upon reaching the final capillary rise heights the viscous drag and hence hydraulic permeability is negligible and a balance of capillarity and gravitation implies an opposite arrangement of the menisci as a function of height, known as Jurin’s law [93], i.e. the smaller the pore the higher the liquid will rise, .
Our analysis suggests that in the present case the broadening is determined by the imbibition ability, and thus by both a competition of hydraulic permeability and capillarity. Since this phenomenology as well as menisci arrests result in a -broadening of the front, they are difficult to distinguish. Additional studies are clearly necessary to explore the interplay and competition of imbibition ability- and meniscus arrest-determined broadening and its possible dependence on the pore morphology, in particular the aspect ratio of the pores. This is also important in order to decide whether the evidence of the validity of our model is rather a coincidence or rests on the proper mechanistic insights with regard to the pore filling events in Vycor.
5.4 Partitioning in interface/core fluidity
Another important insight of Fig. 2 is the shift between the and the distribution. It implies that a liquid layer of thickness adjacent to the pore walls does not participate in the flow. Rather, it sticks to the wall or shows a significantly reduced mobility whilst the dynamics of the remaining liquid obeys Hagen-Poiseuille’s law and, therefore, the classical assumptions of continuum mechanical theory. This reveals that the imbibed liquid is separated in two regions (1) an interfacial layer (with thicknesses nm and nm for V5 and V10, respectively) whose arrested or very slow kinetics are mainly determined by the interaction between liquid and substrate and (2) a central region that follows classical behaviour as expected for bulk liquids. All these macroscopic concepts remain valid for this central region even though it comprises merely 100 to 1000 molecules per cross-sectional area, far fewer than typical ensembles considered in statistical physics.
The behaviour of the interfacial layer is dominated by the liquid/substrate interaction. In this context one might recall that we have already considered an initial water coating of the pore walls due to the finite humidity. This effect is caused by Vycor’s extremely high hydrophilicity so that the existence of a sticking layer is not too surprising. Especially the first adsorbed water layer is stabilized by the attractive potential between silica and water. This is also reflected in the distinct monolayer step in the sorption isotherms (Fig. 12) and a slow self-diffusion dynamics [126, 127]. Molecular Dynamics studies also document a glassy structure of the water boundary layer in Vycor [128] and the existence of sticky boundary layers has been inferred from Hagen-Poiseuille nanochannel flows [63]. Moreover, a water coating on the pore walls is far more stable than an alkane coating (as indicated by their surface tensions), so that the imbibed hydrocarbon is not able to displace the initial water layer. Hence, we suggest that this monolayer is present during the whole experiment. According to previous publications [129, 127, 79] it is extremely immobile, thereby providing a first layer of thickness nm to the overall sticking layer thickness .
However, this water layer alone can not constitute the complete sticking layer. The remaining 0.3 nm to 0.4 nm must originate from an additional immobile layer. This thickness coincides with the diameter of a hydrocarbon chain in all-trans configuration that is nm. Hence, we assume that the sticking layer consists of a water layer directly adjacent to the pore walls covered by a layer of flat-lying hydrocarbon chains. This immobile shell is in agreement with the pioneering experiments by Debye and Cleland on forced imbibition of n-alkanes [78], consistent with studies regarding the thinning of n-alkane films in the surface force apparatus [59, 60, 61, 62, 63] and beam-bending experiments on the rheology of alkanes in Vycor [130, 131]. Moreover, X-ray reflectivity studies have indicated one strongly adsorbed, flat-lying monolayer of hydrocarbons on silica [132, 133, 134, 135]. Quasi-elastic neutron scattering measurements, which are sensitive to the center-of-mass self-diffusion of the n-alkanes in the pores and thus the liquid’s viscosity, also indicate a partitioning of the diffusion dynamics of the molecules in the pores in two species: One component with bulk-like self-diffusion dynamics and a second one which is immobile, and thus ‘sticky’, on the time scale probed in the neutron scattering experiment [136, 137, 138, 139].
This concept is further corroborated by the squalane measurements. The decrease in the imbibition ability and the corresponding additional reduction of the hydrodynamic pore radii by approximately nm can be explained by the larger diameter of the squalane molecule as compared to a non-branched hydrocarbon chain. Its extra methyl groups, regularly and alternately attached to the n-tetracosane backbone, cause an increase of the sticking layer’s thickness by a value comparable to the above-mentioned decrease in .
6 Conclusions
We presented experiments on the capillarity-driven invasion dynamics of hydrocarbons in mesoporous, monolithic silica glass. The invasion kinetics for all liquids investigated are governed by classical Lucas-Washburn laws typical of spontaneous imbibition in porous media. The pre-factors of the corresponding square-root-of-time behaviours are compatible with the bulk fluid parameters, provided we assume a sticking boundary layer of flat-lying hydrocarbons and a monolayer of water adsorbed at the pore walls. For the molecule with the longest chain investigated, C60, an increased fluidity in the mesopores is suggested by the results. This may indicate the transition towards polymer-like flow behavior [120, 140], i.e. the absence of a pore-wall adsorbed molecular layer in combination with velocity slippage, shear-induced alignment or rearrangements in the molecular structure which result in an increased mobility compared to the bulk state. These rheological insights are in good agreement with previous experiments on water, alkanes and liquid crystals [141, 79, 107, 80, 58]. They are also corroborated by Molecular Dynamics simulations on spontaneous imbibition in nanopores [142, 120, 143].
Both, light and neutron imaging reveal not only filling kinetics which follow a square-root-of-time dependence, but also that the overall width of the front obeys this time-dependence, as previously reported for water invasion in Vycor [116]. Neutron radiography allowed us to temporally and spatially resolve the evolution of the asymmetric shape of the imbibition front. The imbibition front shape can be described by a superposition of independent wetting fronts moving with radius-dependent square-root-of-time laws, where the contribution of the single fronts is weighted by a distribution of hydrodynamic pore diameters that agrees with the pore size distribution obtained from volumetric nitrogen sorption isotherm measurements, when corrected for the immobile boundary layer. The superposition of these independent fronts leads to fluctuations on the length scale of visible light and results in the observed light scattering.
Our findings suggest that the analysis of imbibition fronts allows independent determination of pore size distributions, provided one corrects the distributions for a possible immobile boundary layer, which does not participate in the viscous flow. The reason for this relation is traced back to the same mechanisms responsible for imbibition front broadening, in particular independent meniscus movements and independent capillary filling events as typical for spontaneous imbibition in networks of elongated pores with random radii [116, 122, 123, 124, 125]. We believe that further model calculations and simulation studies on artificial pore networks along with a direct experimental study of pore-scale air displacement statistics (menisci arrests and menisci advancement in single pores), e.g. by time-dependent, in-situ neutron [116] or X-ray imaging[9, 13] or small-angle scattering, are necessary to clarify the relation between imbibition front broadening, the pore size distribution, and the aspect ratio of the pores.
Many porous media have a complex geometry (variation of the mean pore diameter within isolated channels, meandering of the pores, varying pore connectivity) [144, 145, 146, 147]. Similarly, as observed here, the inhomogeneities result in variations in the local bulk hydraulic permeability and in the capillary pressure at the moving interface resulting in a broadening of the imbibition front and thus the coexistence of empty and filled pore segments during the imbibition process. Often this broadening displays universal scaling features on large length and time scales, which are independent of the microscopic details of the fluid and the matrix [148, 149, 150, 151, 152, 153, 154, 155, 156, 157]. In the past, most imbibition front broadening studies focused on sand, packed beads and paper. In these systems, the pores are not elongated, and hence no individual menisci form in neighbouring pores. This results in a continuous liquid-gas interface, whose advancement is spatially correlated due to an effective surface tension [158]. Consequently, menisci advancement beyond the average front position is slowed down whilst menisci lagging behind are drawn forward. Thus, in contrast to the situation presented here, the front shape does not contain any information on the pore size distribution.
The determination of pore sizes and pore morphologies is arguably one of the most important scientific and technological topics in the field of porous media [159]. Depending on the type of porous material and the experimental conditions, such diverse techniques as direct imaging [159, 160], neutron and x-ray scattering [161, 162, 163, 14], gas sorption [164, 165, 166, 167, 168], monitoring of phase transition shifts (cryporometry) [169, 97, 170, 171], measuring of imbibition kinetics [172], gas pressure-induced displacement of wetting liquids [173] can be appropriate means to achieve this goal. Most of these methods rely on size-effects in the thermodynamics, expressed by the radius-dependent Kelvin equation (capillary condensation) or Gibbs-Thomson equation (cryoporometry) and thus on equilibrium properties. Interestingly, the experiments presented here suggest that also a non-equilibrium physical phenomenon can contribute to the field of porosimetry. In the case of individual moving liquid menisci, as in the case of elongated pores where menisci are split at pore junctions, the broadening of spontaneous imbibition fronts of wetting liquids constitutes an alternative way for the determination of pore size distributions. To what extent heterogeneities in the wettability of the porous medium[13], as is often the case in porous rocks, affect this phenomenology is an interesting topic to explore in the future. We also hope that our study stimulates a detailed exploration of the conditions for a reliable applicability of this approach by experiments on real [9] and model pore systems [174, 175, 124, 125], but also by computer simulations and phenomenological model calculations on spontaneous imbibition in pore networks [176, 122].
This work has been supported within the DFG priority program 1164, Nano- & Microfluidics (Grant. No. Hu 850/2). We thank Zeinab Sadjadi and Heiko Rieger for stimulating discussions and the research neutron source Heinz Maier-Leibnitz (FRM II) in Munich (Germany) for beam time at the imaging experiment ANTARES.
References
- Drake and Klafter [1990] J. M. Drake and J. Klafter. Dynamics of confined molecular systems. Phys. Today, 43:46, 1990.
- Lenormand [1990] R. Lenormand. Liquids in porous media. J. Phys.: Condens. Matter, 2:SA79, 1990.
- Christenson [2001] H. K. Christenson. Confinement effects on freezing and melting. Journal of Physics-condensed Matter, 13(11):R95–R133, March 2001. doi: 10.1088/0953-8984/13/11/201.
- Clarke et al. [2002] A. Clarke, T. D. Blake, K. Carruthers, and A. Woodward. Spreading and imbibition of liquid droplets on porous surfaces. Langmuir, 18(8):2980–2984, April 2002. doi: 10.1021/la0117810.
- Alba-Simionesco et al. [2006] C. Alba-Simionesco, B. Coasne, G. Dosseh, G. Dudziak, K. E. Gubbins, R. Radhakrishnan, and M. Sliwinska-Bartkowiak. Effects of confinement on freezing and melting. J. Phys.: Condens. Matter, 18:R15, 2006.
- Knorr et al. [2008] K. Knorr, P. Huber, and D. Wallacher. Thermodynamic and structural investigations of condensates of small molecules in mesopores. Zeitschrift f r Physikalische Chemie, 222:257, 2008.
- Binder et al. [2008] K. Binder, J. Horbach, R. Vink, and A. De Virgiliis. Confinement effects on phase behavior of soft matter systems. Soft Matter, 4(8):1555–1568, 2008. doi: 10.1039/b802207k.
- Perkin and Klein [2013] S. Perkin and J. Klein. Soft matter under confinement. Soft Matter, 9(44):10438–10441, 2013. doi: 10.1039/c3sm90141f.
- Berg et al. [2013] Steffen Berg, Holger Ott, Stephan A. Klapp, Alex Schwing, Rob Neiteler, Niels Brussee, Axel Makurat, Leon Leu, Frieder Enzmann, Jens-Oliver Schwarz, Michael Kersten, Sarah Irvine, and Marco Stampanoni. Real-time 3d imaging of haines jumps in porous media flow. Proceedings of the National Academy of Sciences of the United States of America, 110(10):3755–3759, March 2013. doi: 10.1073/pnas.1221373110.
- Kriel et al. [2014] Frederik H. Kriel, Rossen Sedev, and Craig Priest. Capillary filling of nanoscale channels and surface structure. Israel Journal of Chemistry, 54(11-12):1519–1532, November 2014. doi: 10.1002/ijch.201400086.
- Datta et al. [2014a] S. S. Datta, T. S. Ramakrishnan, and D. A. Weitz. Mobilization of a trapped non-wetting fluid from a three-dimensional porous medium. Physics of Fluids, 26(2):022002, February 2014a. doi: 10.1063/1.4866641.
- Jiang and Ward [2014] Q. Jiang and M. D. Ward. Crystallization under nanoscale confinement. Chemical Society Reviews, 43(7):2066–2079, 2014. doi: 10.1039/c3cs60234f.
- Murison et al. [2014] J. Murison, B. Semin, J. C. Baret, S. Herminghaus, M. Schroter, and M. Brinkmann. Wetting heterogeneities in porous media control flow dissipation. Physical Review Applied, 2(3):034002, September 2014. doi: 10.1103/PhysRevApplied.2.034002.
- Bon et al. [2014] Volodymyr Bon, Irena Senkovska, Dirk Wallacher, Andreas Heerwig, Nicole Klein, Ivo Zizak, Ralf Feyerherm, Esther Dudzik, and Stefan Kaskel. In situ monitoring of structural changes during the adsorption on flexible porous coordination polymers by x-ray powder diffraction: Instrumentation and experimental results. Microporous and Mesoporous Materials, 188:190–195, April 2014. doi: 10.1016/j.micromeso.2013.12.024.
- Xue et al. [2015a] Longjian Xue, Alexander Kovalev, Anna Eichler-Volf, Martin Steinhart, and Stanislav N. Gorb. Humidity-enhanced wet adhesion on insect-inspired fibrillar adhesive pads. Nature Communications, 6:6621, March 2015a. doi: 10.1038/ncomms7621.
- Zhang et al. [2015] R. Zhang, X. Zeng, C. Kim, R.J. Bushby, K. Shin, Baker P.J., V. Percec, P. Leowanawat, and G. Ungar. Columnar liquid crystals in cylindrical nanoconfinement. ACS Nano, page DOI 10.1021/nn506605p, 2015.
- Stroock et al. [2014] Abraham D. Stroock, Vinay V. Pagay, Maciej A. Zwieniecki, and N. Michele Holbrook. The physicochemical hydrodynamics of vascular plants. Annual Review of Fluid Mechanics, Vol 46, 46:615–642, 2014. doi: 10.1146/annurev-fluid-010313-141411.
- de Carvalho et al. [2015] S.J. de Carvalho, R. Metzler, and A.G. Cherstvy. Inverted critical adsorption of polyelectrolytes in confinement. Soft Matter, 11:4430–4443, 2015.
- Ichilmann et al. [2015] Sachar Ichilmann, Kerstin Ruecker, Markus Haase, Dirk Enke, Martin Steinhart, and Longjian Xue. Adiabatic burst evaporation from bicontinuous nanoporous membranes. Nanoscale, 7(20):9185–9193, 2015. doi: 10.1039/c5nr01402f.
- Huber [2015] Patrick Huber. Soft matter in hard confinement: phase transition thermodynamics, structure, texture, diffusion and flow in nanoporous media. J. Phys. : Cond. Matt., 27:103102, 2015.
- Huczko [2000] A. Huczko. Template-based synthesis of nanomaterials. Applied Physics A-materials Science & Processing, 70(4):365–376, 2000. doi: 10.1007/s003390051050.
- Yin et al. [2001] A. J. Yin, J. Li, W. Jian, A. J. Bennett, and J. M. Xu. Fabrication of highly ordered metallic nanowire arrays by electrodeposition. Applied Physics Letters, 79(7):1039–1041, 2001. doi: 10.1063/1.1389765.
- Steinhart et al. [2002] M. Steinhart, J. H. Wendorff, A. Greiner, R. B. Wehrspohn, K. Nielsch, J. Schilling, J. Choi, and U. Gosele. Polymer nanotubes by wetting of ordered porous templates. Science, 296(5575):1997–1997, 2002. doi: 10.1126/science.1071210.
- Sander and Tan [2003] M. S. Sander and L. S. Tan. Nanoparticle arrays on surfaces fabricated using anodic alumina films as templates. Advanced Functional Materials, 13(5):393–397, 2003. doi: 10.1002/adfm.200304290.
- Coakley et al. [2003] K. M. Coakley, Y. X. Liu, M. D. McGehee, K. L. Frindell, and G. D. Stucky. Infiltrating semiconducting polymers into self-assembled mesoporous titania films for photovoltaic applications. Advanced Functional Materials, 13(4):301–306, 2003. doi: 10.1002/adfm.200304361.
- Ford et al. [2005] D. M. Ford, E. E. Simanek, and D. F. Shantz. Engineering nanospaces: ordered mesoporous silicas as model substrates for building complex hybrid materials. Nanotechnology, 16(7):Amer Inst Chem Engineers, 2005. doi: 10.1088/0957-4484/16/7/022.
- Hoffmann et al. [2006] F. Hoffmann, M. Cornelius, J. Morell, and M. Froba. Silica-based mesoporous organic-inorganic hybrid materials. Angewandte Chemie-international Edition, 45(20):3216–3251, 2006. doi: 10.1002/anie.200503075.
- Thomas et al. [2008] A. Thomas, F. Goettmann, and M. Antonietti. Hard templates for soft materials: Creating nanostructured organic materials. Chem. Mater., 20(3):738–755, February 2008. doi: 10.1021/cm702126j.
- Kityk and Huber [2010] A. V. Kityk and P. Huber. Thermotropic nematic and smectic order in silica glass nanochannels. Applied Physics Letters, 97(15):153124, 2010. doi: 10.1063/1.3502595.
- Sousa et al. [2014] C. T. Sousa, D. C. Leitao, M. P. Proenca, J. Ventura, A. M. Pereira, and J. P. Araujo. Nanoporous alumina as templates for multifunctional applications. Applied Physics Reviews, 1(3):031102, September 2014. doi: 10.1063/1.4893546.
- Martin et al. [2014] Jaime Martin, Marisol Martin-Gonzalez, Jose Francisco Fernandez, and Olga Caballero-Calero. Ordered three-dimensional interconnected nanoarchitectures in anodic porous alumina. Nature Communications, 5:5130, October 2014. doi: 10.1038/ncomms6130.
- de Jongh and Eggenhuisen [2013] Petra E. de Jongh and Tamara M. Eggenhuisen. Melt infiltration: an emerging technique for the preparation of novel functional nanostructured materials. Advanced Materials, 25(46):6672–6690, 2013. doi: 10.1002/adma.201301912.
- Westover et al. [2014] Andrew S. Westover, John W. Tian, Shivaprem Bernath, Landon Oakes, Rob Edwards, Farhan N. Shabab, Shahana Chatterjee, Amrutur V. Anilkumar, and Cary L. Pint. A multifunctional load-bearing solid-state supercapacitor. Nano Letters, 14(6):3197–3202, 2014. doi: 10.1021/nl500531r.
- Elbert et al. [2014] Johannes Elbert, Fabio Krohm, Christian Ruettiger, Sandra Kienle, Haiko Didzoleit, Bizan N. Balzer, Thorsten Hugel, Bernd Stuehn, Markus Gallei, and Annette Brunsen. Polymer- modifi ed mesoporous silica thin films for redox- mediated selective membrane gating. Advanced Functional Materials, 24(11):1591–1601, 2014. doi: 10.1002/adfm.201302304.
- Wang and Weissmuller [2013] K. Wang and J. Weissmuller. Composites of nanoporous gold and polymer. Advanced Materials, 25(9):1280–1284, 2013. doi: 10.1002/adma.201203740.
- Eijkel and van den Berg [2005] J. C. T. Eijkel and A. van den Berg. Nanofluidics: what is it and what can we expect from it? Nano- and Microfluidics, 1:249, 2005.
- Hoeltzel and Tallarek [2007] Alexandra Hoeltzel and Ulrich Tallarek. Ionic conductance of nanopores in microscale analysis systems: Where microfluldics meets nanofluidics. Journal of Separation Science, 30(10):1398–1419, July 2007. doi: 10.1002/jssc.200600427.
- Gruener and Huber [2008] S. Gruener and P. Huber. Knudsen diffusion in silicon nanochannels. Phys. Rev. Lett., 100:064502, 2008.
- Squires and Quake [2005] T. M. Squires and S. R. Quake. Microfluidics: Fluid physics at the nanoliter scale. Rev. Mod. Phys., 77:977, 2005.
- Urbakh et al. [2004] M. Urbakh, J. Klafter, D. Gourdon, and J. Israelachvili. The nonlinear nature of friction. Nature, 430:525, 2004.
- Stone et al. [2004] H. A. Stone, A. D. Stroock, and A. Ajdari. Engineering flows in small devices: Microfluidics toward a lab-on-a-chip. Annu. Rev. Fluid Mech., 36:381, 2004. ISSN 0066-4189. doi: {10.1146/annurev.fluid.36.050802.122124}.
- Majumder et al. [2005] M. Majumder, N. Chopra, R. Andrews, and B. J. Hinds. Enhanced flow in carbon nanotubes. Nature, 438:44, 2005.
- Dittrich and Manz [2006] P. S. Dittrich and A. Manz. Lab-on-a-chip: microfluidics in drug discovery. Nature Reviews Drug Discovery, 5(3):210–218, 2006. doi: 10.1038/nrd1985.
- Whitby and Quirke [2007] M. Whitby and N. Quirke. Fluid flow in carbon nanotubes and nanopipes. Nat. Nanotechnol., 2:87, 2007.
- Persson et al. [2007] Fredrik Persson, L. H. Thamdrup, M. B. L. Mikkelsen, S. E. Jaarlgard, P. Skafte-Pedersen, H. Bruus, and A. Kristensen. Double thermal oxidation scheme for the fabrication of sio2 nanochannels. Nanotechnology, 18(24):245301, June 2007. doi: 10.1088/0957-4484/18/24/245301.
- Schoch et al. [2008] R. B. Schoch, J. Han, and P. Renaud. Transport phenomena in nanofluidics. Rev. Mod. Phys., 80:839, 2008.
- Piruska et al. [2010] A. Piruska, M. Gong, J. V. Sweedler, and P. W. Bohn. Nanofluidics in chemical analysis. Chemical Society Reviews, 39(3):1060–1072, 2010. doi: 10.1039/b900409m.
- Kirby [2010] B.J. Kirby. Micro- and Nanoscale Fluid Mechanics: Transport in Microfluidic Devices. Cambr, 2010.
- Koester and Pfohl [2012] Sarah Koester and Thomas Pfohl. X-ray studies of biological matter in microfluidic environments. Modern Physics Letters B, 26(26):1230018, October 2012. doi: 10.1142/S0217984912300189.
- Bocquet and Tabeling [2014] Lyderic Bocquet and Patrick Tabeling. Physics and technological aspects of nanofluidics. Lab on a chip, 14(17):3143–58, 2014. doi: 10.1039/c4lc00325j.
- Vincent et al. [2014] Olivier Vincent, David A. Sessoms, Erik J. Huber, Jules Guioth, and Abraham D. Stroock. Drying by cavitation and poroelastic relaxations in porous media with macroscopic pores connected by nanoscale throats. Physical review letters, 113(13):134501–134501, September 2014.
- Li et al. [2015] Long Li, Jingwen Mo, and Jingwen Li. Nanofluidic diode for simple fluids without moving parts. Phys. Rev. Lett., 115:134503, 2015.
- Xue [2014] Y. Xue. Switchable imbibition in nanoporous gold. Nature Communications, 5:4237, 2014.
- Xue et al. [2015b] Yahui Xue, Yanbing Yang, Hui Sun, Xiying Li, Shiting Wu, Anyuan Cao, and Huiling Duan. A switchable and compressible carbon nanotube sponge electrocapillary imbiber. Advanced Materials, page DOI: 10.1002/adma.201502837, 2015b.
- Fradin et al. [2000] C. Fradin, A. Braslau, D. Luzet, D. Smilgies, M. Alba, N. Boudet, K. Mecke, and J. Daillant. Reduction in the surface energy of liquid interfaces at short length scales. Nature, 403:871–874, 2000.
- Vinogradova and Belyaev [2011] O. I. Vinogradova and A. V. Belyaev. Wetting, roughness and flow boundary conditions. J. Phys.: Condens. Matter, 23(18), 2011. doi: 10.1088/0953-8984/23/18/184104.
- Seveno et al. [2013] D. Seveno, T. D. Blake, and J. De Coninck. Young’s equation at the nanoscale. Physical Review Letters, 111(9):096101, August 2013. doi: 10.1103/PhysRevLett.111.096101.
- Vincent et al. [2015] O. Vincent, Szenicer A., and A. Stroock. Capillarity-driven flows at the continuum limit. arXiv.org, page 1510.00411, 2015.
- Chan and Horn [1985] D. Y. C. Chan and R. G. Horn. The drainage of thin liquid-films between solid-surfaces. J. Chem. Phys., 83:5311, 1985. ISSN 0021-9606.
- Chirstenson et al. [1982] H. K. Chirstenson, R. G. Horn, and J. N. Israelachvili. Measurement of forces due to structure in hydrocarbon liquids. Journal of Colloid and Interface Science, 88(1):79–88, 1982. doi: 10.1016/0021-9797(82)90156-4.
- Stevens et al. [1997] M. J. Stevens, M. Mondello, G. S. Grest, S. T. Cui, H. D. Cochran, and P. T. Cummings. Comparison of shear flow of hexadecane in a confined geometry and in bulk. J. Chem. Phys., 106(17):7303, MAY 1 1997. ISSN 0021-9606.
- Georges et al. [1993] J. M. Georges, S. Millot, J. L. Loubet, and A. Tonck. Drainage of thin liquid-films between relatively smooth surfaces. J. Chem. Phys., 98:7345, 1993. ISSN 0021-9606.
- Heinbuch and Fischer [1989] U. Heinbuch and J. Fischer. Liquid flow in pores - slip, no-slip, or multilayer sticking. Physical Review A, 40(2):1144–1146, 1989. doi: 10.1103/PhysRevA.40.1144.
- Ruths and Granick [2000] M. Ruths and S. Granick. Influence of alignment of crystalline confining surfaces on static forces and shear in a liquid crystal, 4’-n-pentyl-4-cyanobiphenyl. Langmuir, 16:8368, 2000.
- Raviv et al. [2001] U. Raviv, P. Laurat, and J. Klein. Fluidity of water confined to subnanometre films. Nature, 413(6851):51–54, 2001.
- Rosenhek-Goldian et al. [2015] I. Rosenhek-Goldian, N. Kampf, A. Yeredor, and J. Klein. On the question of whether lubricants fluidize in stick-slip friction. Proceedings of the National Academy of Sciences of the United States of America, 112(23):7117–7122, June 2015. doi: 10.1073/pnas.1505609112.
- Jee et al. [2015] A. Y. Jee, K. Lou, and S. Granick. Scrutinizing evidence of no dilatancy upon stick-slip of confined fluids. Proceedings of the National Academy of Sciences of the United States of America, 112(36):E4972–E4972, September 2015. doi: 10.1073/pnas.1511129112.
- Israelachvili and Drummond [2015] J. N. Israelachvili and C. Drummond. On the conformational state of molecules in molecularly thin shearing films. Proceedings of the National Academy of Sciences of the United States of America, 112(36):E4973–E4973, September 2015. doi: 10.1073/pnas.1510758112.
- Pit et al. [2000] R. Pit, H. Hervet, and L. Leger. Direct experimental evidence of slip in hexadecane: Solid interfaces. Phys. Rev. Lett., 85:980, 2000.
- Cheikh and Koper [2003] C. Cheikh and G. Koper. Stick-slip transition at the nanometer scale. Phys. Rev. Lett., 91:156102, 2003.
- Schmatko et al. [2005] T. Schmatko, H. Hervet, and L. Leger. Friction and slip at simple fluid-solid interfaces: The roles of the molecular shape and the solid-liquid interaction. Phys. Rev. Lett., 94:244501, 2005.
- Neto et al. [2005] C. Neto, D. R. Evans, E. Bonaccurso, H. J. Butt, and V. S. J. Craig. Boundary slip in Newtonian liquids: A review of experimental studies. Rep. Prog. Phys., 68:2859, 2005.
- Muller et al. [2008] M. Muller, C. Pastorino, and J. Servantie. Flow, slippage and a hydrodynamic boundary condition of polymers at surfaces. Journal of Physics-condensed Matter, 20(49):494225, December 2008. doi: 10.1088/0953-8984/20/49/494225.
- Servantie and Mueller [2008] J. Servantie and M. Mueller. Temperature dependence of the slip length in polymer melts at attractive surfaces. Phys. Rev. Lett., 101(2):026101, 2008. doi: 10.1103/PhysRevLett.101.026101.
- Sendner et al. [2009] Christian Sendner, Dominik Horinek, Lyderic Bocquet, and Roland R. Netz. Interfacial water at hydrophobic and hydrophilic surfaces: Slip, viscosity, and diffusion. Langmuir, 25(18):10768–10781, 2009. doi: 10.1021/la901314b.
- Baeumchen et al. [2012] Oliver Baeumchen, Renate Fetzer, Mischa Klos, Matthias Lessel, Ludovic Marquant, Hendrik Haehl, and Karin Jacobs. Slippage and nanorheology of thin liquid polymer films. J. Phys.: Condens. Matter, 24(32):325102, 2012. doi: 10.1088/0953-8984/24/32/325102.
- Nordberg [1944] M. E. Nordberg. Properties of some vycor-brand glasses. Journal of the American Ceramic Society, pages 299–305, 1944.
- Debye and Cleland [1959a] P. Debye and R. L. Cleland. Flow of liquid hydrocarbons in porous Vycor. J. Appl. Phys., 30(6):843, 1959a.
- Gruener et al. [2009] S. Gruener, T. Hofmann, D. Wallacher, A. V. Kityk, and P. Huber. Capillary rise of water in hydrophilic nanopores. Phys. Rev. E, 79:067301, 2009.
- Gruener and Huber [2011] S. Gruener and P. Huber. Imbibition in mesoporous silica: rheological concepts and experiments on water and a liquid crystal. J. Phys. : Cond. Matt., 23(18):184109, 2011. doi: 10.1088/0953-8984/23/18/184109.
- Abeles et al. [1991] B. Abeles, L. F. Chen, J. W. Johnson, and J. M. Drake. Capillary condensation and surface flow in microporous vycor glass. Israel Journal of Chemistry, 31(2):99–106, 1991.
- Caupin et al. [2008] F. Caupin, M. W. Cole, S. Balibar, and J. Treiner. Absolute limit for the capillary rise of a fluid. Europhys. Lett., 82:56004, 2008.
- Debye and Cleland [1959b] P. Debye and R.L. Cleland. Flow of liquid hydrocarbons in porous Vycor. J. Appl. Phys., 30(6):843, 1959b.
- Bonn et al. [2009] Daniel Bonn, Jens Eggers, Joseph Indekeu, Jacques Meunier, and Etienne Rolley. Wetting and spreading. Rev. Mod. Phys., 81(2):739–805, April 2009. doi: 10.1103/RevModPhys.81.739.
- Courbin et al. [2009] L. Courbin, J. C. Bird, M. Reyssat, and H. A. Stone. Dynamics of wetting: from inertial spreading to viscous imbibition. Journal of Physics-condensed Matter, 21(46):464127, November 2009. doi: 10.1088/0953-8984/21/46/464127.
- Oyarzua et al. [2015] E. Oyarzua, J.H. Walther, A. Mejia, and Zambrano H.A. Early regimes of water capillary flow in slit silica nanochannels. Phys, 2015.
- Bosanquet [1923] C.H. Bosanquet. On the flow of liquids into capillary tubes. Phil. Mag. Ser. 6, 45:525, 1923.
- Quere [1997] D. Quere. Inertial capillarity. Europhys. Lett., 39:533, 1997.
- Kornev and Neimark [2001] K. G. Kornev and A. V. Neimark. Spontaneous penetration of liquids into capillaries and porous membranes revisited. Journal of Colloid and Interface Science, 235(1):101–113, March 2001. doi: 10.1006/jcis.2000.7374.
- Bell and Cameron [1906] J. M. Bell and F.K. Cameron. The flow of liquids through capillary spaces. J. Phys. Chem., 10:658, 1906.
- Lucas [1918] R. Lucas. ber das Zeitgesetz des kapillaren Aufstiegs von Fl ssigkeiten. Kolloid Zeitschrift, 23:15, 1918.
- Washburn [1921] E.W. Washburn. The dynamics of capillary flow. Phys. Rev., 17:273, 1921.
- de Gennes et al. [2004] P. G. de Gennes, F. Brochard-Wyart, and D. Quere. Capillarity and Wtting Phenomena: Drops, Bubbles, Pearls, Waves. Springer, New York, 2004.
- Levitz et al. [1991] P. Levitz, G. Ehret, S.K. Sinha, and J.M. Drake. Porous Vycor glass: The microstructure as probed by electron microscopy, direct energy transfer, small-angle scattering, and molecular adsorption. J. Chem. Phys., 95:6151, 1991.
- Mitropoulos et al. [1995] A.C. Mitropoulos, J.M. Haynes, R.M. Richardson, and N.K. Kanellopoulos. Characterization of porous glass by adsorption of dibromomethane in conjunction with small-angle x-ray scattering. Phys. Rev. B, 52:10035, 1995.
- Gelb and Gubbins [1998] L.D. Gelb and K.E. Gubbins. Characterization of porous glasses: Simulation models, adsorption isotherms, and the Brunauer-Emmett-Teller analysis method. Langmuir, 14:2097, 1998.
- Huber and Knorr [1999] P. Huber and K. Knorr. Adsorption-desorption isotherms and x-ray diffraction of Ar condensed into a porous glass matrix. Phys. Rev. B, 60:12657, 1999.
- Saam and Cole [1975] W.F. Saam and M.W. Cole. Excitations and thermodynamics for liquid-helium films. Phys. Rev. B, 11:1086, 1975.
- Cai and Yu [2011] J. C. Cai and B. M. Yu. A discussion of the effect of tortuosity on the capillary imbibition in porous media. Transport In Porous Media, 89(2):251–263, September 2011. doi: 10.1007/s11242-011-9767-0.
- Cai et al. [2014] Jianchao Cai, Edmund Perfect, Chu-Lin Cheng, and Xiangyun Hu. Generalized modeling of spontaneous imbibition based on hagen-poiseuille flow in tortuous capillaries with variably shaped apertures. Langmuir, 30(18):5142–5151, May 2014. doi: 10.1021/la5007204.
- Lin et al. [1992] M.Y. Lin, B. Abeles, J.S. Huang, H.E. Stasiewski, and Q. Zhang. Visocus flow and diffusion of liquids in microporous glasses. Phys. Rev. B, 46:10701, 1992.
- Crossley et al. [1991] R.A. Crossley, L.M. Schwartz, and J.R. Banavar. Image-based models of porous media: Application to Vycor glass and carbonate rocks. Appl. Phys. Lett., 59:3553, 1991.
- Small [1986] D.M. Small, editor. The physical chemistry of lipids: From alkanes to phospholipids. Handbook of Lipid Research. Plenum Press, New York, 1986.
- Wilhoit et al. [1996] R.C. Wilhoit, K.N. Marsh, X. Hong, N. Gadalla, and M. Frenkel. Densities of aliphatic hydrocarbons: Alkanes, volume 8B of Landolt-B rnstein - Group IV Physical Chemistry: Numerical data and functional relationships in science and technology. Springer, Berlin, 1996.
- Wohlfarth and Wohlfarth [2001] C. Wohlfarth and B. Wohlfarth. Viscosity of pure organic liquids and binary liquid mixtures: Pure organic liquids, volume 18B of Landolt-B rnstein - Group IV Physical Chemistry: Numerical data and functional relationships in science and technology. Springer, Berlin, 2001.
- Wohlfarth and Wohlfarth [1997] C. Wohlfarth and B. Wohlfarth. Surface tension of pure liquids and binary liquid mixtures, volume 16 of Landolt-B rnstein - Group IV Physical Chemistry: Numerical data and functional relationships in science and technology. Springer, Berlin, 1997.
- Gruener and Huber [2009] S. Gruener and P. Huber. Spontaneous imbibition dynamics of an n-alkane in nanopores: Evidence of meniscus freezing and monolayer sticking. Phys. Rev. Lett., 103:174501, 2009.
- Page et al. [1993] J.H. Page, J. Liu, B. Abeles, H.W. Deckman, and D.A. Weitz. Pore-space correlations in capillary condensation in Vycor. Phys. Rev. Lett., 71:1216–1219, 1993.
- Ogawa and Nakamura [2013] S. Ogawa and J. Nakamura. Hysteretic characteristics of 1/lambda(4) scattering of light during adsorption and desorption of water in porous vycor glass with nanopores. Journal of the Optical Society of America A-optics Image Science and Vision, 30(10):2079–2089, 2013. doi: 10.1364/JOSAA.30.002079.
- Ogawa and Nakamura [2015] Shigeo Ogawa and Jiro Nakamura. Photospectroscopically observed pore-space correlations of a wetting fluid during the drying process in nanoporous vycor glass. Journal of the Optical Society of America A-optics Image Science and Vision, 32(4):533–537, April 2015. doi: 10.1364/JOSAA.32.000533.
- Soprunyuk et al. [2003] V. P. Soprunyuk, D. Wallacher, P. Huber, K. Knorr, and A. V. Kityk. Freezing and melting of Ar in mesopores studied by optical transmission. Phys. Rev. B, 67:144105, 2003. doi: 10.1103/PhysRevB.67.144105.
- Soprunyuk et al. [2004] V. P. Soprunyuk, D. Wallacher, P. Huber, R. Ackermann, K. Knorr, and A. V. Kityk. Optical transmission measurements on phase transitions of O2 and CO in mesoporous glass. J. Low Temp. Phys., 134:1043, 2004.
- Huber et al. [2013] Patrick Huber, Mark Busch, Sylwia Calus, and Andriy V. Kityk. Thermotropic nematic order upon nanocapillary filling. Phys. Rev. E, 87(4):042502, 2013. doi: 10.1103/PhysRevE.87.042502.
- Varanakkottu et al. [2014] S. N. Varanakkottu, H. Engelbart, S. Joshi, M. Still, W. Xia, and S. Hardt. Light-controlled tuning of the optical properties of nanoporous glass. Optics Express, 22:25560–25569, 2014.
- Schillinger et al. [2006] Burkhard Schillinger, Elbio Calzada, and Klaus Lorenz. Modern neutron imaging: Radiography, tomography, dynamic and phase contrast imaging with neutrons. Materials In Transition, Proceedings, 112:61–71, 2006.
- Gruener et al. [2012] S. Gruener, Z. Sadjadi, H. E. Hermes, A. V. Kityk, K. Knorr, S. U. Egelhaaf, H. Rieger, and P. Huber. Anomalous front broadening during spontaneous imbibition in a matrix with elongated pores. Proceedings of the National Academy of Sciences of the United States of America, 109(26):10245–10250, 2012. doi: 10.1073/pnas.1119352109.
- Martin et al. [2010] J. Martin, M. Krutyeva, M. Monkenbusch, A. Arbe, J. Allgaier, A. Radulescu, P. Falus, J. Maiz, C. Mijangos, J. Colmenero, and D. Richter. Direct observation of confined single chain dynamics by neutron scattering. Phys. Rev. Lett., 104(19):197801, 2010. doi: 10.1103/PhysRevLett.104.197801.
- Shin et al. [2007] K. Shin, S. Obukhov, J.-T. Chen, J. Huh, Y. Hwang, S. Mok, P. Dobriyal, P. Thiyagarajan, and T.P. Russell. Enhanced mobility of confined polymers. Nat. Mater., 6:961, 2007.
- Priezjev and Troian [2004] N. V. Priezjev and S. M. Troian. Molecular origin and dynamic behavior of slip in sheared polymer films. Phys. Rev. Lett., 92:018302, 2004.
- Dimitrov et al. [2007] D. I. Dimitrov, A. Milchev, and K. Binder. Capillary rise in nanopores: Molecular dynamics evidence for the Lucas-Washburn equation. Phys. Rev. Lett., 99:054501, 2007.
- Hatzikiriakos [2012] Savvas G. Hatzikiriakos. Wall slip of molten polymers. Progress in Polymer Science (Oxford), 37(4):624–643, 2012. ISSN 00796700. doi: 10.1016/j.progpolymsci.2011.09.004. URL http://dx.doi.org/10.1016/j.progpolymsci.2011.09.004.
- Sadjadi and Rieger [2013] Zeinab Sadjadi and Heiko Rieger. Scaling theory for spontaneous imbibition in random networks of elongated pores. Phys. Rev. Lett., 110(14):144502, 2013. doi: 10.1103/PhysRevLett.110.144502.
- Lee et al. [2014] D. S. Lee, Z. Sadjadi, and H. Rieger. Lattice model for spontaneous imbibition in porous media: The role of effective tension and universality class. Phys. Rev. E, 90(1):013016, 2014. doi: 10.1103/PhysRevE.90.013016.
- Sadjadi et al. [2015] Zeinab Sadjadi, Michael Jung, Ralf Seemann, and Heiko Rieger. Meniscus arrest during capillary rise in asymmetric microfluidic pore junctions. Langmuir, 31(8):2600–2608, March 2015. doi: 10.1021/la504149r.
- Rieger et al. [2015] H. Rieger, C. Thome, and Z. Sadjadi. Meniscus arrest dominated imbibition front roughening in porous media with elongated pores. J. Phys. Conf. Ser., (in press), 2015.
- Bellisent-Funel et al. [1993a] M. C. Bellisent-Funel, K.F. Bradley, S.H. Chen, J. Lal, and J. Teixeira. Slow dynamics of water-molecules in confined space. Physica A, 201(1-3):277–285, December 1993a. doi: 10.1016/0378-4371(93)90423-2.
- Chen et al. [1995] S. H. Chen, P. Gallo, and M. C. BellissentFunel. Slow dynamics of interfacial water. Canadian Journal of Physics, 73(11-12):703–709, November 1995.
- Gallo et al. [2002] P. Gallo, M. A. Ricci, and M. Rovere. Layer analysis of the structure of water confined in Vycor glass. J. Chem. Phys., 116:342, 2002.
- Bellisent-Funel et al. [1993b] M. C. Bellisent-Funel, J. Lal, and L. Bosio. Structural study of water confined in porous-glass by neutron-scattering. Journal of Chemical Physics, 98(5):4246–4252, 1993b. doi: 10.1063/1.465031.
- Scherer [2000] G. W. Scherer. Measuring permeability of rigid materials by a beam-bending method: I, theory. Journal of the American Ceramic Society, 83(9):2231–2239, September 2000.
- Vichit-Vadakan and Scherer [2000] W. Vichit-Vadakan and G. W. Scherer. Measuring permeability of rigid materials by a beam-bending method: II, Porous glass. J. Am. Ceram. Soc., 83:2240, 2000.
- Basu and Satija [2007] S. Basu and S. K. Satija. In-situ X-ray reflectivity study of alkane films grown from the vapor phase. Langmuir, 23:8331, 2007. ISSN 0743-7463. doi: {10.1021/la062517f}.
- Mo et al. [2005] H. D. Mo, G. Evmenenko, and P. Dutta. Ordering of liquid squalane near a solid surface. 415(1-3):106, 2005. ISSN 0009-2614. doi: {10.1016/j.cplett.2005.08.142}.
- Bai et al. [2007] M. Bai, K. Knorr, M. J. Simpson, S. Trogisch, H. Taub, S. N. Ehrlich, H. Mo, U. G. Volkmann, and F. Y. Hansen. Nanoscale observation of delayering in alkane films. Europhys. Lett., 79:26003, 2007.
- Corrales et al. [2014] Tomas P. Corrales, Mengjun Bai, Valeria del Campo, Pia Homm, Piero Ferrari, Armand Diama, Christian Wagner, Haskell Taub, Klaus Knorr, Moshe Deutsch, Maria Jose Retamal, Ulrich G. Volkmann, and Patrick Huber. Spontaneous formation of nanopatterns in velocity-dependent dip-coated organic films: From dragonflies to stripes. Acs Nano, 8(10):9954–9963, October 2014. doi: 10.1021/nn5014534.
- Baumert et al. [2002] J. Baumert, B. Asmussen, C. Gutt, and R. Kahn. Pore-size dependence of the self-diffusion of hexane in silica gels. Journal of Chemical Physics, 116(24):10869–10876, 2002. doi: 10.1063/1.1479719.
- Kusmin et al. [2010a] A. Kusmin, S. Gruener, A. Henschel, O. Holderer, J. Allgaier, D. Richter, and P. Huber. Evidence of a sticky boundary layer in nanochannels: A neutron spin echo study of n-hexatriacontane and poly(ethylene oxide) confined in porous silicon rid b-7690-2008. Journal of Physical Chemistry Letters, 1(20):3116–3121, 2010a. doi: 10.1021/jz1012406.
- Kusmin et al. [2010b] A. Kusmin, S. Gruener, A. Henschel, N. de Souza, J. Allgaier, D. Richter, and P. Huber. Polymer dynamics in nanochannels of porous silicon: A neutron spin echo study. Macromolecules, 43(19):8162–8169, 2010b. doi: 10.1021/ma1004925.
- Hofmann et al. [2012] Tommy Hofmann, Dirk Wallacher, Maria Mayorova, Reiner Zorn, Bernhard Frick, and Patrick Huber. Molecular dynamics of n-hexane: A quasi-elastic neutron scattering study on the bulk and spatially nanochannel-confined liquid. Journal of Chemical Physics, 136(12):124505, 2012. doi: 10.1063/1.3696684.
- Mueller et al. [2008] M. Mueller, C. Pastorino, and J. Servantie. Flow, slippage and a hydrodynamic boundary condition of polymers at surfaces. J. Phys.: Condens. Matter, 20(49):494225, 2008. doi: 10.1088/0953-8984/20/49/494225.
- Huber et al. [2007] P. Huber, S. Gruener, C. Schaefer, K. Knorr, and A. V. Kityk. Rheology of liquids in nanopores: A study on the capillary rise of water, n-hexadecane and n-tetracosane in mesoporous silica. Eur. Phys. J. Special Topics, 141:101, 2007.
- Gelb and Hopkins [2002] L. D. Gelb and A. C. Hopkins. Dynamics of the capillary rise in nanocylinders. Nano Lett., 2(11):1281, 2002.
- Chibbaro [2008] S. Chibbaro. Capillary filling with pseudo-potential binary Lattice-Boltzmann model. Eur. Phys. J. E, 27:99, 2008.
- Sahimi [1993] M. Sahimi. Flow phenomena in rocks - from continuum models to fractals, percolation, cellular-automata, and simulated annealing. Reviews of Modern Physics, 65(4):1393–1534, 1993. doi: 10.1103/RevModPhys.65.1393.
- Halpinhealy and Zhang [1995] T. Halpinhealy and Y. C. Zhang. Kinetic roughening phenomena, stochastic growth directed polymers and all that - aspects of multidisciplinary statistical-mechanics. Physics Reports-review Section of Physics Letters, 254(4-6):215–415, 1995. doi: 10.1016/0370-1573(94)00087-J.
- Hinrichsen [2000] H. Hinrichsen. Non-equilibrium critical phenomena and phase transitions into absorbing states. Advances In Physics, 49(7):815–958, 2000. doi: 10.1080/00018730050198152.
- Alava et al. [2004] M. Alava, M. Dube, and M. Rost. Imbibition in disordered media. Adv. Phys., 53:83, 2004.
- Kardar [1998] M. Kardar. Nonequilibrium dynamics of interfaces and lines. Physics Reports-review Section of Physics Letters, 301(1-3):85–112, July 1998. doi: 10.1016/S0370-1573(98)00007-6.
- Spathis et al. [2013] P. Spathis, A. Delga, C. Malheiro, and P. E. Wolf. Imbibition of liquid helium in aerogels. Journal of Low Temperature Physics, 171(5-6):693–698, 2013. doi: 10.1007/s10909-012-0767-4.
- Planet et al. [2007] R. Planet, M. Pradas, A. Hernandez-Machado, and J. Ortin. Pressure-dependent scaling scenarios in experiments of spontaneous imbibition. Phys. Rev. E, 76(5):056312, 2007. doi: 10.1103/PhysRevE.76.056312.
- Dube et al. [2007] M. Dube, C. Daneault, V. Vuorinen, M. Alava, and M. Rost. Front roughening in three-dimensional imbibition. European Physical Journal B, 56(1):15–26, 2007. doi: 10.1140/epjb/e2007-00085-7.
- Buldyrev et al. [1992] S. V. Buldyrev, A. L. Barabasi, A. L., F. Caserta, S. Havlin, H. E.. Stanley, and T. Vicsek. Anomalous interface roughening in porous-media - experiment and model. Physical Review A, 45(12):R8313–R8316, 1992.
- Horvath and Stanley [1995] V. K. Horvath and H. E. Stanley. Temporal scaling of interfaces propagating in porous media. Phys. Rev. E, 52:5166, 1995.
- Miranda et al. [2010] A. M. Miranda, I. L. Menezes-Sobrinho, and M. S. Couto. Spontaneous imbibition experiment in newspaper sheets. Phys. Rev. Lett., 104(8):086101, 2010. doi: 10.1103/PhysRevLett.104.086101.
- Hernandez-Machado et al. [2001] A. Hernandez-Machado, J. Soriano, A. M. Lacasta, M. A. Rodriguez, L. Ramirez-Piscina, and J. Ortin. Interface roughening in hele-shaw flows with quenched disorder: Experimental and theoretical results. Europhysics Letters, 55(2):194–200, 2001. doi: 10.1209/epl/i2001-00399-6.
- Geromichalos et al. [2002] D. Geromichalos, F. Mugele, and S. Herminghaus. Nonlocal dynamics of spontaneous imbibition fronts. Phys. Rev. Lett., 89:104503, 2002.
- Leoni et al. [2011] F. Leoni, E. Kierlik, M. L. Rosinberg, and G. Tarjus. Spontaneous imbibition in disordered porous solids: A theoretical study of helium in silica aerogels. Langmuir, 27(13):8160–8170, July 2011. doi: 10.1021/la201146h.
- Dube et al. [2000] M. Dube, M. Rost, and M. Alava. Conserved dynamics and interface roughening in spontaneous imbibition: A critical overview. Eur. Phys. J. B, 15:691, 2000.
- Rouquerol et al. [1998] J. Rouquerol, F. Rouquerol, and Sing K.S.W. Adsorption by Powders and Porous Solids: Principles, Methodology and Applications. Academic Press, 1998.
- Gommes et al. [2009] Cedric J. Gommes, Heiner Friedrich, Mariska Wolters, Petra E. de Jongh, and Krijn P. de Jong. Quantitative characterization of pore corrugation in ordered mesoporous materials using image analysis of electron tomograms. Chemistry of Materials, 21(7):1311–1317, 2009. doi: 10.1021/cm803092c.
- Hofmann et al. [2005] T. Hofmann, D. Wallacher, P. Huber, R. Birringer, K. Knorr, A. Schreiber, and G. H. Findenegg. Small-angle x-ray diffraction of Kr in mesoporous silica: Effects of microporosity and surface roughness. Phys. Rev. B, 72:064122, 2005.
- Zickler et al. [2006] Gerald A. Zickler, Susanne Jaehnert, Wolfgang Wagermaier, Sergio S. Funari, Gerhard H. Findenegg, and Oskar Paris. Physisorbed films in periodic mesoporous silica studied by in situ synchrotron small-angle diffraction. Phys. Rev. B, 73(18):184109, May 2006. doi: 10.1103/PhysRevB.73.184109.
- Mascotto et al. [2009] Simone Mascotto, Dirk Wallacher, Astrid Brandt, Thomas Hauss, Matthias Thommes, Gerald A. Zickler, Sergio S. Funari, Andreas Timmann, and Bernd M. Smarsly. Analysis of microporosity in ordered mesoporous hierarchically structured silica by combining physisorption with in situ small-angle scattering (saxs and sans). Langmuir, 25(21):12670–12681, November 2009. doi: 10.1021/la9013619.
- Naumov et al. [2009] S. Naumov, R. Valiullin, J. Kaerger, and P. A. Monson. Understanding adsorption and desorption processes in mesoporous materials with independent disordered channels. Phys. Rev. E, 80:031607, 2009.
- Morishige et al. [2003] K. Morishige, N. Tateishi, and S. Fukuma. Capillary condensation of nitrogen in mcm-48 and sba-16. Journal of Physical Chemistry B, 107(22):5177–5181, 2003. doi: 10.1021/jp022137c.
- Cychosz et al. [2012] Katie A. Cychosz, Xuefeng Guo, Wei Fan, Richard Cimino, Gennady Yu. Gor, Michael Tsapatsis, Alexander V. Neimark, and Matthias Thommes. Characterization of the pore structure of three-dimensionally ordered mesoporous carbons using high resolution gas sorption. Langmuir, 28(34):12647–12654, August 2012. doi: 10.1021/la302362h.
- Landers et al. [2013] John Landers, Gennady Yu. Gor, and Alexander V. Neimark. Density functional theory methods for characterization of porous materials. Colloids and Surfaces A-physicochemical and Engineering Aspects, 437:Quantachrome Instruments, 2013. doi: 10.1016/j.colsurfa.2013.01.007.
- Thommes and Cychosz [2014] Matthias Thommes and Katie A. Cychosz. Physical adsorption characterization of nanoporous materials: progress and challenges. Adsorption-journal of the International Adsorption Society, 20(2-3):233–250, 2014. doi: 10.1007/s10450-014-9606-z.
- Brun et al. [1977] M. Brun, A. Lallemand, J. F. Quinson, and C. Eyraud. New method for simultaneous determination of size and shape of pores - thermoporometry. Thermochimica Acta, 21(1):59–88, 1977. doi: 10.1016/0040-6031(77)85122-8.
- Landry [2005] M. R. Landry. Thermoporometry by differential scanning calorimetry: experimental considerations and applications. Thermochimica Acta, 433(1-2):27–50, August 2005. doi: 10.1016/j.tca.2005.02.015.
- Riikonen et al. [2011] J. Riikonen, J. Salonen, and V. P. Lehto. Utilising thermoporometry to obtain new insights into nanostructured materials. J. Therm. Anal. Calorim., 105(3):823–830, September 2011. doi: 10.1007/s10973-011-1337-8.
- Elizalde et al. [2014] Emanuel Elizalde, Raul Urteaga, Roberto R. Koropecki, and Claudio L. A. Berli. Inverse problem of capillary filling. Phys. Rev. Lett., 112(13), 2014. doi: 10.1103/PhysRevLett.112.134502.
- Labajos-Broncano et al. [2006] L. Labajos-Broncano, J.A. Antequera-Barroso, M.L. Gonzalez-Martin, and J.M. Bruque. Hydrocarbons imbibition for geometrical characterization of porous media through the effective radius approach. Appl. Surf. Sci., 253:1291, 2006.
- Courbin et al. [2007] L. Courbin, E. Denieul, E. Dressaire, M. Roper, A. Ajdari, and H. A. Stone. Imbibition by polygonal spreading on microdecorated surfaces. Nat. Mater., 6:661, 2007.
- Datta et al. [2014b] Sujit S. Datta, Jean-Baptiste Dupin, and David A. Weitz. Fluid breakup during simultaneous two-phase flow through a three-dimensional porous medium. Physics of Fluids, 26(6):062004, June 2014b. doi: 10.1063/1.4884955.
- Lam and Horvath [2000] C. H. Lam and V. K. Horvath. Pipe network model for scaling of dynamic interfaces in porous media. Physical Review Letters, 85(6):1238–1241, August 2000. doi: 10.1103/PhysRevLett.85.1238.