Path-integral simulation of ice VII: Pressure and temperature effects
Abstract
The effects of pressure and temperature on structural and thermodynamic
properties of ice VII have been studied by using path-integral molecular
dynamics (PIMD) simulations.
Temperatures between 25 and 450 K, as well as pressures
up to 12 GPa were considered.
Interatomic interactions were modeled by using the effective q-TIP4P/F
potential for flexible water.
We analyze the pressure dependence of the molar volume, bulk
modulus, interatomic distances, kinetic energy, and atomic delocalization
at various temperatures.
Results of PIMD simulations are compared with those derived from a
quasi-harmonic approximation (QHA) of vibrational modes, which helps to
assess the importance of anharmonic effects, as well as the influence of
the different modes on the properties of ice VII.
The accuracy of the QHA for describing this high-pressure phase decreases
for rising temperature, but this approximation becomes more reliable as
pressure grows, since anharmonicity becomes less relevant.
Comparisons with low-pressure cubic ice are presented.
Keywords: Ice, pressure effects, quantum simulations
I Introduction
Over the last few decades the phase diagram of water in the high-pressure region has attracted great interest in condensed matter physics and chemistry, as well as in planetary sciences Eisenberg and Kauzmann (1969); Petrenko and Whitworth (1999); Franks (2000); Robinson et al. (1996). This is due, apart from the fundamental character of water, to the large variety of ice polymorphs which have been found under different conditions of pressure () and temperature (). The phase diagram of water is currently known up to 1000 K and in the order of hundreds of GPa Dunaeva et al. (2010).
Ice VII is generally accepted to be the stable phase of water at pressures from 2 to about 60 GPa at room temperature, although some studies predict structural variations of ice VII in this pressure range Sugimura et al. (2008); Asahara et al. (2010). Oxygen atoms in ice VII form a body-centered cubic (bcc) structure, with H atoms lying between them, so that each O atom is surrounded by four H atoms, two of which covalently bonded and two H-bonded to it, according to the Bernal-Fowler rules Bernal and Fowler (1933). Apart from these constraints, the H distribution is disordered over the available lattice sites Kuhs et al. (1984); Salzmann et al. (2011). The resulting H-bond network consists of two independent interpenetrating subnetworks not hydrogen-bonded to each other, each of them topologically equivalent to the H-bond network of cubic ice Ic Salzmann et al. (2011); Herrero and Ramírez (2013a); Herrero (2014).
Ice VII is believed to be present in various natural environments, such as the Earth mantle or icy planets. In this context, the thermoelastic properties of ice VII and other high-pressure polymorphs can have implications for the dynamics of cold slab subduction in the Earth lower mantle, as well as for the evolution of icy planets and satellites Asahara et al. (2010). This high-pressure water phase has been studied by a variety of techniques, among which one finds X-ray Hemley et al. (1987); Fei et al. (1993); Loubeyre et al. (1999); Frank et al. (2004); Somayazulu et al. (2008); Sugimura et al. (2008, 2010) and neutron Kuhs et al. (1984); Nelmes et al. (1998); Klotz et al. (1999, 2009); Fortes et al. (2012) diffraction, as well as vibrational spectroscopy Walrafen et al. (1982); Klug and Whalley (1984); Song et al. (2003a, b), Brillouin scattering Asahara et al. (2010), electrical conductivity measurements Liu et al. (2013), and several kinds of calculations Holzapfel (1972); Slovak and Tanaka (2005); Vega et al. (2005); Sugimura et al. (2008); Knight et al. (2006); Knight and Singer (2009); Umemoto et al. (2010); Finkelstein and Moreh (2013).
At low temperatures, ice VII transforms into H-ordered ice VIII Song et al. (2003a, b); Dunaeva et al. (2010). For 10 GPa, the transition temperature is about 270 K, and for 10 GPa, decreases for increasing pressure Song et al. (2003b). At 60 GPa, ice VII transforms into ice X, where H atoms lie on the middle point between adjacent oxygen atoms, so that the molecular nature of water is no longer preserved. This phase transition from ice VII to ice X has been found to be caused by quantum proton delocalization Kang et al. (2013); Bronstein et al. (2014). At higher pressures, other ice phases have been encountered, and some others are predicted to appear at pressures above 1 TPa Hermann et al. (2012).
Computer simulation of condensed phases of water at an atomic level date back to the 1970s Barker and Watts (1969); Rahman and Stillinger (1971). In the last few decades, much work has been devoted to the development of empirical potentials to describe both liquid and solid H2O phases, so that nowadays a large variety of this kind of potentials can be found in the literature Mahoney and Jorgensen (2001); Koyama et al. (2004); Jorgensen and Tirado-Rives (2005); Abascal and Vega (2005); Paesani et al. (2006); McBride et al. (2009). Many of these interatomic potentials assume a rigid geometry for the water molecule, and some others allow for molecular flexibility either with harmonic or anharmonic OH stretches. In recent years, simulations of water using ab initio density functional theory (DFT) have been also carried out Chen et al. (2003); Fernández-Serra and Artacho (2006); Morrone and Car (2008). It has been observed, however, that a good description of H-bonds in condensed phases of water is a tough job with presently available energy functionals, and some properties cannot be accurately reproduced by DFT calculations Yoo et al. (2009). Some contributions to improve the description of van der Waals interactions in water within the DFT formalism have been developed in recent years Lee and Tuckerman (2006, 2007); Wang et al. (2011); Kolb and Thonhauser (2011); Akin-Ojo and Wang (2011).
A limitation of ab-initio electronic-structure calculations is that they usually deal with atomic nuclei as classical particles, without considering quantum aspects like zero-point motion. Such quantum aspects can be taken into account by using harmonic or quasiharmonic approximations for the nuclear motion, but the precision of these methods is not readily assessed when large anharmonicities are present, as may be the case for light atoms like hydrogen. To consider the quantum character of atomic nuclei, the path-integral molecular dynamics (or Monte Carlo) approach has turned out to be very useful, because in this method the nuclear degrees of freedom can be quantized in an efficient manner, including both thermal and quantum fluctuations in many-body systems at finite temperatures Gillan (1988); Ceperley (1995). Then, a powerful method can consist in combining DFT to determine the electronic structure and path integrals to describe the quantum motion of atomic nuclei Marx and Parrinello (1996); Tuckerman et al. (1996); Chen et al. (2003); Morrone and Car (2008). However, this procedure requires computer resources that may enormously reduce the number of state points that can be considered in actual simulations, as compared to the use of effective interatomic potentials.
Effective potential models for condensed phases of water usually treat H2O molecules as well-defined unbreakable entities, connected by H-bonds. This prevents their use to study high-pressure phases such as ice X, including symmetric O–H–O bonds. This shortcoming does not affect ab initio potentials, where in principle any bonding configuration or geometry can be studied. In this line, Benoit et al. Benoit et al. (1998, 2002) investigated the influence of nuclear quantum motion in proton ordering and H-bond symmetrization in high-pressure phases of ice, by carrying out path-integral molecular dynamics (PIMD) simulations with an interatomic interaction given by DFT calculations. More recently, the momentum distribution of protons in ice X was studied by Morrone et al. Morrone et al. (2009) using also ab initio PIMD.
Nuclear quantum effects become more relevant for light atomic masses, and are expected to be especially important in the case of hydrogen. Then, we consider the question of how quantum motion of the lightest atom can influence the structural properties of a solid water phase such as ice VII, and in particular if these effects are relevant or detectable for the solid at different densities, i.e. under different external pressures. This refers to the crystal volume and interatomic distances, but also to the thermodynamic properties of ice. In this respect, it is interesting to estimate the effect of nuclear quantum motion on the stability range of the different ice phases. Thus, it is known that quantum effects change the melting temperature of hexagonal ice Ih at ambient pressure by some degrees, as manifested by the isotope effect on Ramírez and Herrero (2010).
In this paper we study ice VII by PIMD simulations at several pressures and temperatures, in order to analyze its structural and thermodynamic properties. Interatomic interactions are described by the flexible q-TIP4P/F model, which was used earlier to carry out PIMD simulations of liquid water Habershon et al. (2009), ice Ih Ramírez and Herrero (2010); Herrero and Ramírez (2011a, b), and high-density amorphous ice Herrero and Ramírez (2012). This potential model has been found to yield a reasonable description of the phase diagram of water up to pressures in the order of 10 GPa Ramírez et al. (2013). The use of a rather accurate effective potential allows us to carry out long PIMD simulation runs, and to obtain a good convergence of structural and thermodynamic variables in the region under consideration. The q-TIP4P/F potential model was found to yield reliable results for low-pressure phases such as ice Ih Ramírez and Herrero (2011); Herrero and Ramírez (2011a, b), and it is a goal of the present work to analyze its capability to describe high-pressure phases as ice VII. A different goal consists in evaluating the reliability of applying a QHA to study these phases, by comparing its predictions with results of PIMD simulations. Such an approximation has been used earlier to study low-pressure water phases such as ices Ih, II, and III Ramírez et al. (2012a).
The paper is organized as follows. In Sec. II, we describe the computational methods and the model used in our calculations. Our results are presented in Sec. III, dealing with the pressure and temperature dependence of molar volume, bulk modulus, O–H interatomic distance, kinetic energy, and atomic delocalization in ice VII. Sec. IV gives a summary of the main results.
II Computational Method
II.1 Path-integral molecular dynamics
We use the PIMD method to obtain equilibrium properties of ice VII at various temperatures and pressures. This method is based on an isomorphism between the real quantum system and a fictitious classical one, that appears after a discretization of the quantum density matrix along cyclic paths Feynman (1972); Kleinert (1990). Such an isomorphism translates in practice into replacing each quantum particle by a ring polymer consisting of (Trotter number) classical particles, which are connected by harmonic springs with temperature- and mass-dependent force constant. This isomorphism is exact for , so that a numerical error is introduced by using a finite , which may be corrected by adequate extrapolation of the results to infinite (see below). Details on this simulation technique can be found elsewhere Gillan (1988); Ceperley (1995); Herrero and Ramírez (2014a). The dynamics considered in the PIMD method is artificial, and does not correspond to the actual quantum dynamics of the real particles under consideration. It is, however, useful for effectively sampling the many-body configuration space, giving precise results for the equilibrium properties of the quantum system. An alternative way to obtain equilibrium properties is Monte Carlo sampling, but this procedure requires for our present problem more computer resources (CPU time) than the PIMD method. In particular, for the latter procedure the codes can be more readily parallelized, which is an important factor for efficient use of modern computer architectures.
Ice VII has a body-centered cubic structure with space group and two water molecules per unit cell Kuhs et al. (1984). For the simulations we generated cubic supercells including = 432 water molecules with periodic boundary conditions. In these supercells, hydrogen-disordered ice structures were generated by a Monte Carlo procedure, in such a way that each oxygen atom had two covalently bonded and two H-bonded hydrogen atoms (Bernal-Fowler rules Bernal and Fowler (1933)). It was also imposed that the electric dipole moment of the generated supercells were close to zero Buch et al. (1998). To quantify the influence of hydrogen disorder on the results presented below, we carried out PIMD simulations for six different hydrogen arrangements. We found that the dispersion of the results found for the different H configurations was smaller than the statistical error bars obtained from simulations for a single H arrangement. This was taken as an indication that the supercell size considered here was enough to adequately represent the proton disorder in ice VII, in accord with earlier results for this ice phase Ramírez et al. (2013).
Interatomic interactions have been modeled here by the point charge, flexible q-TIP4P/F model, which was applied earlier to study liquid water Habershon et al. (2009); Ramírez and Herrero (2011), ice Ramírez and Herrero (2010); Herrero and Ramírez (2011a, b), and water clusters Gonzalez et al. (2010). Several empirical potentials previously used for simulations of condensed phases of water treat H2O molecules as rigid bodies Hernández de la Peña et al. (2005); Miller and Manolopoulos (2005); Hernández de la Peña and Kusalik (2006). This may be convenient for computational efficiency, giving reliable results for various properties of liquid water and ice, but they disregard the contribution of molecular flexibility in the structure and dynamics of condensed phases of water Habershon et al. (2009), aspects which may be relevant for our present purposes. In particular, a flexible water molecule allows us to study correlations between the intramolecular O–H distance and the geometry of intermolecular H-bonds, known to appear in ice Holzapfel (1972); Nygård et al. (2006). Also, the appreciable anharmonicity of the intramolecular O–H vibration is described by anharmonic stretches in the q-TIP4P/F potential, which allows to study changes in the intramolecular O–H distance as a function of temperature and pressure, as well as compare results for classical and quantum simulations (see below).
It has been reported as a limitation of the q-TIP4P/F effective potential that it is unable to predict the stability region of the low-pressure phase ice II Habershon and Manolopoulos (2011). This result was derived from free energy calculations based on classical simulations of ices Ih, II, and III, which indicated that ice II was not the stable phase in any region of the studied plane (down to = 200 K). It has been later reported that ice II appears as the stable phase in a broad region of the phase diagram when nuclear quantum effects are taken into account, basically due to the lower zero-point energy of this water phase, as compared to ices Ih and III Ramírez et al. (2012b). This shows that path-integral simulations can help to elucidate structural and thermodynamic aspects of different ice phases, especially in cases where energy (or free energy) differences derived from classical calculations turn out to be small.
Simulations of ice VII have been carried out here in the isothermal-isobaric ensemble, which allowed us to find the equilibrium volume of the solid at given pressure and temperature. We used effective algorithms for performing PIMD simulations in this statistical ensemble, as those described in the literature Martyna et al. (1996); Tuckerman and Hughes (1998); Martyna et al. (1999); Tuckerman (2002). In particular, we employed staging variables to define the bead coordinates, and the constant-temperature ensemble was generated by coupling chains of four Nosé-Hoover thermostats to each staging variable. An additional chain of four barostats was coupled to the volume to yield the required constant pressure,Tuckerman and Hughes (1998) which was computed along the simulations by using a virial expression adequate for PIMD simulations (see Eq. (50) in Ref. Herrero and Ramírez (2014a)).
Sampling of the configuration space has been carried out at temperatures between 50 K and 450 K, and pressures between 1 bar and 12 GPa. In some particular cases, we performed simulations at = 25 K, in order to check the low-temperature convergence of the data. For comparison with results of PIMD simulations, some classical molecular dynamics (MD) simulations of ice VII have been also carried out. This can be realized in our context by setting the Trotter number = 1.
Other technical details about the simulations presented here are the same as those employed and described earlier in Herrero and Ramírez (2011a, b). The Trotter number was taken proportional to the inverse temperature (), so that = 6000 K, which keeps roughly a constant precision in the PIMD results at different temperatures. The largest error associated to the finite Trotter number is caused by the vibrational modes with highest frequency, i.e., the intramolecular O–H stretching modes. This has been corrected by carrying out some simulations with larger , and extrapolating results of the studied properties for as explained elsewhere Ramírez et al. (2012a). The results shown below are the extrapolated ones, after correcting the error due to the finite . In the PIMD simulations, the time step associated to the calculation of interatomic forces was taken in the range between 0.1 and 0.3 fs, which yielded adequate convergence for the variables studied here. For given temperature and pressure, a typical simulation run consisted of PIMD steps for system equilibration, followed by steps for the calculation of ensemble average properties.
PIMD simulations can be used to obtain insight into the atomic delocalization at finite temperatures. This includes a thermal (classical) delocalization, as well as a delocalization associated to the quantum character of the atomic nuclei, which is quantified by the spatial extension of the paths associated to a given atomic nucleus. For each quantum path, one can define the center-of-gravity (centroid) as
| (1) |
where is the position of bead in the associated ring polymer. Then, the mean-square displacement of the atomic nuclei (H or O in our case) along a PIMD simulation run is defined as
| (2) |
where indicates an ensemble average.
In connection with the quantum delocalization of a particle, a quantity related with its kinetic energy is the spread of the paths associated to it, which can be measured by the mean-square “radius-of-gyration” of the ring polymers:
| (3) |
A smaller (higher particle localization) is associated with a higher kinetic energy, in accordance with Heisenberg’s uncertainty principle Gillan (1988, 1990).
II.2 Quasi-harmonic approximation
We will compare below results of the PIMD simulations with those yielded by a quasi-harmonic approximation (QHA), carried out by using the same q-TIP4P/F interatomic potential. This procedure has been introduced earlier in Ramírez et al. (2012a) and Ramírez et al. (2012b), and we will only present here a brief summary of it.
The Helmholtz free energy of a solid phase with water molecules in a cell of volume and at temperature is given by
| (4) |
where is the static zero-temperature classical energy, i.e., the minimum of the potential energy for volume . is the vibrational contribution to the free energy, which in a quantum approach is given by
| (5) |
where are the frequencies of the harmonic lattice vibrations for volume , with including the phonon branch index and the wave vector within the Brillouin zone. The anharmonicity of the interatomic potential enters in the QHA only through the volume dependence of . In the classical limit the vibrational contribution amounts to
| (6) |
in Eq. (4) is the configurational entropy due to H disorder, and is relevant when comparing different ice phases, in particular H-ordered and H-disordered ones. In our case, it can be taken as the Pauling entropy (Pauling, 1935) or that given by some more elaborate calculations Herrero and Ramírez (2013b, 2014b), but its actual value does not affect the results discussed here.
III Results
III.1 Volume
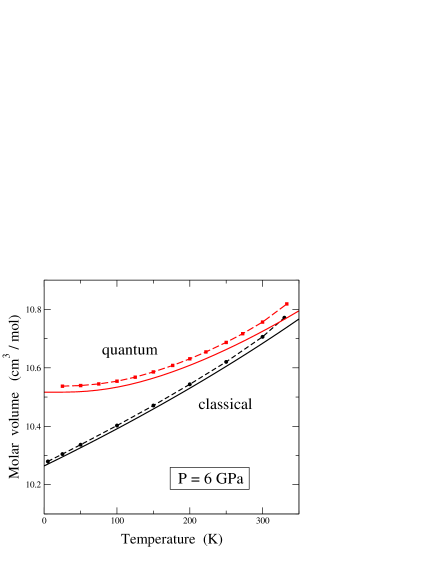
We first present results for the equilibrium volume of ice VII, as derived from our PIMD simulations. In Fig. 1 we show the temperature dependence of the molar volume at a pressure = 6 GPa, in the temperature range where the solid was found to be stable or metastable in the simulations (up to 330 K). Results of the quantum simulations are given as solid squares. For comparison, we also present data points derived from classical MD simulations (solid circles), as well as results of classical and quantum QHAs (solid lines). Looking at the results of the simulations, one observes the lattice expansion due to quantum nuclear motion, which is most appreciable at low temperatures. At 25 K, we find = 10.305 cm3/mol in the classical approach vs 10.537 cm3/mol in the quantum simulations. This means a low-temperature lattice expansion of 0.232 cm3/mol, i.e., an increase of 2.3% with respect to the classical estimate. This relative lattice expansion is somewhat smaller than that found for ice Ih at low temperatures and ambient pressure ( 4%), in agreement with the fact that it is expected to decrease as pressure is raised Herrero and Ramírez (2011a, b).
For ice VII at = 6 GPa, the quantum QHA gives values of the molar volume smaller than the PIMD simulations by about 0.02 cm3/mol (a difference of about 0.2%), and this difference increases slowly as the temperature is raised. In the classical approach, both methods yield similar results at low temperatures, and the difference between them also increases for rising as in the quantum case, since anharmonicity becomes more relevant.
An interesting aspect of Fig. 1 is the absence of a negative thermal expansion in the whole temperature range, contrary to what happens for low-pressure phases such as hexagonal ice Ih, and observed in PIMD simulations Herrero and Ramírez (2011a) as well as in diffraction experiments Röttger et al. (1994). This negative expansion has been interpreted as being due to the tetrahedral coordination of water molecules in ice Ih, along with the large cavities (vacant space) present in its structure. Although the H-bond network in ice VII has also a tetrahedral structure, such cavities are not present in it because of the existence of two subnetworks filling the empty space, with the associated increase in density.
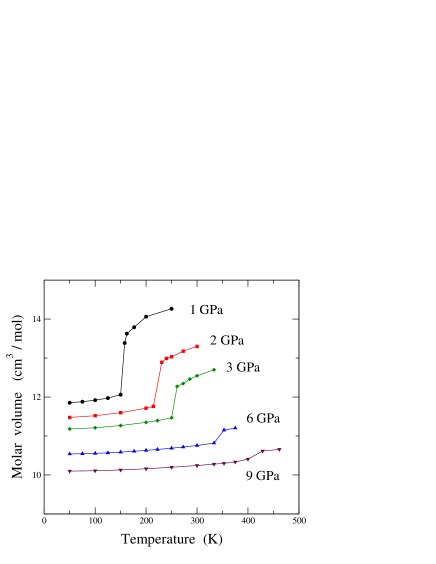
In a recent study of the phase diagram of ice using the q-TIP4P/F potential, it was found that ice VII is the stable phase only for pressures larger than 6 GPa and 70 K Ramírez et al. (2013). Thus, our results for 6 GPa correspond to metastable ice VII. In this pressure region, it is known that for a given value of , ice VII becomes unstable at a certain temperature that rises with , and the crystalline solid melts giving rise to an amorphous phase Slovak and Tanaka (2005); Yoshimura et al. (2006). This behavior has been reproduced by our PIMD simulations. In Fig. 2 we present the molar volume of ice VII as a function of temperature at five different pressures. The three upper curves correspond to metastable ice VII, and their metastability limit is observed for each pressure as a jump in the volume. At 1 GPa, this jump occurs at about 150 K, and evolves to higher temperatures as the pressure is raised. The two lower curves (for 6 and 9 GPa) correspond to the pressure region where ice VII is the stable phase Ramírez et al. (2013), and a jump in the molar volume is observed at 350 and 400 K, respectively.
Even though our main interest here is focused on ice VII, it is worth commenting about the phases we observed in PIMD simulations when ice VII became unstable by increasing the temperature. According to the obtained radial distribution functions (RDFs), for 6 GPa we found an amorphous phase similar to those described earlier by Slovák and Tanaka Slovak and Tanaka (2005) from classical molecular dynamics simulations using TIP4P and SPC/E potentials. These authors explored the possibility of generating model structures of low-density amorphous ice by computationally heating ice VII. For = 6 and 9 GPa, we found an ice structure, which according to the RDF is compatible with the plastic crystal phase detected earlier in various computational studies of ice in this pressure region, using different interatomic potentials Takii et al. (2008); Himoto et al. (2011); Aragones et al. (2009); Aragones and Vega (2009). It is remarkable that the RDF obtained here from PIMD simulations using the q-TIP4P/F potential is very similar to that reported earlier for the body-centered cubic plastic crystal Aragones et al. (2009); Aragones and Vega (2009).
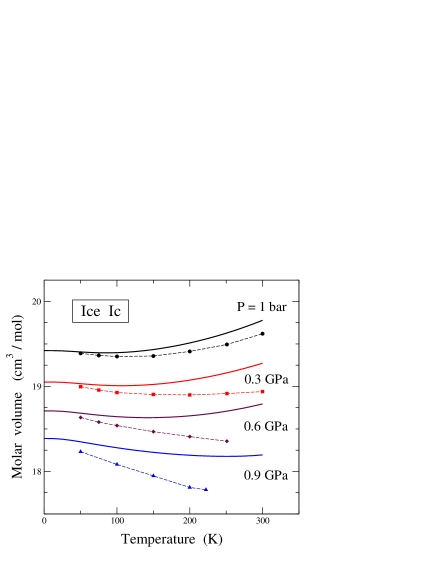
As mentioned in the Introduction, it is worthwhile comparing results of PIMD simulations for a cubic high-pressure phase of water with those derived for a cubic low-pressure phase such as ice Ic. Thus, the temperature dependence of cubic ice Ic is shown in Fig. 3 for several pressures. Again, symbols represent results of PIMD simulations, and solid lines were obtained in a quantum QHA. At ambient pressure ( = 1 bar), the molar volume displays a minimum at about 120 K, similarly to that reported earlier for PIMD simulations of hexagonal ice Ih at this pressure Herrero and Ramírez (2011a). In fact, the results for the molar volume of Ih and Ic ices derived from the simulations coincide within error bars. For increasing pressure, one observes that the minimum of the volume shifts towards higher temperatures, and eventually disappears when this ice phase becomes unstable. Results of the QHA present qualitatively the same trend for the molar volume of ice Ic as the PIMD data, but the former overestimates the negative thermal expansion. This is a case where the PIMD and QHA results are appreciably different, as a consequence of the instability appearing in ice Ic (as in ice Ih), which causes the collapse of the crystal structure at a pressure of about 1 GPa Mishima et al. (1984); Herrero and Ramírez (2011b).
The negative thermal expansion of ice Ic shown in Fig. 3 is due to the negative Grüneisen parameter of low-energy transverse acoustic (TA) modes, related to librational motion of water molecules. For a vibrational mode with frequency , the parameter is defined as the logarithmic derivative of with respect to the crystal volume Ashcroft and Mermin (1976):
| (8) |
At relatively low temperature, low-energy modes are more populated than modes with higher energy (with positive ), and then the overall contribution to the volume change with increasing temperature will be negative Herrero and Ramírez (2011a). In this context, the larger negative thermal expansion of ice Ic derived from the QHA, with respect to the results of PIMD, is due to an overestimation of the negative value of for TA modes in the QHA. Such overestimation increases for rising pressure, as shown in Fig. 3.
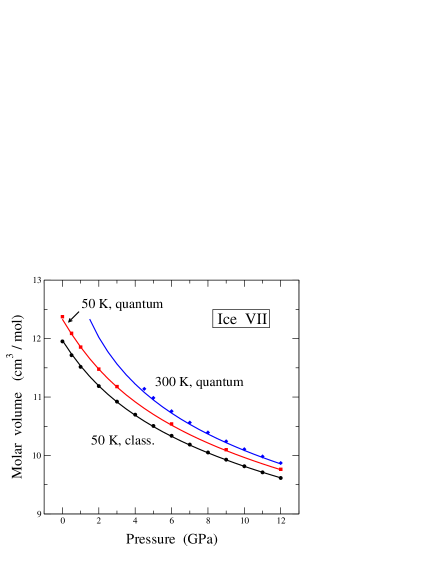
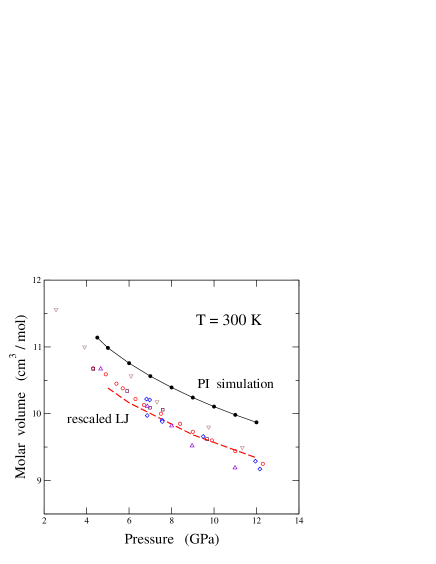
Turning now to the high-pressure phase, in Fig. 4 we show the pressure dependence of the molar volume of ice VII, as obtained from simulations with the q-TIP4P/F potential. Symbols indicate simulation results, whereas lines were derived from QHAs, both classical and quantum. Two temperatures are shown: 50 K and 300 K. At 50 K, both classical and quantum data are given, and at 300 K only the quantum results are shown (the classical ones lie slightly below the quantum data, and are not displayed to avoid overcrowding of the figure).
The quasi-harmonic approximation gives a good description of the equation of state of ice VII in both cases, quantum and classical. At 300 K, the PIMD simulations yield volumes slightly higher than the QHA, but the difference between both methods decreases as the pressure is raised. This is in line with earlier observations that the QHA becomes more accurate to describe structural properties of solids under high pressures Pollock et al. (1972). This is related to the pressure (or volume) dependence of the vibrational and elastic contributions to the free energy in Eq. (4). For high pressures (small volumes), the internal energy is dominated by the elastic contribution , which becomes much larger than the vibrational energy, and hence the influence of lattice vibrations (and of their anharmonicity) on thermodynamic properties comparatively decreases Herrero and Ramírez (2005). This means that the anharmonicity of the vibrational modes not captured by the QHA becomes less relevant for high pressures. On the contrary, we emphasize that the relative error of the QHA (compared with PIMD simulations) increases as temperature is raised, as expected for an increased anharmonicity due to thermal effects and shown in Fig. 1. This difference between QHA and PIMD usually increases slowly for rising , unless some particular anomaly appears for the vibrational frequencies, as happens close to the stability limit of a solid phase (see Fig. 3 for ice Ic, which becomes unstable for 1 GPa). In such a case, the QHA also becomes less accurate for increasing , contrary to the general trend discussed above.
One also observes in Fig. 4 that the difference between quantum and classical results at 50 K decreases as rises. This difference amounts to 0.42 cm3/mol for = 1 bar vs 0.15 cm3/mol for = 12 GPa, i.e., the quantum-induced volume expansion decreases from a 3.5% to a 1.6% in this pressure range. This is in line with the fact that the classical model become more and more accurate to describe structural and thermodynamic properties of solids at high pressures. This could seem at first sight contradictory with the fact that pressure induces a larger zero-point vibrational energy of the solid, of purely quantum nature, because of the overall increase of vibrational frequencies with rising pressure. However, the relevant factor here is again (as for the QHA) the ratio of the vibrational energy to the whole internal energy of the solid. Since in this respect the lattice vibrations become less relevant as pressure rises, and eventually give a relatively small contribution to the free energy of the solid, their actual description by a classical or a quantum model becomes less important for solids under large pressures Etters and Danilowicz (1974); Herrero and Ramírez (2005). This is not necessarily true for spectroscopic properties of solids, since vibrational frequencies predicted by a QHA or by a classical model are not guaranteed to describe correctly the actual ones for high pressure. Moreover, the above considerations on structural and thermodynamic properties apply to isolated phases such as ice VII here, but dynamical quantum effects can be crucial to describe phase transitions between different ice phases, as happens for H-bond symmetrization in the transition from ice VII to ice X Benoit et al. (1998); Kang et al. (2013); Bronstein et al. (2014).
An interesting question related to our simulations of H-disordered ice VII refers to the dispersion in calculated volumes for different realizations of H disorder on the simulation supercell. As indicated in Sec. II.A, we have considered six realizations for the H distribution according to the ice rules, and differences between the resulting volumes were less than the symbol sizes in Figs. 2 and 4. Thus, at 50 K our PIMD simulations yielded volume differences in the order of cm3/mol. We note that this value is much smaller than the volume difference between ice VII and its H-ordered counterpart ice VIII, for which we found from PIMD simulations a molar volume of 12.333 cm3/mol at 1 bar and 50 K, i.e., 0.041 cm3/mol less than that found for ice VII a the same conditions.
Most measurements of the curve for ice VII have been performed at or close to room temperature. In Fig. 5 we display the results of our PIMD simulations for the molar volume at 300 K, along with data derived by several authors from X-ray diffraction experiments. At this temperature, ice VII turns out to be unstable in PIMD simulations with the q-TIP4P/F potential at pressures 4 GPa, so that 4.5 GPa is the lowest pressure plotted in this figure for the simulation data. Although there is some dispersion in the diffraction data, the molar volumes obtained from experiment are smaller than those predicted by the simulations. The difference between calculated and actual volumes decreases as pressure is reduced, and both seem to converge at low pressures. This could be expected from the good agreement obtained for low-pressure phases (ices Ih, II, and III), between measured molar volumes and those derived from PIMD simulations with the q-TIP4P/F potential model Ramírez et al. (2012a).
At 4.5 GPa the simulations overestimate the molar volume of ice VII by about a 4%, and this difference increases as pressure grows, reaching a 6% at 12 GPa. We have investigated the origin of this drawback of the q-TIP4P/F potential model at high pressures, and found that the solid becomes “stiff” mainly due to the Lennard-Jones-type contribution to the interaction between adjacent molecules in different subnetworks. To check this, we have carried out some PIMD simulations with a modified q-TIP4P/F potential where this contribution was rescaled by a factor less than one, so that the repulsion between water molecules in both subnetworks was reduced. The dashed line in Fig. 5 corresponds to a simulation with such a factor taken to be 0.6, which means that the Lennard-Jones interaction between different H-bond subnetworks was reduced by a 40%. With such a correction in the interatomic potential, the simulation results are much closer to those derived from diffraction data, especially at pressures higher than 6 GPa. This shows a limitation of this kind of interatomic potentials for studying water phases at very high pressures. An ad hoc modification of the potential may improve the description of some features of these phases, but it is not clear that it can give a good overall description of their structural and thermodynamic properties. A similar conclusion was drawn by Aragones et al. Aragones et al. (2009) from their classical Monte Carlo simulations with a potential model of rigid water.
We finally note in this Section, that the results found for the molar volume of ice VII using classical molecular dynamics simulations with the q-TIP4P/F potential are close to those obtained earlier employing the TIP4P/2005 model. Thus, we have found at 300 K and pressures of 4.5 and 7 GPa, molar volumes = 11.060 and 10.514 cm3/mol, respectively. These values are near those reported in Ref. Aragones et al. (2009) for the TIP4P/2005 potential ( = 11.077 and 10.545 cm3/mol), and higher than those found for the TIP5P potential model (10.418 and 9.923 cm3/mol). A similar conclusion is drawn from a comparison of zero-pressure results at 70 K with those given in Ref. Slovak and Tanaka (2005). For these conditions, we find a classical result for the molar volume of 12.036 cm3/mol, clearly higher than the value found for the TIP5P potential (11.288 cm3/mol), and closer to the SPC/E (11.931 cm3/mol) and TIP4P results (11.876 cm3/mol).
III.2 Bulk modulus
The compressibility of ice phases displays peculiar properties related to their H-bond networks. For low-pressure phases, is smaller than what one could at first sight expect from the large cavities present in their structure, which could be supposed to collapse under pressure without water molecules approaching close enough to repel each other. This is however not the case for low pressure, and for ice Ih the hydrogen bonds holding the crystal structure are stable up to relatively high pressures in the order of 1 GPa, when the H-bond network breaks down giving rise to high-density amorphous ice Mishima et al. (1984). For high-pressure ice phases such as ice VII, the compressibility has been studied by several authors in its stability region. In this case, the presence of two H-bond networks stabilizes the structure up to pressures of about 60 GPa, where the H-bonds become symmetric and the transition to ice X occurs.
The isothermal compressibility of ice, or its inverse the bulk modulus [] can be straightforwardly obtained from our PIMD simulations in the isothermal-isobaric ensemble. Calling the volume of the ice supercell along a simulation run, the isothermal bulk modulus can be calculated from the mean-square fluctuations of , , by employing the expression Landau and Lifshitz (1980); Herrero (2008)
| (9) |
Note that in our notation one has . Eq. (9) has been used earlier to obtain the bulk modulus of different types of solids from path-integral simulations Herrero and Ramírez (2000); Herrero (2008); Herrero and Ramírez (2011b).
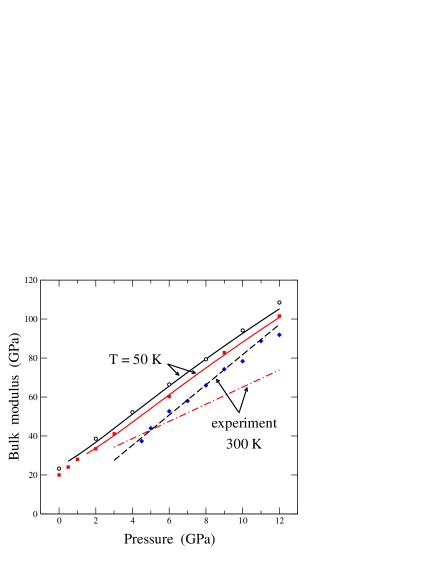
In Fig. 6 we present data of the isothermal bulk modulus of ice VII as a function of pressure. Symbols indicate results of simulations with the q-TIP4P/F potential. As in Fig. 4 data are shown for PIMD simulations at 50 K (solid squares) and 300 K (solid diamonds), as well as for classical MD simulations at 50 K (open circles). Solid lines represent results of classical and quantum QHAs at 50 K. These lines follow closely the results of the corresponding simulations, classical and quantum, in the pressure region considered here. From a linear fit of the PIMD results, we find a pressure derivative of the bulk modulus: = 6.8(1) and 7.2(2), at 50 and 300 K, respectively. The dashed and dashed-dotted lines indicate the pressure dependence of the bulk modulus at 300 K, as derived from the equation of state obtained in Loubeyre et al. (1999) and Frank et al. (2004) from X-ray diffraction measurements. The results by Loubeyre et al. Loubeyre et al. (1999) (zero-pressure bulk modulus: = 4.26 GPa; pressure derivative: = 7.75) lie close to those obtained from the quantum simulations, but other data such as those by Frank et al. Frank et al. (2004) ( = 21.1 GPa, = 4.4; dashed-dotted line) are smaller at pressures higher than 6 GPa.
We note that values of calculated from PIMD simulations in the isothermal-isobaric ensemble display relative error bars larger than those obtained for other variables (e.g., molar volume, kinetic energy, or interatomic distances), due to the statistical uncertainty in the volume fluctuations , used to calculate the bulk modulus. An alternative way to obtain can consist in calculating numerically the derivative from the curve at a temperature . This procedure yields results that coincide within error bars with those found from the volume fluctuations using Eq. (9).
III.3 Interatomic distances
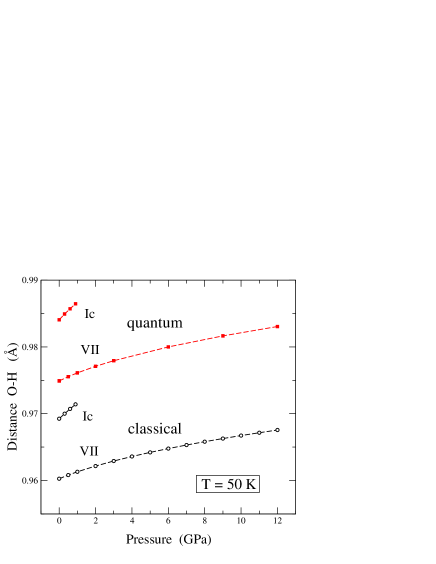
In this section we present results for interatomic distances in ice VII. This can shed light on the structural changes suffered by the crystal when temperature and/or pressure are modified. In Fig. 7 we show the mean O–H distance in ice VII as a function of the applied pressure at = 50 K. Solid symbols represent results of PIMD simulations, whereas open circles indicate data obtained from classical MD simulations. For comparison we also display results for ice Ic at the same temperature, in the pressure region where this phase is stable (1 bar 1 GPa). One observes first that for a given pressure, the distance O–H derived from the quantum simulations is larger than that found in the classical ones. For ice VII this difference is roughly constant in the pressure region under consideration, and amounts to 0.015 Å (1.5% of the bond length). This bond expansion due to quantum motion is similar to that found for ice Ih Herrero and Ramírez (2011b).
Second, one finds that the O–H distance increases as pressure is raised. This seems in principle to be opposite to the usual contraction of atomic bonds under hydrostatic pressure, and could also seem surprising given the pressure-induced volume contraction. This is, however, characteristic of ice structures with hydrogen bonds connecting water molecules, and can be explained as follows. Increasing the pressure reduces the crystal volume, i.e. the interatomic distance between adjacent oxygen atoms decreases in the bcc lattice of ice VII. This causes a strengthening of intermolecular H-bonds, which is associated to a weakening of the intramolecular bonds, and with an increase in interatomic O–H distance in water molecules. An additional argument in favor of this reasoning is the softening of O–H stretching modes as pressure increases, observed in infrared absorption experiments on ice VII Klug and Whalley (1984); Song et al. (2003a).
Comparison of results for ices VII and Ic shows that the O–H bond expansion due to quantum nuclear motion is similar in both cases. The intramolecular O–H bond distance is larger for ice Ic than for ice VII, which is associated with a weaker covalent bond in ice Ic. The origin of this is the following. The molar volume of ice Ic obtained from PIMD simulations at 50 K and 1 bar amounts to 19.39 cm3/mol, much larger than the result for ice VII for the same pressure and temperature, = 12.09 cm3/mol (as expected for this high-pressure phase). In spite of this, the intermolecular O–O distance is larger in ice VII than in ice Ic, because the diamond-like structure of ice Ic contains large void regions, which are occupied by water molecules in ice VII. We found in the PIMD simulations with the above conditions: (O–O) = 2.99 Å for ice VII vs 2.76 Å for ice Ic. Thus, larger O–O distances in ice VII imply weaker H-bonds between water molecules, stronger intramolecular O–H bonds, and therefore smaller O–H distances, as observed in Fig. 7. This is in line with the local intra-intermolecular geometric correlation found for liquid and solid water, relating the intramolecular O–H bond length to the corresponding H-bond geometry Holzapfel (1972); Nygård et al. (2006).
One also observes in Fig. 7 that the change of O–H distance with pressure is clearly larger for ice Ic, in accordance with a larger compressibility of this low-pressure phase. In fact, the bulk modulus of Ic is found to be 14.2 GPa vs 20.0 GPa for ice VII (at 1 bar and 50 K). In the range from 1 bar to 12 GPa we find for ice VII a mean rise in O–H bond distance of Å/GPa. However, for pressures smaller than 2 GPa, a larger increase rate of about Å/GPa is obtained. These values are smaller than those estimated from changes of stretching frequencies in Klug and Whalley (1984) ( Å/GPa).
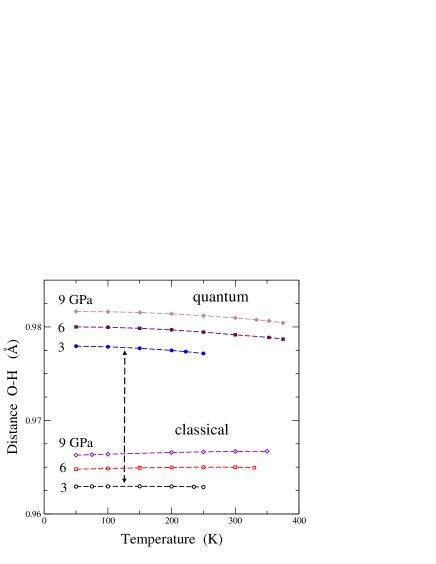
We now turn to the temperature dependence of the O–H distance in ice VII. In Fig. 8 we show the mean O–H distance for three pressures ( = 3, 6, and 9 GPa), as derived from classical (open symbols) and quantum (solid symbols) simulations. For the classical results at = 3 GPa, we find that (O–H) is rather constant up to 250 K, the highest temperature at which we found this ice phase to be metastable. For = 6 and 9 GPa, (O–H) is found to increase slightly with rising temperature. For the PIMD results, however, we find that the O–H distance decreases for increasing temperature in the three cases shown in Fig. 8, so that the difference between classical and quantum results is slowly reduced as temperature rises.
The quantum results display clearly the anomalous trend observed for various phases of ice, for which the covalent O–H bond in water molecules contracts for increasing temperature. The argument is similar to that given above for the pressure dependence of the intramolecular O–H distance. Given a pressure , for rising the molar volume and the mean O–O distance increase, so that H-bonds between contiguous molecules become weaker. The covalent O–H bonds are then stronger and the intramolecular O–H distance is smaller. This behavior is not captured by the classical MD simulations of ice VII. In fact, there is a competition between the usual trend of bond distances to increase for rising (in both quantum and classical models), and the trend to increase because of the weakening of the O–H bond. In the classical simulations, the former effect dominates due to the smaller atomic delocalization, whereas in the quantum model the latter effect is more relevant.
There have appeared in the literature some data for the covalent O–D bond length in high-pressure phases of D2O, derived from neutron diffraction measurements. For ice VIII, this length is similar to that yielded by our simulations, i.e., (O-D) between 0.97 and 0.98 Å for from 2 to 10 GPa Nelmes et al. (1993); Besson et al. (1994). For D2O ice VII, this distance was found to be smaller by Klotz et al. Klotz et al. (1999) Thus, at 98 K these authors found (O-D) in the range from 0.92 to 0.93 Å for pressures between 2 and 6 GPa. In ice VII, however, the presence of H-disorder (and the associated oxygen displacements) causes some uncertainties in the refinement of the diffraction data, which can be analyzed in different ways Nelmes et al. (1998).
III.4 Kinetic energy
In this section we discuss the kinetic energy of hydrogen in ice VII. First, we note that the kinetic energy of atomic nuclei in molecules or solids depends on the mass and spatial delocalization of the considered nucleus. In a classical model, each degree of freedom contributes to the kinetic energy by an amount proportional to the temperature, , as granted by the equipartition principle. In a quantum approach the kinetic energy, , provides us with information on the environment and interatomic interactions seen by the particle under consideration. A common quantum effect associated to atomic motion in solids is that the kinetic energy at low temperature converges to a finite value characteristic of zero-point motion, in contrast to the classical result that vanishes for K. Path integral simulations allow one to calculate the kinetic energy of quantum particles, which is related to the spread of the quantum paths. In fact, for a particle with a certain mass at a given temperature, the larger the mean-square radius-of-gyration, [see Eq. (3], the smaller the kinetic energy, since larger quantum delocalization yields a reduction in Gillan (1988); Herrero and Ramírez (2011a). Here we have calculated (H) in ice VII by using the so-called virial estimator, which is known to have a statistical uncertainty appreciably smaller than the potential energy of the system Herman et al. (1982); Tuckerman and Hughes (1998).
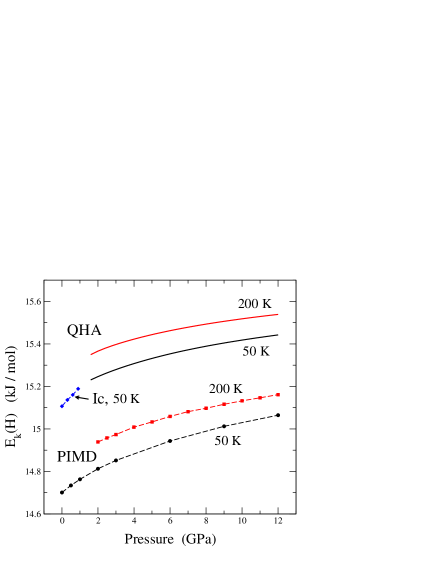
In Fig. 9 we present (H) as a function of pressure at = 50 and 200 K. Symbols (circles and squares) correspond to results of PIMD simulations, and solid lines represent the kinetic energy derived from the QHA. In both cases, the results at 200 K are higher than those found at 50 K, as expected from the usual thermal activation of vibrational modes. For a given temperature, (H) increases as pressure is raised, in agreement with an overall increase of vibrational frequencies for increasing pressure.
We also show in Fig. 9 the kinetic energy of hydrogen in ice Ic, as obtained from PIMD simulations at 50 K. It is higher than that corresponding to ice VII at the same temperature in the range from 1 bar to 1 GPa. This is mainly due to the weakening of H-bonds in ice VII, as compared with ice Ic, since the O–O distance is larger in ice VII (see above). The contribution of O–H stretching modes to (H) is larger in ice VII (stronger covalent bonds, with larger zero-point energy), but it is largely compensated for by the contribution of librational modes (weaker H-bonds in ice VII). We note that the QHA gives for ice Ic at = 50 K and = 1 bar a kinetic energy (H) = 15.47 kJ/mol (not shown in the figure), i.e., a value somewhat larger than that predicted by this approximation for ice VII at low pressure, in line with the results of PIMD simulations for both ice phases.
We note that the actual momentum distribution of quantum particles can be derived from atomistic simulations using open path integrals, in contrast with the closed paths employed here to specify the statistical partition function Feynman (1972). In this context, an estimator for the end-to-end distribution of the Feynman paths was introduced by Lin et al. Lin et al. (2010), giving the Fourier transform of the momentum distribution.
In connection with the pressure dependence of the kinetic energy of hydrogen in ice VII, Finkelstein and Moreh Finkelstein and Moreh (2013) have recently presented a calculation based on a harmonic approximation with vibrational frequencies taken from experimental data at = 300 K and various pressures. In these calculations, (H) was found to decrease in a large range of pressures, in particular in the region between 5 and 12 GPa, which overlaps with our calculations. The main reason for this decrease is the softening of the O–H stretching modes for rising pressure. These calculations involved five representative frequencies for the various vibrational modes present in ice VII (translation, libration, bending, symmetric and asymmetric stretching), and not the whole vibrational density of states of the solid, but one expects that the main features of the vibrational energy should be captured by such a model.
This behavior of (H) is associated to the decrease of stretching frequencies as pressure is raised, discussed above in connection with the pressure-dependence of the molar volume. Such frequency changes as a function of pressure (or volume) are usually quantified by means of the Grüneisen parameters , defined above in Eq. (8). In most solids, these parameters are usually positive, but in several solid phases of water for TA vibrational modes, related to librational motion, and O–H stretching modes are known to be negative. As indicated above, the negative values of for TA modes in ice Ic, are related to the negative thermal expansion shown in Fig. 3. Moreover, a negative value of for the stretching modes causes a decrease in (H) for ice VII, as that calculated in Finkelstein and Moreh (2013). The q-TIP4P/F potential gives a negative Grüneisen parameter for the stretching vibrations Pamuk et al. (2012) (), but it is not negative enough to reproduce the inverse isotope effect in ice Ih Herrero and Ramírez (2011a), which has been found from diffraction experiments Röttger et al. (1994), i.e., the molar volume of D2O ice is larger than that of H2O ice.
To understand the effect of a negative value of for stretching modes on the kinetic energy of hydrogen, we have calculated (H) in the QHA using the vibrational density of states derived from the q-TIP4P/F potential, but with the stretching frequencies rescaled by different factors. From the definition of the Grüneisen parameter for a mode [see Eq. (8)], one has for small volume changes ():
| (10) |
where is the vibrational frequency for the reference volume . Thus, we have recalculated the frequency of the stretching modes by using Eq. (10) with a renormalized , for several values of the parameter between 1 and 2.2. The other modes are left unaltered, with the frequencies obtained from the q-TIP4P/F potential.
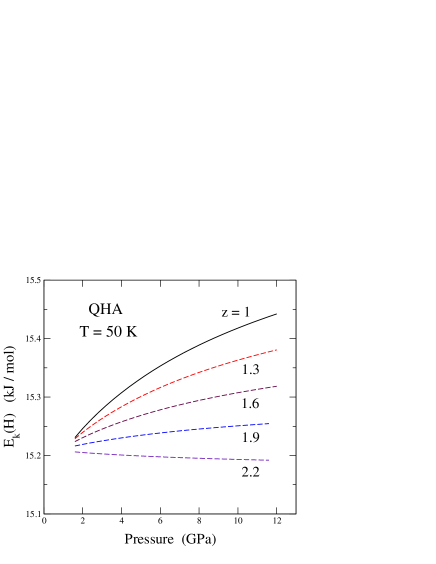
In Fig. 10 we display the dependence of (H) on pressure, as given by the QHA at = 50 K. The solid line with a label “” coincides with the curve shown in Fig. 9 for this temperature. The four other curves have been obtained by introducing in the QHA the stretching frequencies obtained from Eq. (10) by scaling with the factors indicated by the labels ( = 1.3, 1.6, 1.9, ad 2.2). Since are negative for the stretching modes, this correction makes them more negative, thus favoring a faster decrease of the corresponding frequencies as the volume is reduced (or pressure is raised). For , (H) is found to decrease for rising pressure, similarly to the results presented in Finkelstein and Moreh (2013). This indicates the crucial role of stretching modes for the pressure dependence of the vibrational energy. A large contribution of these vibrational modes to the kinetic energy could be expected from their high frequency, as compared to the other modes in this solid. The pressure-dependence of (H) is however largely controlled by the parameters , which turn out to be negative for the stretching modes in condensed phases of water. Such a dependence is a critical check for interatomic potentials in this kind of molecular solids.
III.5 Atomic delocalization
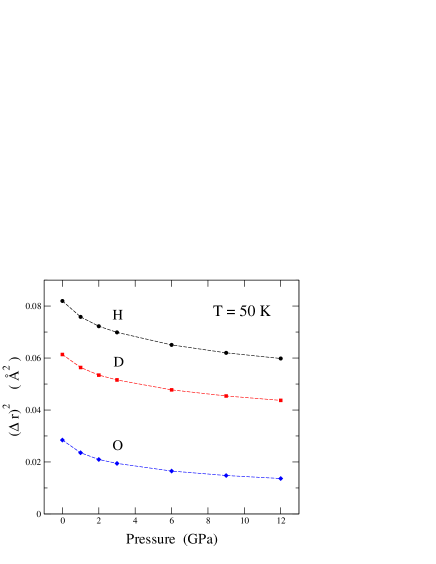
Here we present results for the atomic mean-square displacements defined in Eq. (2). The spatial delocalization of atomic nuclei in ice VII is expected to be larger for hydrogen than for oxygen, because of the smaller mass of the former atom. In Fig. 11 we show values of for hydrogen and oxygen at 50 K as a function of pressure. At a given pressure, decreases as the pressure is raised, i.e., both H and O atoms become more spatially localized. For H, decreases from Å2 for = 1 bar to Å2 for 12 GPa, which means a reduction of a 37% in this pressure region. For oxygen, decreases from Å2 to Å2, i.e., by a factor of 2.
Results of of H and O in ice VII at ambient pressure are similar to those found earlier for hexagonal ice Ih at the same conditions. Thus, for ice Ih at 50 K and 1 bar, it was found Å2 for hydrogen and Å2 for oxygen Herrero and Ramírez (2011b). For this low-pressure ice phase, however, it was found that rising the pressure causes an increase in for both H and O, contrary to the decrease found here for ice VII at the same temperature. This behavior for ice Ih is indeed associated to the destabilization of the crystal structure, which breaks down at a pressure 1 GPa, with the consequent amorphization of the solid. For cubic ice Ic we have found values of coinciding within error bars with those corresponding to ice Ih, and also the same behavior has been found in both ice phases for increasing pressure. No such anomalies are found for the atomic delocalization in ice VII in the whole pressure region studied here.
In general, given a pressure, is expected to increase as temperature is raised. Such an increase has been obtained in the whole region where ice VII was found to be stable or metastable in our PIMD simulations. Thus, at = 6 GPa, for H increases from Å2 at 50 K to 0.120 Å2 at 300 K, i.e., by almost a factor of 2. At given temperature and pressure, is larger for hydrogen than for oxygen, but the difference between both decreases for increasing temperature. Thus, at = 50 K and = 6 GPa, for hydrogen is 3.9 times the mean-square displacement of oxygen, whereas this ratio decreases to 2.2 at 300 K. This reflects the fact that the larger quantum delocalization of hydrogen becomes comparatively less relevant as temperature increases.
The mean-square displacement of a given atomic nucleus can be divided as , i.e., a “purely quantum” contribution originating from the spread of the quantum paths [see Eq. (3)], and another, , given by the spatial displacement of the centroid of the paths, that can be derived from the motion of along a PIMD trajectory Gillan (1988); Herrero and Ramírez (2011a):
| (11) |
This part can be considered as a semiclassical thermal contribution to , as at high it converges to the mean-square displacement given by a classical model.
At 50 K and 1 bar, represents a 71% of for hydrogen and a 37% for oxygen, since the quantum contribution to the atomic delocalization is more important for hydrogen. This can be also seen by comparing directly values of for both atomic species, which result to be 5.5 times larger for hydrogen than for oxygen at = 50 K and = 1 bar. At low temperatures, the quantum contribution dominates the spatial delocalization , because converges to zero as K. The opposite happens at high temperatures, where the quantum contribution becomes small, eventually disappearing in the classical limit. This high- limit, however, cannot be approached for ice VII due to the onset of melting.
One can estimate a mean extension of the quantum paths of hydrogen from . At 50 K and 1 bar we find an average extension 0.14 Å, which results to be much smaller than the H–H distance in a water molecule, supporting the disregard of quantum exchange between protons in the PIMD simulations Herrero and Ramírez (2011b, 2014a).
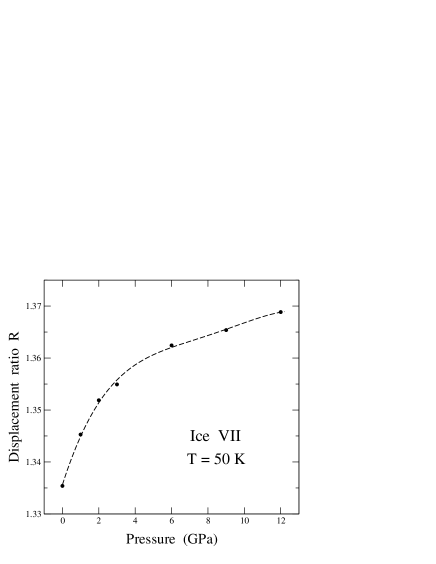
In Fig. 11 we also present results for the mean-square displacement of deuterium in D2O ice VII. This displacement is smaller than for H in H2O ice VII, as expected for the larger mass of deuterium. In a purely harmonic approximation the mean-square displacement of a nucleus at low (say , with a typical frequency of the nuclear motion) scales with the mass as . In the high-temperature (classical) limit, is independent of the mass. Thus, when comparing of H and D in ice VII at 50 K, we expect to find a ratio of mean-square displacements close to . This is in fact what we found from the results of the PIMD simulations, as shown in Fig. 12. In this plot we present the ratio of mean-square displacements as a function of pressure at 50 K. For = 1 bar, we found = 1.34. This ratio rises for increasing pressure, and for = 12 GPa our simulations yielded = 1.37, a value closer to . This increase in is in line with the observation that the description of vibrational motion with a quasi-harmonic model becomes more accurate as pressure is raised (see Sec. III.A).
We note that the mean-square displacements of oxygen and hydrogen are in fact not independent magnitudes, since both H and O participate in several vibrational modes. The spacial displacement corresponding to each atomic species in each mode depends on the mass of both kinds of atoms. This means that for oxygen should be different in H2O and D2O ice VII. This is what we found in the PIMD simulations, with smaller in the second case. Even though this difference is not very large, it is appreciable and at 50 K it amounts to 5.5% for = 1 bar and 3.5% for 12 GPa.
IV Summary
In this paper we have presented results of PIMD simulations of ice VII in the isothermal-isobaric ensemble at several hydrostatic pressures. For a given pressure, these quantum simulations have allowed us to study this solid water phase in the temperature range where it is stable or metastable. The results were compared with those derived from a QHA approximation, as well as with those obtained from classical MD simulations.
The q-TIP4P/F potential model is known to describe fairly well various structural and thermodynamic properties of low-pressure ice phases. Here we have investigated its reliability to predict properties of high-pressure phases such as ice VII. We have found that this flexible interatomic potential predicts rather well the molar volume of this ice phase at relatively low pressures, but it yields volumes that deviate from those derived from diffraction experiments as pressure is increased. Thus, for 12 GPa the molar volume is overestimated by about a 6%.
The molar volume of ice VII decreases with increasing pressure, but the interatomic distances in the solid display a peculiar trend, characteristic of condensed phases of water. Thus, the distance between oxygen atoms in adjacent molecules decreases for increasing pressure, but the intramolecular O–H distance becomes larger as pressure is raised. This results from the intra-intermolecular geometric correlation present in ice, relating the covalent O–H bond length to the corresponding H-bond geometry. As a consequence, a larger molar volume causes a stronger intramolecular covalent bond. This behavior of bond lengths as a function of pressure is similar to that found when temperature is modified: covalent bonds become stronger and H-bonds between water molecules weaken as rises.
The relevance of quantum effects has been assessed by comparing results yielded by PIMD simulations with those given by classical MD simulations. Structural variables are found to change when quantum nuclear motion is taken into account, especially at low temperatures. Thus, the molar volume and interatomic distances change appreciably in the range of pressure and temperature considered here. At 1 bar and 50 K, the molar volume of ice VII is found to rise by 0.42 cm3/mol (a 3.5% of the classical value), and the intramolecular O–H distance increases by 1.5% due to quantum motion.
At a given temperature, the kinetic energy of hydrogen, (H), given by the q-TIP4P/F potential is found to increase for rising pressure. However, the pressure dependence of (H) changes critically with the variation of the frequencies of stretching modes, which are known to display negative Grüneisen parameters. This potential model yields a decrease of these for rising pressure, but it seems to underestimate the value of the corresponding , which should be more negative.
We have analyzed the influence of a hydrostatic pressure on anharmonic effects in ice VII. Our results indicate that the validity of the QHA to describe structural and thermodynamic properties of this water phase increases as pressure is raised. This is mainly a consequence of the relative importance of elastic and vibrational energy, with the former becoming increasingly dominant as pressure increases. Consequently, the precision requirements for a good description of anharmonic vibrational modes is reduced with rising pressure. It has been also argued that structural properties of solids under pressure can be described rather accurately by a classical model for the lattice vibrations. The reason for this is similar to the decreasing of anharmonicity as pressure rises, because in this respect the actual description of the lattice vibrations by a classical or a quantum model becomes less important for solids under high pressures. This is questionable for spectroscopic features of high-pressure phases when a certain accuracy is required, since vibrational frequencies predicted by a classical model or a QHA are not guaranteed to describe precisely the actual ones for high pressure. All this applies to structural properties of an isolated ice phase, but quantum motion of protons has been found to be relevant for high-pressure transitions between ice phases, as in the H-bond symmetrization taking place in the transition from ice VII to ice X.
We finally note that this kind of atomistic simulations of high-pressure phases of water could be improved by the design of interatomic potentials describing accurately their equation of state. This may probably be achieved by adapting present-day potential models, modifying the short-range intermolecular interactions to allow for a larger compressibility at high pressures.
Acknowledgements.
This work was supported by Dirección General de Investigación, MINECO (Spain) through Grant FIS2012-31713.References
- Eisenberg and Kauzmann (1969) D. Eisenberg and W. Kauzmann, The Structure and Properties of Water (Oxford University Press, New York, 1969).
- Petrenko and Whitworth (1999) V. F. Petrenko and R. W. Whitworth, Physics of Ice (Oxford University Press, New York, 1999).
- Franks (2000) F. Franks, Water: A Matrix of Life (Royal Society of Chemistry, London, 2000), 2nd ed.
- Robinson et al. (1996) G. W. Robinson, S. B. Zhu, S. Singh, and M. W. Evans, Water in Biology, Chemistry and Physics (World Scientific, Singapore, 1996).
- Dunaeva et al. (2010) A. N. Dunaeva, D. V. Antsyshkin, and O. L. Kuskov, Solar System Research 44, 202 (2010).
- Sugimura et al. (2008) E. Sugimura, T. Iitaka, K. Hirose, K. Kawamura, N. Sata, and Y. Ohishi, Phys. Rev. B 77, 214103 (2008).
- Asahara et al. (2010) Y. Asahara, K. Hirose, Y. Ohishi, N. Hirao, and M. Murakami, Earth Planet. Sci. Lett. 299, 474 (2010).
- Bernal and Fowler (1933) J. D. Bernal and R. H. Fowler, J. Chem. Phys. 1, 515 (1933).
- Kuhs et al. (1984) W. F. Kuhs, J. L. Finney, C. Vettier, and D. V. Bliss, J. Chem. Phys. 81, 3612 (1984).
- Salzmann et al. (2011) C. G. Salzmann, P. G. Radaelli, B. Slater, and J. L. Finney, Phys. Chem. Chem. Phys. 13, 18468 (2011).
- Herrero and Ramírez (2013a) C. P. Herrero and R. Ramírez, Phys. Chem. Chem. Phys. 15, 16676 (2013a).
- Herrero (2014) C. P. Herrero, Chem. Phys. 439, 49 (2014).
- Hemley et al. (1987) R. J. Hemley, A. P. Jephcoat, H. K. Mao, C. S. Zha, L. W. Finger, and D. E. Cox, Nature 330, 737 (1987).
- Fei et al. (1993) Y. W. Fei, H. K. Mao, and R. J. Hemley, J. Chem. Phys. 99, 5369 (1993).
- Loubeyre et al. (1999) P. Loubeyre, R. LeToullec, E. Wolanin, M. Hanfland, and D. Husermann, Nature 397, 503 (1999).
- Frank et al. (2004) M. R. Frank, Y. W. Fei, and J. Z. Hu, Geochimica Cosmochimica Acta 68, 2781 (2004).
- Somayazulu et al. (2008) M. Somayazulu, J. Shu, C.-s. Zha, A. F. Goncharov, O. Tschauner, H.-k. Mao, and R. J. Hemley, J. Chem. Phys. 128, 064510 (2008).
- Sugimura et al. (2010) E. Sugimura, T. Komabayashi, K. Hirose, N. Sata, Y. Ohishi, and L. S. Dubrovinsky, Phys. Rev. B 82, 134103 (2010).
- Nelmes et al. (1998) R. J. Nelmes, J. S. Loveday, W. G. Marshall, G. Hamel, J. M. Besson, and S. Klotz, Phys. Rev. Lett. 81, 2719 (1998).
- Klotz et al. (1999) S. Klotz, J. M. Besson, G. Hamel, R. J. Nelmes, J. S. Loveday, and W. G. Marshall, Nature 398, 681 (1999).
- Klotz et al. (2009) S. Klotz, L. E. Bove, T. Straessle, T. C. Hansen, and A. M. Saitta, Nature Mater. 8, 405 (2009).
- Fortes et al. (2012) A. D. Fortes, I. G. Wood, M. G. Tucker, and W. G. Marshall, J. Appl. Cryst. (2012).
- Walrafen et al. (1982) G. E. Walrafen, M. Abebe, F. A. Mauer, S. Block, G. J. Piermarini, and R. Munro, J. Chem. Phys. 77, 2166 (1982).
- Klug and Whalley (1984) D. D. Klug and E. Whalley, J. Chem. Phys. 81, 1220 (1984).
- Song et al. (2003a) M. Song, H. Yamawaki, H. Fujihisa, M. Sakashita, and K. Aoki, Phys. Rev. B 68, 024108 (2003a).
- Song et al. (2003b) M. Song, H. Yamawaki, H. Fujihisa, M. Sakashita, and K. Aoki, Phys. Rev. B 68, 014106 (2003b).
- Liu et al. (2013) B. Liu, J. Yang, Q. Wang, Y. Han, Y. Ma, and C. Gao, Phys. Chem. Chem. Phys. 15, 14364 (2013).
- Holzapfel (1972) W. B. Holzapfel, J. Chem. Phys. 56, 712 (1972).
- Slovak and Tanaka (2005) J. Slovak and H. Tanaka, J. Chem. Phys. 122, 204512 (2005).
- Vega et al. (2005) C. Vega, C. McBride, E. Sanz, and J. L. F. Abascal, Phys. Chem. Chem. Phys. 7, 1450 (2005).
- Knight et al. (2006) C. Knight, S. J. Singer, J. L. Kuo, T. K. Hirsch, L. Ojamae, and M. L. Klein, Phys. Rev. E 73, 056113 (2006).
- Knight and Singer (2009) C. Knight and S. J. Singer, J. Phys. Chem. A 113, 12433 (2009).
- Umemoto et al. (2010) K. Umemoto, R. M. Wentzcovitch, S. de Gironcoli, and S. Baroni, Chem. Phys. Lett. 499, 236 (2010).
- Finkelstein and Moreh (2013) Y. Finkelstein and R. Moreh, J. Chem. Phys. 139, 044716 (2013).
- Kang et al. (2013) D. Kang, J. Dai, H. Sun, Y. Hou, and J. Yuan, Sci. Rep. 3, 3272 (2013).
- Bronstein et al. (2014) Y. Bronstein, P. Depondt, F. Finocchi, and A. M. Saitta, Phys. Rev. B 89 (2014).
- Hermann et al. (2012) A. Hermann, N. W. Ashcroft, and R. Hoffmann, Proc. Nat. Acad. Sci. USA 109, 745 (2012).
- Barker and Watts (1969) J. A. Barker and R. O. Watts, Chem. Phys. Lett. 3, 144 (1969).
- Rahman and Stillinger (1971) A. Rahman and F. H. Stillinger, J. Chem. Phys. 55, 3336 (1971).
- Mahoney and Jorgensen (2001) M. W. Mahoney and W. L. Jorgensen, J. Chem. Phys. 115, 10758 (2001).
- Koyama et al. (2004) Y. Koyama, H. Tanaka, G. Gao, and X. C. Zeng, J. Chem. Phys. 121, 7926 (2004).
- Jorgensen and Tirado-Rives (2005) W. L. Jorgensen and J. Tirado-Rives, PNAS 102, 6665 (2005).
- Abascal and Vega (2005) J. L. F. Abascal and C. Vega, J. Chem. Phys. 123, 234505 (2005).
- Paesani et al. (2006) F. Paesani, W. Zhang, D. A. Case, T. E. Cheatham, and G. A. Voth, J. Chem. Phys. 125, 184507 (2006).
- McBride et al. (2009) C. McBride, C. Vega, E. G. Noya, R. Ramírez, and L. M. Sesé, J. Chem. Phys. 131, 024506 (2009).
- Chen et al. (2003) B. Chen, I. Ivanov, M. L. Klein, and M. Parrinello, Phys. Rev. Lett. 91, 215503 (2003).
- Fernández-Serra and Artacho (2006) M. V. Fernández-Serra and E. Artacho, Phys. Rev. Lett. 96, 016404 (2006).
- Morrone and Car (2008) J. A. Morrone and R. Car, Phys. Rev. Lett. 101, 017801 (2008).
- Yoo et al. (2009) S. Yoo, X. C. Zeng, and S. S. Xantheas, J. Chem. Phys. 130, 221102 (2009).
- Lee and Tuckerman (2006) H.-S. Lee and M. E. Tuckerman, J. Chem. Phys. 125, 154507 (2006).
- Lee and Tuckerman (2007) H.-S. Lee and M. E. Tuckerman, J. Chem. Phys. 126, 164501 (2007).
- Wang et al. (2011) J. Wang, G. Roman-Perez, J. M. Soler, E. Artacho, and M. V. Fernandez-Serra, J. Chem. Phys. 134, 024516 (2011).
- Kolb and Thonhauser (2011) B. Kolb and T. Thonhauser, Phys. Rev. B 84, 045116 (2011).
- Akin-Ojo and Wang (2011) O. Akin-Ojo and F. Wang, Chem. Phys. Lett. 513, 59 (2011).
- Gillan (1988) M. J. Gillan, Phil. Mag. A 58, 257 (1988).
- Ceperley (1995) D. M. Ceperley, Rev. Mod. Phys. 67, 279 (1995).
- Marx and Parrinello (1996) D. Marx and M. Parrinello, J. Chem. Phys. 104, 4077 (1996).
- Tuckerman et al. (1996) M. E. Tuckerman, D. Marx, M. L. Klein, and M. Parrinello, J. Chem. Phys. 104, 5579 (1996).
- Benoit et al. (1998) M. Benoit, D. Marx, and M. Parrinello, Nature 392, 258 (1998).
- Benoit et al. (2002) M. Benoit, A. H. Romero, and D. Marx, Phys. Rev. Lett. 89, 145501 (2002).
- Morrone et al. (2009) J. A. Morrone, L. Lin, and R. Car, J. Chem. Phys. 130, 204511 (2009).
- Ramírez and Herrero (2010) R. Ramírez and C. P. Herrero, J. Chem. Phys. 133, 144511 (2010).
- Habershon et al. (2009) S. Habershon, T. E. Markland, and D. E. Manolopoulos, J. Chem. Phys. 131, 024501 (2009).
- Herrero and Ramírez (2011a) C. P. Herrero and R. Ramírez, J. Chem. Phys. 134, 094510 (2011a).
- Herrero and Ramírez (2011b) C. P. Herrero and R. Ramírez, Phys. Rev. B 84, 224112 (2011b).
- Herrero and Ramírez (2012) C. P. Herrero and R. Ramírez, J. Chem. Phys. 137, 104505 (2012).
- Ramírez et al. (2013) R. Ramírez, N. Neuerburg, and C. P. Herrero, J. Chem. Phys. 139, 084503 (2013).
- Ramírez and Herrero (2011) R. Ramírez and C. P. Herrero, Phys. Rev. B 84, 064130 (2011).
- Ramírez et al. (2012a) R. Ramírez, N. Neuerburg, M. V. Fernández-Serra, and C. P. Herrero, J. Chem. Phys. 137, 044502 (2012a).
- Feynman (1972) R. P. Feynman, Statistical Mechanics (Addison-Wesley, New York, 1972).
- Kleinert (1990) H. Kleinert, Path Integrals in Quantum Mechanics, Statistics and Polymer Physics (World Scientific, Singapore, 1990).
- Herrero and Ramírez (2014a) C. P. Herrero and R. Ramírez, J. Phys.: Condens. Matter 26, 233201 (2014a).
- Buch et al. (1998) V. Buch, P. Sandler, and J. Sadlej, J. Phys. Chem. B 102, 8641 (1998).
- Gonzalez et al. (2010) B. S. Gonzalez, E. G. Noya, C. Vega, and L. M. Sese, J. Phys. Chem. B 114, 2484 (2010).
- Hernández de la Peña et al. (2005) L. Hernández de la Peña, M. S. Gulam Razul, and P. G. Kusalik, J. Chem. Phys. 123, 144506 (2005).
- Miller and Manolopoulos (2005) T. F. Miller and D. E. Manolopoulos, J. Chem. Phys. 123, 154504 (2005).
- Hernández de la Peña and Kusalik (2006) L. Hernández de la Peña and P. G. Kusalik, J. Chem. Phys. 125, 054512 (2006).
- Nygård et al. (2006) K. Nygård, M. Hakala, S. Manninen, A. Andrejczuk, M. Itou, Y. Sakurai, L. G. M. Pettersson, and K. Hämäläinen, Phys. Rev. E 74, 031503 (2006).
- Habershon and Manolopoulos (2011) S. Habershon and D. E. Manolopoulos, Phys. Chem. Chem. Phys. 13, 19714 (2011).
- Ramírez et al. (2012b) R. Ramírez, N. Neuerburg, and C. P. Herrero, J. Chem. Phys. 137, 134503 (2012b).
- Martyna et al. (1996) G. J. Martyna, M. E. Tuckerman, D. J. Tobias, and M. L. Klein, Mol. Phys. 87, 1117 (1996).
- Tuckerman and Hughes (1998) M. E. Tuckerman and A. Hughes, in Classical and Quantum Dynamics in Condensed Phase Simulations, edited by B. J. Berne, G. Ciccotti, and D. F. Coker (Word Scientific, Singapore, 1998), p. 311.
- Martyna et al. (1999) G. J. Martyna, A. Hughes, and M. E. Tuckerman, J. Chem. Phys. 110, 3275 (1999).
- Tuckerman (2002) M. E. Tuckerman, in Quantum Simulations of Complex Many–Body Systems: From Theory to Algorithms, edited by J. Grotendorst, D. Marx, and A. Muramatsu (NIC, FZ Jülich, 2002), p. 269.
- Gillan (1990) M. J. Gillan, in Computer Modelling of Fluids, Polymers and Solids, edited by C. R. A. Catlow, S. C. Parker, and M. P. Allen (Kluwer, Dordrecht, 1990), p. 155.
- Pauling (1935) L. Pauling, J. Am. Chem. Soc. 57, 2680 (1935).
- Herrero and Ramírez (2013b) C. P. Herrero and R. Ramírez, Chem. Phys. Lett. 568-569, 70 (2013b).
- Herrero and Ramírez (2014b) C. P. Herrero and R. Ramírez, J. Chem. Phys. 140, 234502 (2014b).
- Röttger et al. (1994) K. Röttger, A. Endriss, J. Ihringer, S. Doyle, and W. F. Kuhs, Acta Cryst. B 50, 644 (1994).
- Yoshimura et al. (2006) Y. Yoshimura, H. K. Mao, and R. J. Hemley, Chem. Phys. Lett. 420, 503 (2006).
- Takii et al. (2008) Y. Takii, K. Koga, and H. Tanaka, J. Chem. Phys. 128, 204501 (2008).
- Himoto et al. (2011) K. Himoto, M. Matsumoto, and H. Tanaka, Phys. Chem. Chem. Phys. 13, 19876 (2011).
- Aragones et al. (2009) J. L. Aragones, M. M. Conde, E. G. Noya, and C. Vega, Phys. Chem. Chem. Phys. 11, 543 (2009).
- Aragones and Vega (2009) J. L. Aragones and C. Vega, J. Chem. Phys. 130, 244504 (2009).
- Mishima et al. (1984) O. Mishima, L. D. Calvert, and E. Whalley, Nature 310, 393 (1984).
- Ashcroft and Mermin (1976) N. W. Ashcroft and N. D. Mermin, Solid State Physics (Saunders College, Philadelphia, 1976).
- Pollock et al. (1972) E. L. Pollock, T. A. Bruce, G. V. Chester, and J. A. Krumhansl, Phys. Rev. B 5, 4180 (1972).
- Herrero and Ramírez (2005) C. P. Herrero and R. Ramírez, Phys. Rev. B 71, 174111 (2005).
- Etters and Danilowicz (1974) R. Etters and R. L. Danilowicz, Phys. Rev. A 9, 1698 (1974).
- Landau and Lifshitz (1980) L. D. Landau and E. M. Lifshitz, Statistical Physics (Pergamon, Oxford, 1980), 3rd ed.
- Herrero (2008) C. P. Herrero, J. Phys.: Condens. Matter 20, 295230 (2008).
- Herrero and Ramírez (2000) C. P. Herrero and R. Ramírez, Phys. Rev. B 63, 024103 (2000).
- Nelmes et al. (1993) R. J. Nelmes, J. S. Loveday, R. M. Wilson, J. M. Besson, P. Pruzan, S. Klotz, G. Hamel, and S. Hull, Phys. Rev. Lett. 71, 1192 (1993).
- Besson et al. (1994) J. M. Besson, P. Pruzan, S. Klotz, G. Hamel, B. Silvi, R. J. Nelmes, J. S. Loveday, R. M. Wilson, and S. Hull, Phys. Rev. B 49, 12540 (1994).
- Herman et al. (1982) M. F. Herman, E. J. Bruskin, and B. J. Berne, J. Chem. Phys. 76, 5150 (1982).
- Lin et al. (2010) L. Lin, J. A. Morrone, R. Car, and M. Parrinello, Phys. Rev. Lett. 105, 110602 (2010).
- Pamuk et al. (2012) B. Pamuk, J. M. Soler, R. Ramírez, C. P. Herrero, P. W. Stephens, P. B. Allen, and M. V. Fernández-Serra, Phys. Rev. Lett. 108, 193003 (2012).
- Wolanin et al. (1997) E. Wolanin, P. Pruzan, J. C. Chervin, B. Canny, M. Gauthier, D. Hausermann, and M. Hanfland, Phys. Rev. B 56, 5781 (1997).