Heralded Source of Bright Multi-mode Mesoscopic Sub-Poissonian Light
Abstract
In a direct detection scheme we observed 7.8 dB of twin-beam squeezing for multi-mode two-color squeezed vacuum generated via parametric down conversion. Applying post-selection, we conditionally prepared a sub-Poissonian state of light containing photons per pulse on the average with the Fano factor . The scheme can be considered as the heralded preparation of pulses with the mean energy varying between tens and hundreds of fJ and the uncertainty considerably below the shot-noise level. Such pulses can be used in metrology (for instance, for radiometers calibration) as well as for probing multi-mode nonlinear optical effects.
Quantum optics provides the recipes to overcome the noise limit set by the corpuscular nature of light, also known as a shot noise level (SNL). At the SNL, completely uncorrelated particles follow a Poissonian distribution in their numbers. Light with noise properties suppressed below the SNL (squeezed light) plays an essential role in quantum metrology Bri06 , quantum imaging Bri10 ; Mar16 , quantum communication Nie00 ; Mad12 , and can be helpful in bio-sensing Tay13 . Significant interest in the multi-mode squeezed light stems from the possibility to improve the spatial resolution of optical images KolobovPRL00 ; Kolobov99 . While single-mode sub-Poissionian light was successfully generated in a wealth of experiments using displaced squeezed vacuum states by means of feedforward Mer90 and postelection Fabre ; Zou06 techniques, constant-current-driven semiconductor diodes Tap87 ; Mac88 , conditional preparation of bright multi-mode light with suppressed noise properties has never been demonstrated. The reasons are twofold: (i) the mode mismatch Ivan ; Isk14 ; Fin15 in the detection, which always reduces the measured nonclassical correlation between the multi-mode mesoscopic twin-beams used for the heralded sub-Poissonian light preparation, and (ii) low quantum efficiency and high dark noise of the heralding detectors. While the second problem regards to the quality of equipment, the solution to the first problem is to work with the low-photon number states, for which the excess thermal fluctuations of the unmatched modes are negligible. Therefore, to date, the prepared multi-mode sub-Poissonian light contained at maximum only 12 photons per pulse Bondani ; Perina13 . Because of the low efficiency of the detectors, the achieved suppression of the photon-number noise was only below the SNL. It is a very attractive goal to generate multi-mode mesoscopic nonclassical light that can be used to reduce photon-number noise in the applications (for example, in radiometry or quantum imaging) or to probe nonclassical effects in matter by seeding them with bright nonclassical states.
In this work, we address both issues listed above. We generate highly multi-mode twin beams containing up to 1.4 photons per mode and photons per pulse on the average and detect them separately by two high-efficiency low-noise photodetectors. We observed, to the best of our knowledge, the strongest nonclassical correlations between multi-mode signal and idler squeezed vacuum beams. Using the method developed in Ref. Fabre , we conditionally prepare bright multi-mode sub-Poissonian light with the noise suppressed below the SNL. Since the pulse contains at least photons, it is the strongest source of multi-mode sub-Poissonian nonclassical light. Differently to the sub-Poissonian light prepared by displacing the squeezed state, our method does not require the phase stability of the coherent displacement.
The setup is shown in Fig.1 (a). The optical parametric amplifier OPA based on a single type-I 3-mm thick BBO crystal was pumped by a third harmonic of a Nd:YAG laser at the wavelength 355 nm with the pulse duration 18 ps and the repetition rate 1 kHz. The pump power was changed in the range from 36 mW to 126.3 mW by means of a half-wave plate () placed in front of a polarization cube (). The diameter of the pump beam (FWHM) at the position of the crystal was 1.5 mm. Signal and idler beams were generated at 635 nm and 805 nm, respectively. Right after the crystal the pump beam was cut off by two dichroic mirrors (DM) with high reflection at 355 nm and high transmission at 635 nm and 805 nm and a colored glass filter OG-630 (OG). The two-color parametric beams were separated by a dichroic beamsplitter (DBS). The apertures A1 and A2 of diameters 7 mm and 8.91 mm, respectively, were inserted into the signal and idler beams in the focal plane of a lens (L) with the focal distance 200 mm. The detected maximal angles satisfied the condition for the conjugate mode detection Ivan . After the apertures, all the radiation was focused by two collecting lenses onto detectors (). The propagation losses from the crystal to the detectors were measured separately and amounted to 7%. According to the datasheet Hamamatsu , the quantum efficiency (QE) of the PIN diode S3072 at 635 nm is 82% and QE of the PIN diode S3883 at 805 nm is 89%. However, we expect the efficiency to be higher, because the protection glass windows in front of the diodes were removed. The signals from the diodes were amplified and shaped by low-noise charge sensitive preamplifiers (A250) and shaping amplifiers (A275) by Amptek. Pulses from the detectors were integrated by 12-Bit, 8-channel digitizer NI
PXI-5105 by National Instruments with the sample rate of 60 MS/s (AD). The data was stored in a computer for further processing.
The number of photons per mode was estimated from the nonlinear dependence of the PDC signal on the pump power Iva06 . In the experiment the mean number of photons per mode of the parametric radiation was in the range from 0.3 to 1.4. For each mean value of the pump power, the data of signal and idler pulses were measured and stored in the computer.

To demonstrate the nonclassical photon-number correlations between the signal and idler beams using the data collected in the measurement we use the noise reduction factor (NRF), which is given by the formula
| (1) |
where is the number of detected photons integrated per pulse in the detector and is a numerical coefficient to compensate for the unbalancing of the detection gains (including detection efficiencies). We equalize the gains of the detectors to compensate for the excess noise caused by the thermal statistics of the detected beams Brid10 . The value in the denominator is the shot-noise calibration for the given values and measured with the coherent light. If the photon-number correlation is nonclassical, i.e. it cannot be obtained by a mixture of classical coherent states. Taking into account the electronic noise of the detectors the formula reads:
| (2) |
where is the electronic and dark noise of detector . It should be noted that this equation can only be applied when the electronic noise of the detectors is smaller than the shot-noise level Aga10 . This was the case in our experiment.

As a first result, we plot NRF calculated according to Eq. 2 against the number of photons per mode in Figure. 2. As expected, we observed a linear dependence Isk14 . The data were fitted by a linear function according to the formula
| (3) |
where the fitting parameters and . Both parameters depend on the quantum efficiency of the first detector , ratio of quantum efficiencies of the detectors , the number of matched modes and unmatched ones as and . Assuming that and the ratio of quantum efficiencies equals the ratio of the readings of the signal and idler detectors, which can be obtained from the measured data, we obtain . As one can see from Figure 2, we observed a reduction of the noise of the photon number difference down to of the SNL for the state containing and . This amounts to 7.8 dB, the largest degree of twin-beam squeezing ever demonstrated for multi-mode squeezed vacuum states of light.
Conditional preparation of the sub-Poissonian light is realized using the same data set. The procedure of the data processing is based on post-selection. As shown in Fig.1 (b), for further analysis of detector data, we use only those pulses for which the output of detector takes values within the range of around the chosen level. Here, is the standard deviation of the signal and is a constant defining the conditioning strength. The higher Q the stronger the condition.
To quantify the noise of the conditionally prepared light we calculate the Fano factor . Following Ref. Fabre04 , in our case, theoretical calculation of for the conditionally prepared state in Channel 1 is given by
| (4) |
where are the Fano factors for the unconditional beams 1,2. Following this, we expect the noise in the prepared beam to be almost twice as large as the noise of the photon number difference.
Taking into account the electronic noise of the detector 1(2), the Fano factor reads
| (5) |
Contrary to the NRF calculation (2), in the Fano factor for the heralded sub-Poissonian light in channel 1, only the noise of detector can be eliminated, but the electronic noise of the control detector (D2) is always present.
We next demonstrate the conditional preparation of the sub-Poissonian light. In Fig. 2, the Fano factor for conditionally prepared states () in the target channel (vinous circles) as a function of is depicted. The points were calculated according to Eq. (5). The deviation of the experimental results from the theoretical predictions according to Eq.(4) (orange squares) is due to the electronic noise contribution of the control detector (D2). For the brightest state containing photons per pulse the Fano factor is found to be , which is slightly larger than predicted by Eq. (4) using , , and .
Apart from the electronic noise of the detectors, the signal and the idler channels are influenced by optical losses, finite quantum efficiency, and unmatched modes. Therefore, the selected interval in the control channel should have a finite width. For the brightest conditionally prepared state containing photons per pulse, we plot as a function of in Fig. 3(a)). The conditioning was applied around the mean signal in . As expected, the stronger the condition the lower the value of . According to the presented data, the Fano factor reaches the minimum value of at and remains constant for . In general, the stronger the condition the lower the success rate of the state preparation. For example, applying the condition of widths , and we prepare sub-Poissonian light with the Fano factor of , and with the success rate of , and , respectively. The inset presents the probability distributions of the unconditional state (dark grey), the conditionally prepared sub-Poissonian state with (vinous), and the shot noise limited state (light grey).
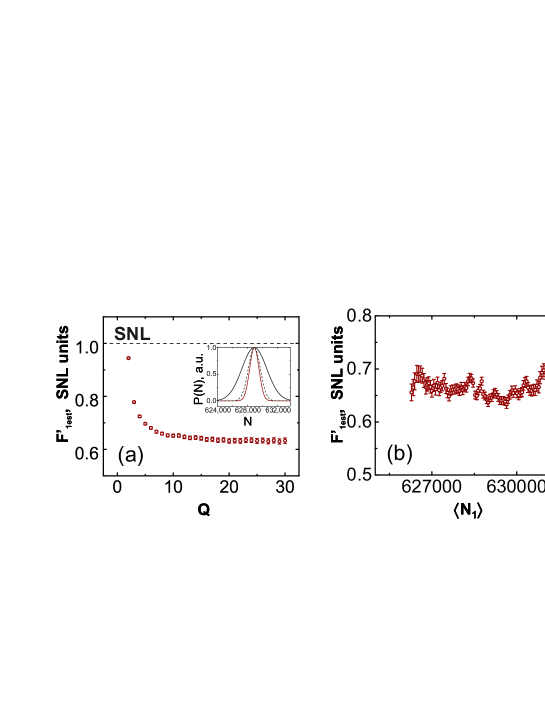
To demonstrate the stability of the method, for the target beam we plot as a function of the mean number of photons per pulse (Fig. 3(b)). Each point of the plot was obtained from the same data set, measured at the pump power of 126.3 mW. The selection interval of bandwidth () was shifted around the mean signal in the control channel. One can see that the mean number of photons in the prepared state increases by photons while the Fano factor remains almost unchanged within the error range.
In conclusion, we have measured a record value of 7.8 dB twin-beam squeezing for multi-mode two-color squeezed vacuum beams. Sub-Poissonian light containing up to photons per pulse and up to photons per mode with the Fano factor has been prepared in the target (signal) beam through the heralding of the control (idler) beam. The obtained pulses of light have the average number of photons from to , corresponding to energies from to pJ, and the energy variance 37% below the shot-noise level. This makes our technique interesting for radiometry, especially taking into account the possibility to move the idler beam wavelength to the infrared range. Besides, due to the relatively high photon number per mode, the obtained sub-Poissonian beam can be used now to probe the basic quantum interactions in nonlinear optics Dem08 or quantum optomechanics Van13 by mesoscopic nonclassical states of light.
We acknowledge the financial support of the EU FP7 under grant agreement No. 308803 (project BRISQ2). T.Sh.I. acknowledges the support of an H.C. Ørsted Postdoc programme, co-funded by Marie Curie Actions. R.F. acknowledges project GB14-36681G of Czech Science Foundation. V.C.U. acknowledges project 13-27533J of Czech Science Foundation.
References
- (1) G. Brida, M. Chekhova, M. Genovese, and I. Ruo-Berchera, Opt. Express 16, 12550–12558 (2008).
- (2) G. Brida, M. Genovese, I. Ruo Berchera, Nature Photonics 4, 227 – 230 (2010).
- (3) M. Genovese, arXiv:1601.06066v1 (2016).
- (4) M. Nielsen, I. Chuang, Cambridge Univ. Press, (2000).
- (5) L. S. Madsen, V C. Usenko, M. Lassen, R. Filip, U. L. Andersen, Nature Communications 3, 1083 (2012).
- (6) M. A. Taylor, J. Janousek, V. Daria, J. Knittel, B. Hage, H. -A. Bachor, W. P. Bowen, Nature Photonics 7, 229–233 (2013).
- (7) M. I. Kolobov, Reviews of Modern Physics, 71, 1539 (1999).
- (8) M. I. Kolobov and C. Fabre, Phys. Rev. Lett. 85, 3789 (2000).
- (9) J. Mertz, A. Heidmann, C. Fabre, E. Giacobino, and S. Reynaud, Phys. Rev. Lett. 64, 2897–2900 (1990).
- (10) J. Laurat, T. Coudreau, N. Treps, A. Maître, C. Fabre, Phys. Rev. Lett. 91, 213601 (2003).
- (11) H. Zou, S. Zhai, J. Guo, R. Yang, and J. Gao, Opt. Lett. 31, 1735 (2006) and the refencies within it.
- (12) P. R. Tapster, J. G. Rarity and J. S. Satchel,Europhys. Lett. 4, 293–299 (1987).
- (13) S. Machida, Y. Yamamoto, Phys. Rev. Lett. 60, 792–794 (1988).
- (14) I. N. Agafonov, M. V. Chekhova, and G. Leuchs, Phys. Rev. A 82, 011801(R) (2010).
- (15) M. A. Finger, T. Sh. Iskhakov, N. Y. Joly, M. V. Chekhova, and P. St. J. Russell, Phys. Rev. Lett. 115, 143602 (2015).
- (16) T. Sh. Iskhakov, V. C. Usenko, R. Filip, M. V. Chekhova, G. Leuchs, Phys. Rev. A 93, 043849 (2016).
- (17) J. Peřina Jr., O. Haderka, and V. Michálek, Opt. Exp. 21, 19387 (2013).
- (18) M. Lamperti, A. Allevi, M. Bondani, R. Machulka, V. Michlek, O. Haderka, and J. Perjina, Jr., J. Opt. Soc. Am. B 31, 20 (2014).
- (19) Selection guide by Hamamatsu http://www.hamamatsu.com/resources/pdf/ssd/si_pd_kspd0001e.pdf
- (20) O. A. Ivanova, T. Sh. Iskhakov, A. N. Penin, M. V. Chekhova, Quantum Electronics 36, 951–956 (2006).
- (21) G. Brida, I. P. Degiovanni, M. Genovese, M. L. Rastello, and I. Ruo-Berchera, Opt. Express 18, 20572 (2010).
- (22) I. Agafonov, M. Chekhova, T. Iskhakov, G. Leuchs, Quantum Cryptography and Computing 161-170 (2010).
- (23) J. Laurat, T. Coudreau, N. Treps, A. Maître, C. Fabre, Phys. Rev. A 69, 033808 (2004).
- (24) F. De Martini, F. Sciarrino, C. Vitelli, Phys. Rev. Lett. 100, 253601 (2008).
- (25) M. R. Vanner, J. Hofer, G. D. Cole, M. Aspelmeyer, Nature Communications 4, 2295 (2013).