Characterization of DNA methylation as a function of biological complexity via dinucleotide inter-distances
Abstract
We perform a statistical study of the distances between successive occurrencies of a given dinucleotide in the DNA sequence for a number of organisms of different complexity. Our analysis highlights peculiar features of the dinucleotide CG distribution in mammalian DNA, pointing towards a connection with the role of such dinucleotide in DNA methylation. While the CG distributions of mammals exhibit exponential tails with comparable parameters, the picture for the other organisms studied (e.g., fish, insects, bacteria and viruses) is more heterogeneous, possibly because in these organisms DNA methylation has different functional roles. Our analysis suggests that the distribution of the distances between dinucleotides CG provides useful insights in characterizing and classifying organisms in terms of methylation functionalities.
1 Introduction
The statistical analysis of DNA coding and non-coding sequences has revealed structures and correlations that go beyond the extent of short-range models, for example uncovering scale-invariant properties of the sequence as a whole. Results in this direction date back to the early 80’s [42, 35, 43, 29, 34, 10, 5, 3, 44]. Despite these early observations, the functional role and nature (if any) of such long-range correlations are still to be clarified [28, 23, 7, 9, 6]. Other statistical measures on genetic sequences have also been investigated, like entropies [30, 40, 20] or return time statistics for specific oligonucleotides [8, 1]. In particular, the first-return-time distribution proved to be a powerful tool to investigate the statistical properties of symbolic sequences in general. The idea dates back to the pioneering work of Poincaré [37], on the trajectories of bounded dynamical systems. Thereafter, much effort has been devoted to the analysis of symbolic trajectories in very different contexts: stochastic processes [16], biological data [36] and literary texts [4], to mention just a few. These tools have been applied to genomics in different forms for about the last 10 years [39, 33], becoming nowadays rather common, e.g. for the reconstruction of the phylogenetic tree [1, 8], for the detection of CpG islands [2] and for the characterization of long-range correlations in DNA [18].
While the identification and quantification of the statistical features of a genetic sequence can be instrumental in understanding certain properties of its primary structure, a more biologically motivated study can bring new insight on these patterns. The statistical analysis of DNA sequences can reveal functional and structural properties of biological relevance, and also, in principle, universal features that go beyond the single organism, which can help characterize and classify different levels of organism complexity. It can also help comprehend complex mechanisms such as chromatin structure [12, 21] and epigenetic regulation [26, 11]. Moreover, it is nowadays recognized that in complex organisms the non-coding regions of DNA, the once-called "junk DNA", are continuously annotated with novel regulatory functions [17, 22]. A deeper knowledge of the characteristics of DNA structure (not only the coding part) could help understand the effects of some pathologies that involve mutated genes with a structural rather that a functional role, as in the case of laminopathies [14, 31, 24].
2 Methods
In this study we employ a distance-based approach to characterize the distribution of dinucleotides inside human and other genomes. In particular, for a given sequence and a given dinucleotide, we compute the distance (counted in number of bases) between two consecutive occurrences of that dinucleotide.
More precisely, consider a sequence where take value in the alphabet . For a given dinucleotide with , construct the sequence of indexes where XY occurs: . The sequence of inter-distances is then computed from the difference of successive indexes . This corresponds to the choice of an overlapping-window frame111For dinucleotides of the type (), we removed overlapping occurrences, namely, the case of the subsequence is considered as two dinucleotides with a distance of two, and all distances are subtracted by one at the end of the process in order to obtain a minimum distance of 1. . Here we focus on the relative frequencies of such distances, that is:
| (1) |
For all the considered organisms, the different sequences of inter-dinucleotide distances , for each of the 16 dinucleotides, were computed from the whole genome sequence obtained by concatenating all chromosomes222The sex chromosomes have been excluded from the analysis.. Note that, since we focus on the probability distribution only, the precise order of the concatenation has a negligible effect on the results. Finally, unknown nucleotides (corresponding to the symbol on the DNA sequence) were removed from the sequences to be analyzed.
Logarithmic and double-logarithmic plots of the distributions were used to visually inspect the exponential or power-law behavior of their tails. Moreover, a quantitative estimation of the differences between dinucleotide distributions was obtained using the Jensen-Shannon distance , a symmetrized version of the Kullback-Leibler divergence [13]. This analysis was performed between dinucleotide distributions for the same organism, and between the distributions of the dinucleotide CG for all the studied organisms.
Given two probability distributions and , , () we have:
| (2) | |||
| (3) | |||
| (4) |
21 organisms have been analyzed for this study: Homo sapiens, primates (Macaca mulata, Pan troglodytes), mammals (Bos taurus, Canis familiaris, Equus caballus, Monodelphis domesticus, Mus musculus, Rattus norvegicus, Ornithorynchus anatinus), fish (Danio rerio, Tetraodon nigroviridis), insects (Apis mellifera, Drosophila melanogaster, Tribolium castaneum), sea organisms (Ciona intestinalis, Oikopleura diotica), Caenorhabditis elegans, unicellular organisms (Escherichia Coli, Saccharomyces cerevisiae), and a virus (human Adenovirus). Most of the chosen organisms were described in two papers [41, 25]. The details on the organisms, and the link to the DNA sequence available online, are shown in Supplementary Table 1.
Custom code was written (Python and Matlab software) to implement data import, processing and analysis.
3 Results
CG inter-distance distribution in human DNA
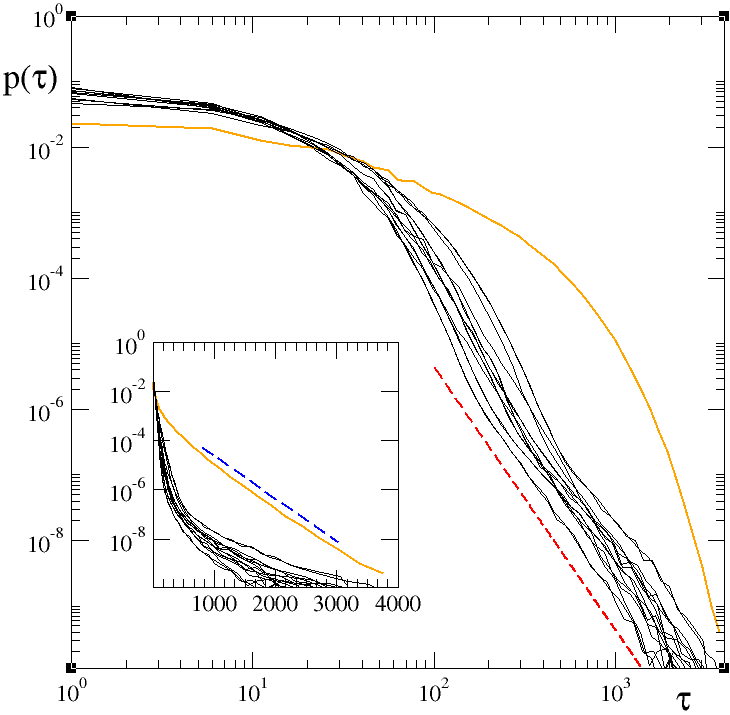
The characterization of dinucleotide inter-distance distributions in human DNA reveals a striking difference of the the dinucleotide CG and all the other couples, as shown in Fig. 1, 2, and in Supplementary Figure 1. The double logarithmic plot shows the presence of “heavy” tails in the distributions of all the remaining dinucleotides, with an algebraic decay , with a similar exponent close to (average exponent ) (regression correlation coefficient for all distributions, except for CG, see Supplementary Table 2 also for a Chi-square test comparison).
In contrast, as shown in the inset of Fig. 1, the tail of the CG inter-distance distribution is asymptotically exponentially decaying: with parameter , ( , , see Table 1).
In order to find a biological meaning for such striking differences, we remark that an exponential distribution is associated with a “characteristic length ” between consecutive appearances of the same dinucleotide, given by the inverse of the exponential rate , with a value of bases for human DNA. CG dinucleotides thus perform a sort of “Bernoulli walk” along the whole DNA sequence, at difference with the other dinucleotides for which a power-law tail implies a scale-invariant distribution. This result can be associated with the different role that CG dinucleotides have in human DNA, since they are the sites in which a methyl group can be attached by the specific enzyme family of DNA Methyltransferases [25].
Regarding our analyses, we remark that, since the coding regions of human DNA constitute only a small part of the overall sequence (about ), our statistics are mainly affected by the features of the non-coding regions, believed to have functional roles for the three-dimensional structure of the chromatin [11] and for the regulation of transposable elements [27]. Moreover, if we consider a known structure for the dinuclotides CG in human DNA, the so-called “CpG islands” [19, 45] (that seem to have a role in regulating the expression of the contiguous genes [38, 26]), it is known that CG’s are at close distance between each other (inside an island). Since we are studying the long-range interval of the inter-distance distributions (the right tail of the distributions) we can assert that our analyses are not affected by these entities in the interval considered for fitting.
Comparison with other organisms
After performing our analyses on the human DNA, we have considered the DNA sequence of other organisms for comparison. In this way we aim to find relations between the features of the CG distributions and the biological information actually available on DNA methylation mechanisms, for a large class of organisms (as described in [25] and references therein). We remark that many results on DNA methylation in living organisms are still unknown, or at least still object of debate.
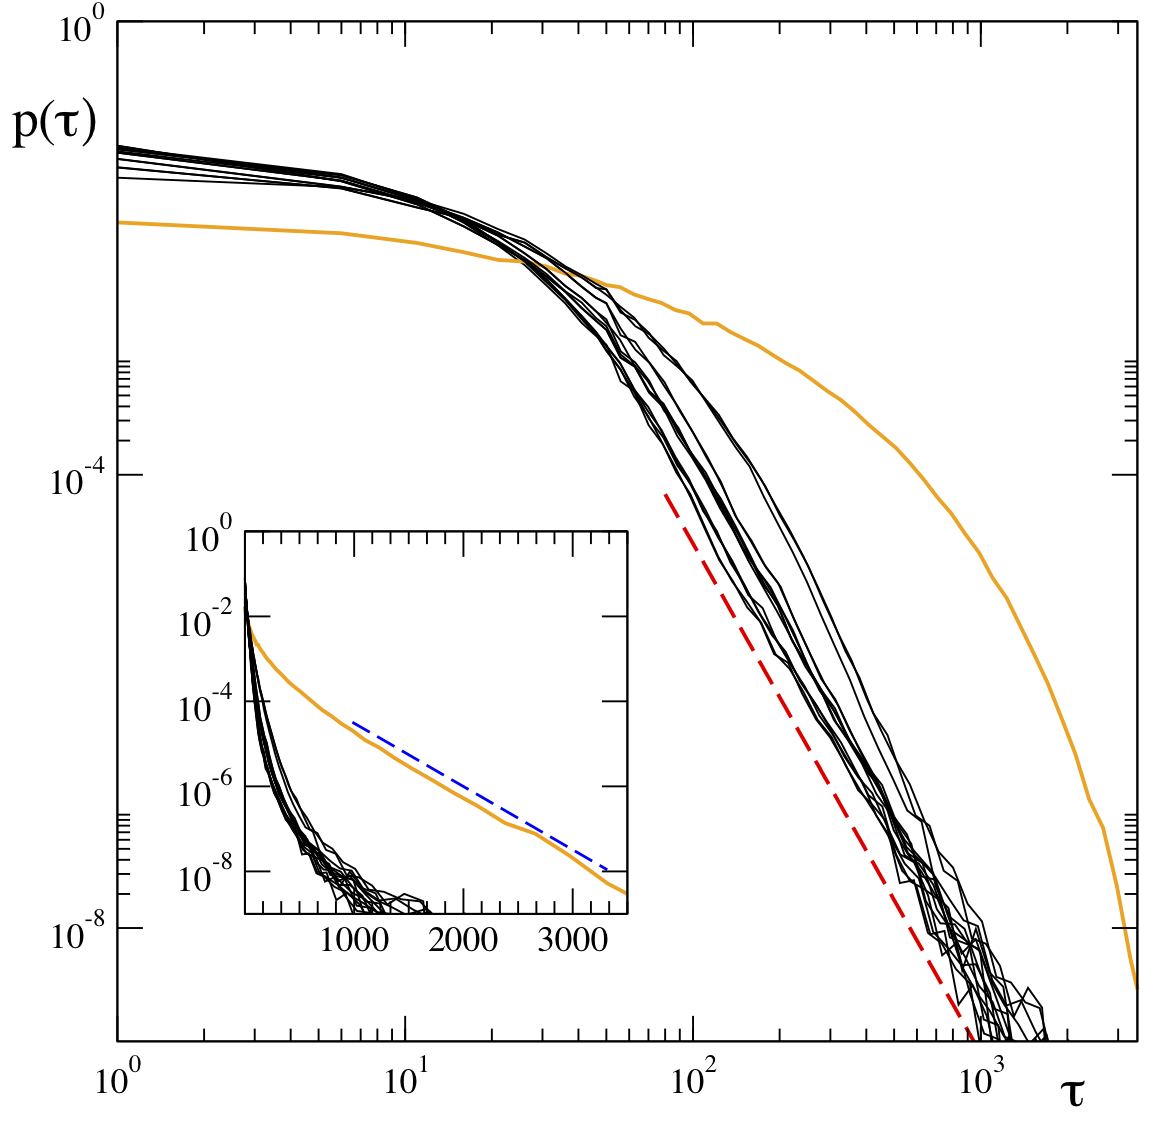
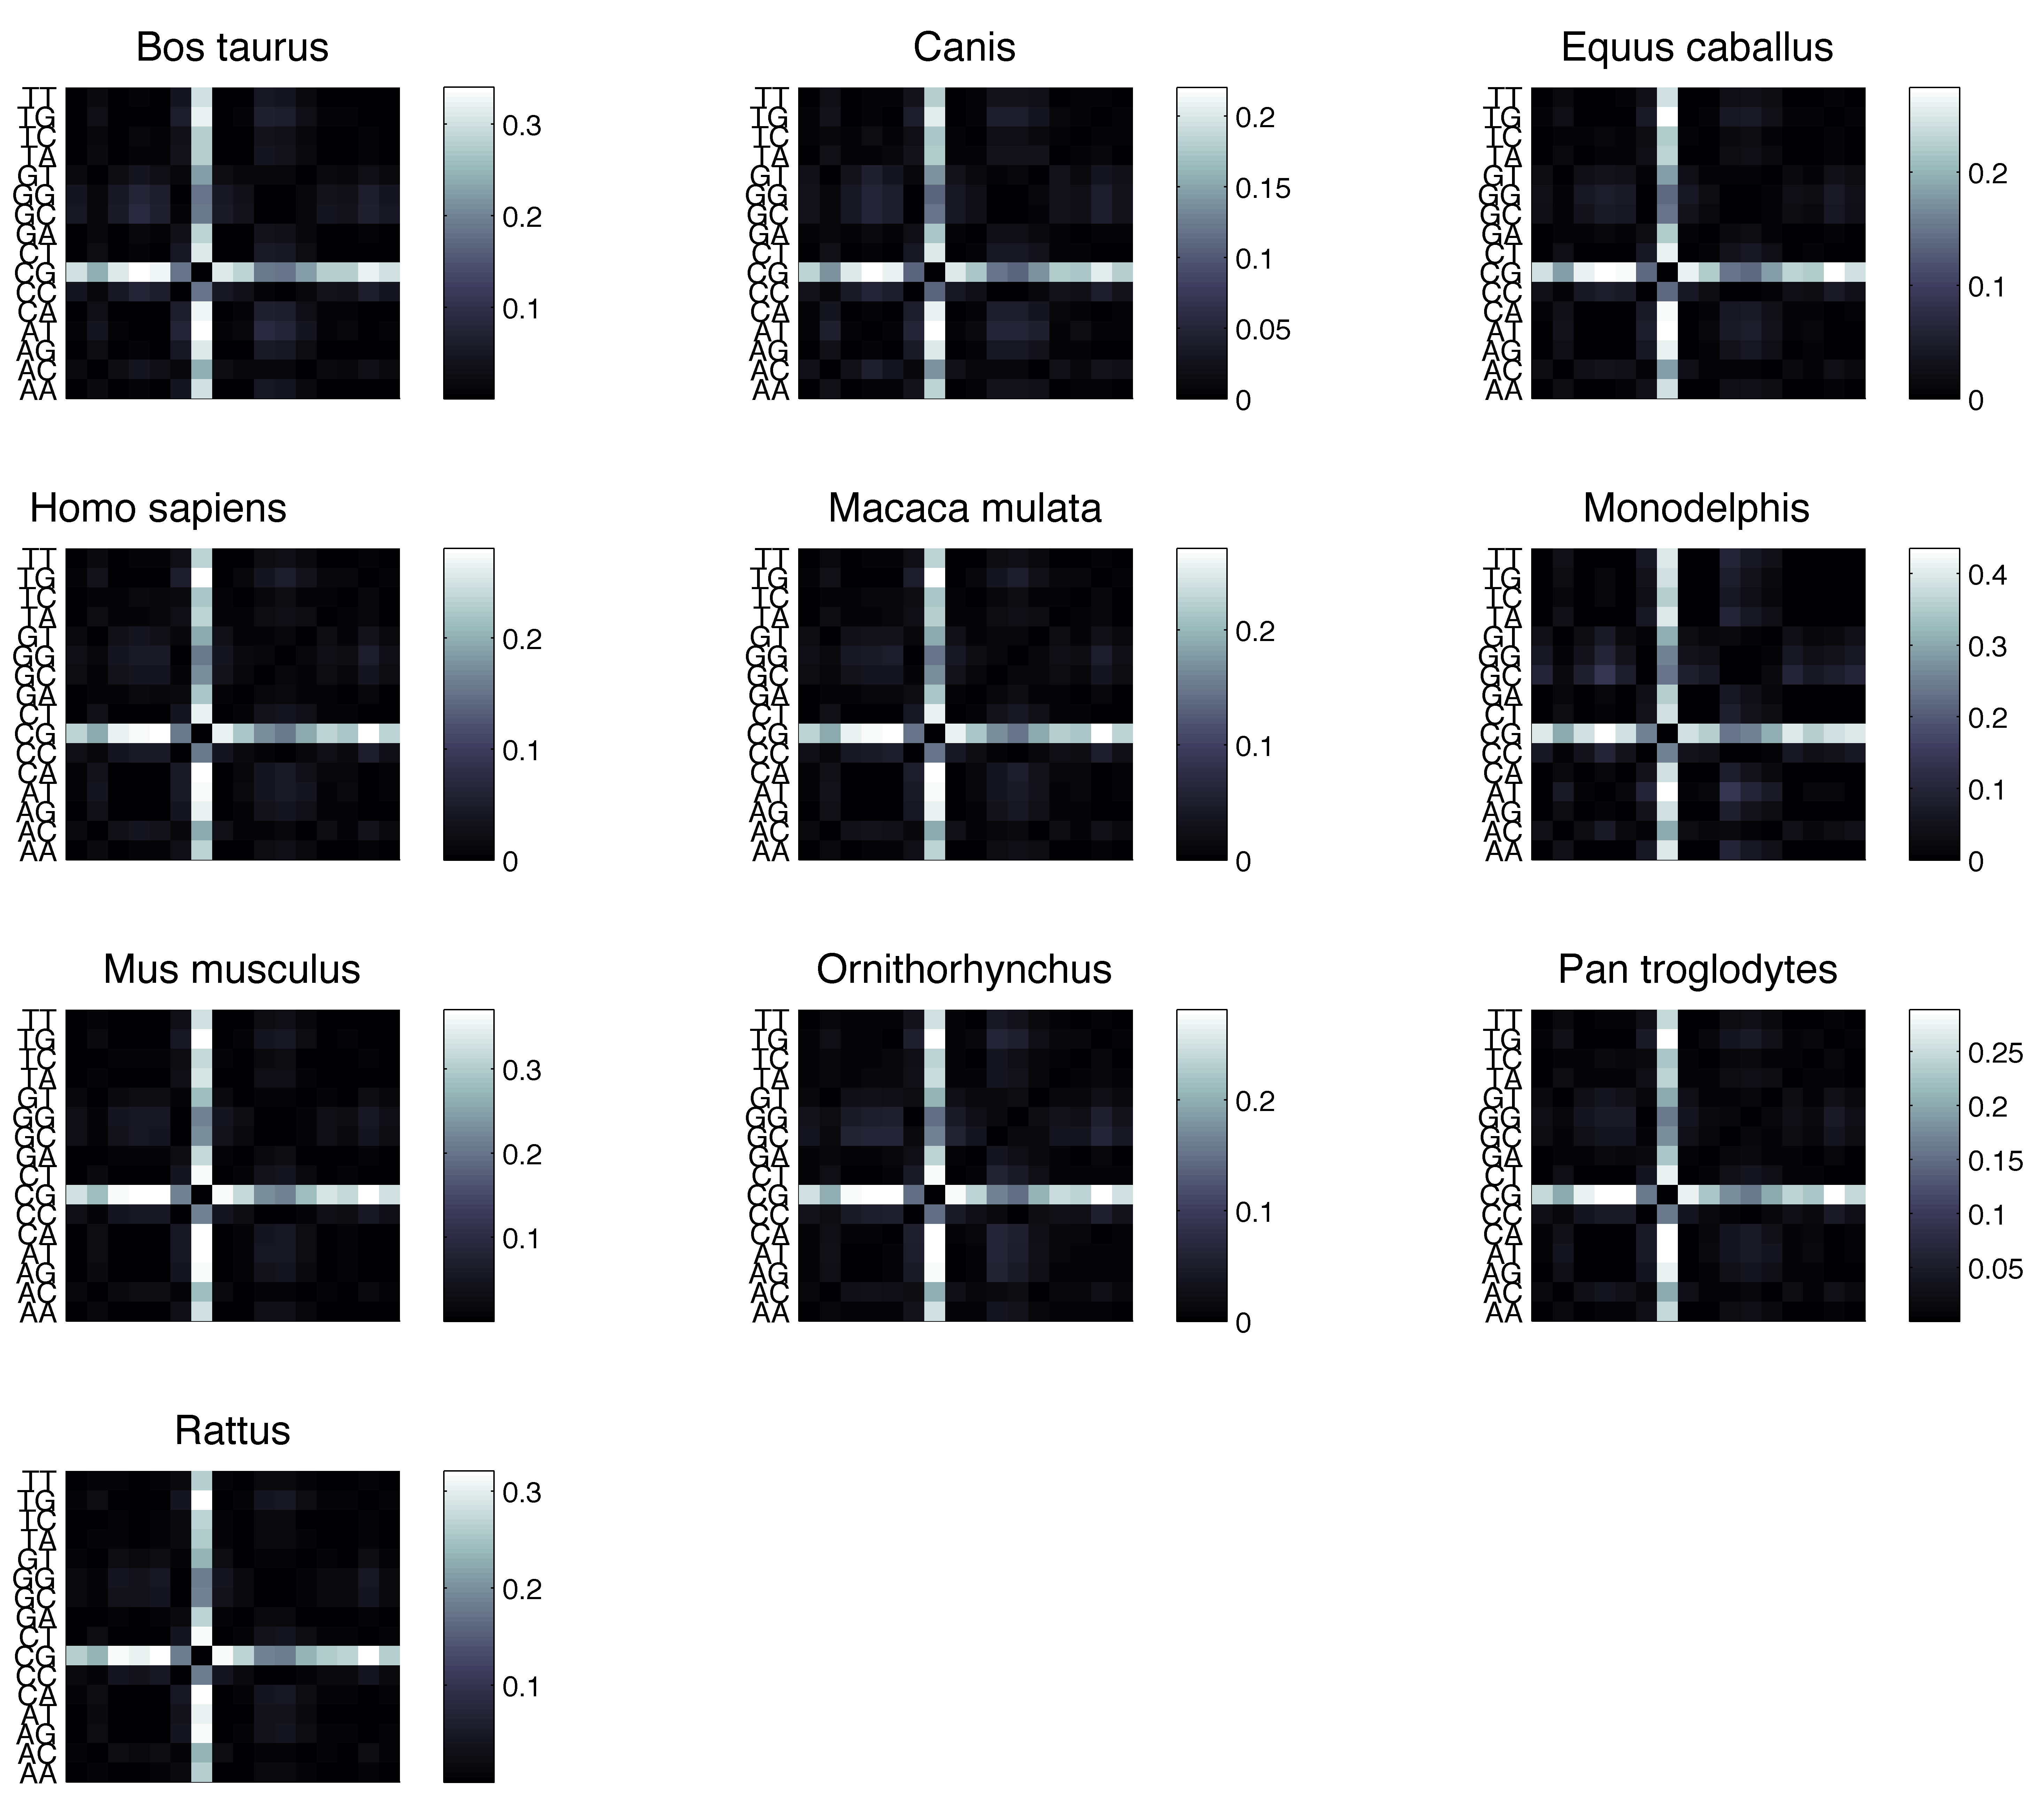
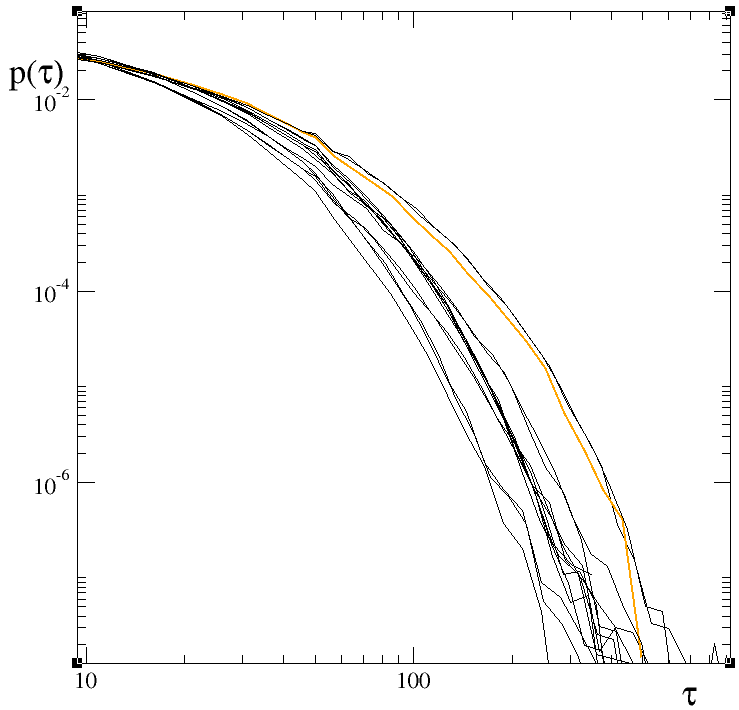
For all the 21 organisms, we have estimated the inter-distance distributions for all the 16 dinucleotides, and compared the distributions with each other via the Jensen-Shannon distance. We observe that a group of 10 organisms, that we can recognize as mammals, has a strikingly different distribution of CG distances, compared to the others (as shown in Fig. 2). This difference is particularly evident in the tail of the CG distributions, cf. Figure 1 for man and mouse.
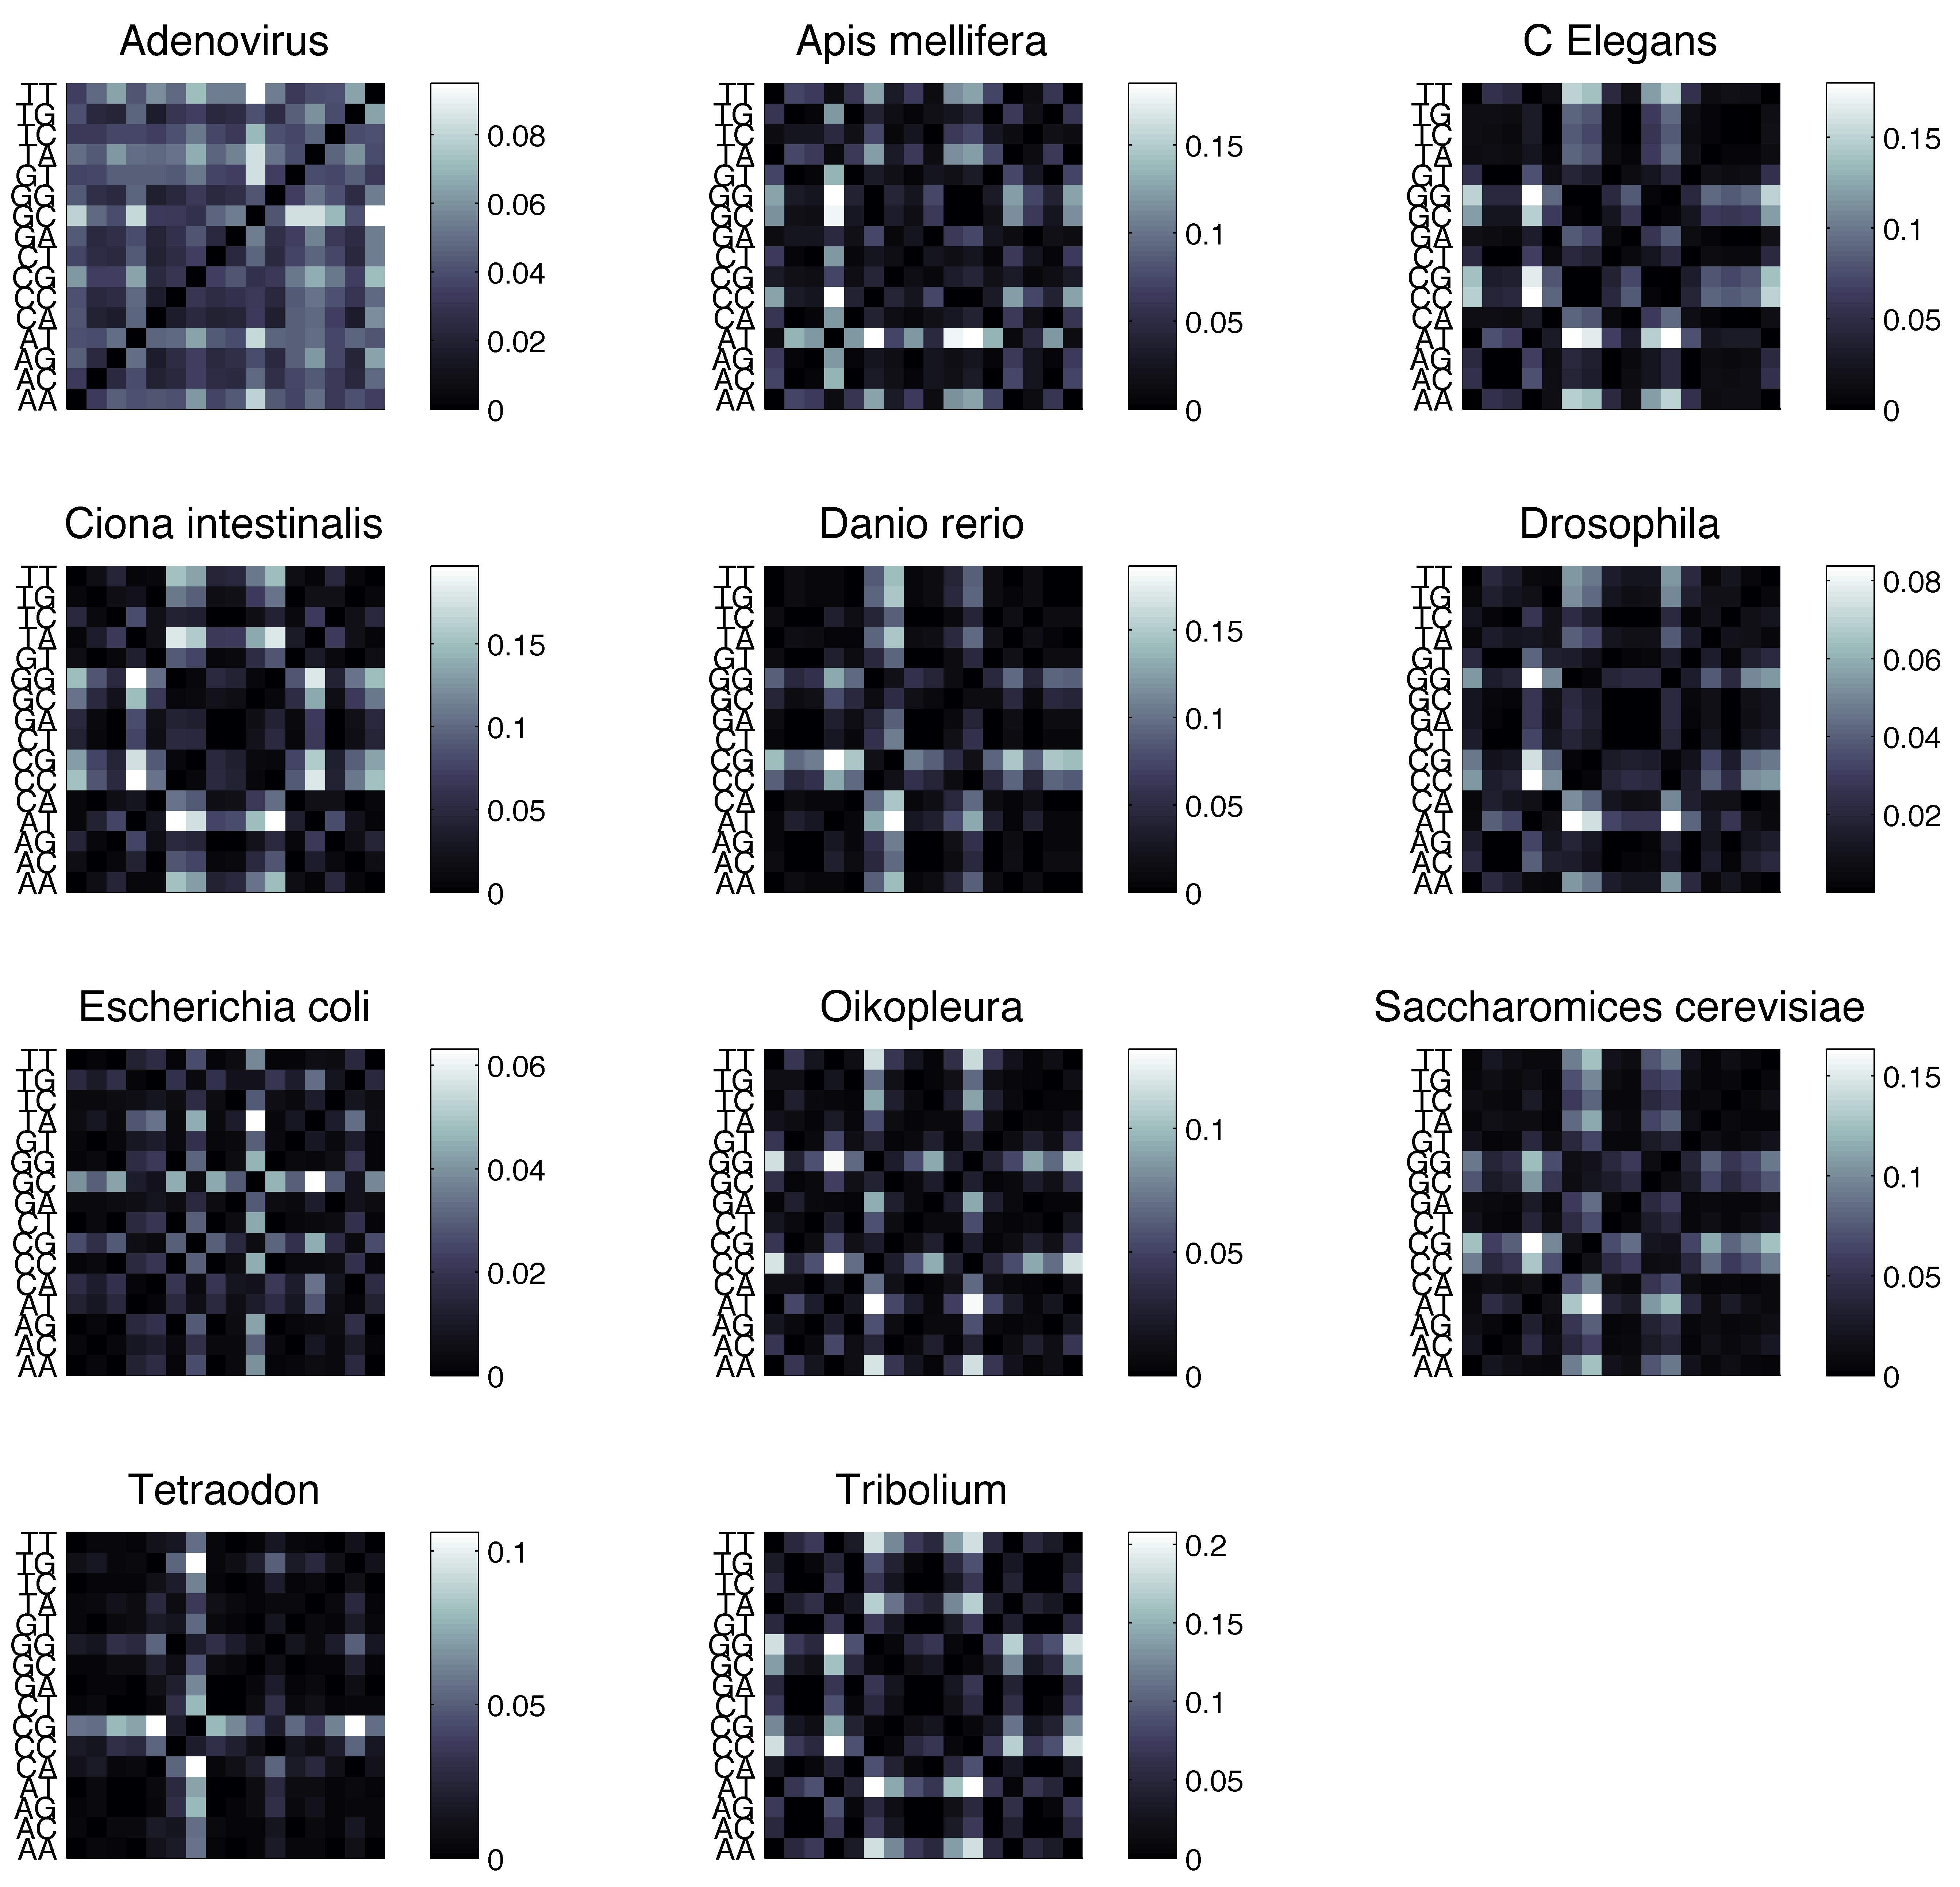
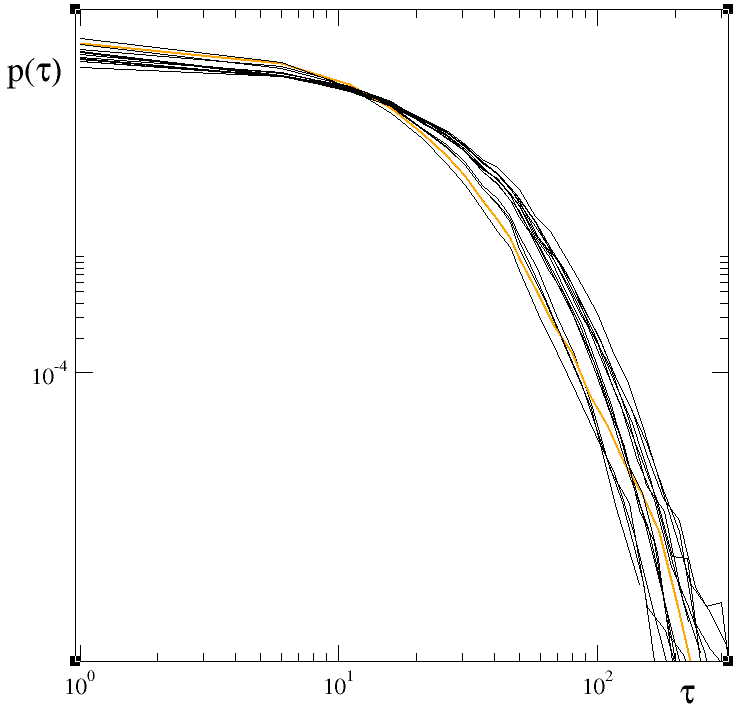
The remaining 11 organisms show a more heterogeneous behavior, in term of the Jensen-Shannon distance: for Adenovirus, Apis, E. Coli and Oikopleura no clear difference can be seen, while for the other organisms the dinucleotide CG , but also CC, GC and GG, appears different from the other distributions, showing analogous patterns of JS distances (see Fig. 3).
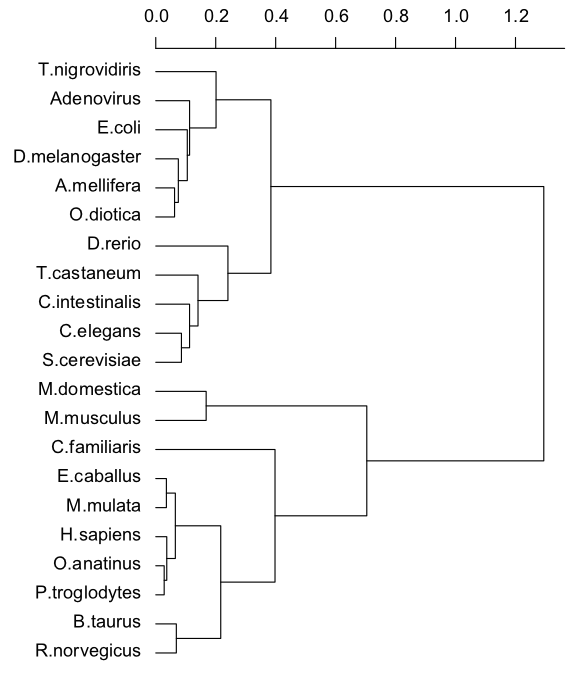
The power of the JS distance in differentiating between CG and other dinucleotides can be appreciated in Fig. 4: a hierarchical clustering of all organism assigns to two distinct groups mammalians and the other organisms.
A plot of two sample organisms, Drosophila and E. Coli, shows that the 16 dinucleotide distributions are not as different between each other as for higher-order organisms (see Fig. 5). It might be plausible that, in this group of lower-order organisms, different mechanisms related to CG methylation are present, possibly related to their different degrees of complexity, since this group comprises viruses, bacteria, a yeast strain, insects and fish.
In order to verify the goodness of this hypothesis, and also to compare the different organisms, we have generated the cumulative distribution of the CG inter-distances for each organism, and fitted their tails with an exponential function333We have fitted the empirical cumulative distributions in an interval of distances between 700 and 2000, to remove the effect of short distances and the possible undersampling at large distances. We have verified that reducing the lower extreme of the interval up to 300 and increasing the higher extreme up to the maximum length did not change the results significantly.. Since Adenoma, E. coli , Oikopleura and Saccharomices have a smaller maximum observed distance (517, 318, 679 and 308 respectively), in these cases we have fitted the whole CG distribution.
tb Organism Max d Bos Taurus 3709 0.0037 0.0001 272 1 0.999 0.032 Canis Familiaris 3248 0.0036 0.0001 274 1 0.999 0.052 Equus Caballus 2927 0.0047 0.0001 214 1 0.999 0.078 Homo Sapiens 3760 0.004 0.0001 252 1 0.999 0.044 Macaca Mulatta 3907 0.0042 0.0001 240 1 0.999 0.039 Monodelphis domestica 8123 0.0022 0.0001 452 1 0.999 0.018 Mus Musculus 4617 0.0034 0.0001 295 1 0.999 0.046 Ornithorhynchus anatinus 2841 0.0043 0.0001 232 1 0.999 0.062 Pan Troglodytes 3376 0.004 0.0001 248 1 0.999 0.034 Rattus norvegicus 3845 0.0039 0.0001 257 1 0.998 0.056 Adenovirus 517 0.012 0.001 83 3 0.845 0.46 Apis Mellifera 6958 0.0033 0.0001 296 2 0.995 0.095 Caenorhabditis Elegans 4284 0.0015 0.0001 647 8 0.946 0.58 Ciona Intestinalis 3560 0.002 0.0001 490 18 0.688 0.31 Danio Rerio 4072 0.0035 0.0001 288 2 0.979 0.12 Drosophila melanogaster 568 0.023 0.001 44 1 0.992 0.33 Escherichia coli 324 0.037 0.001 27 1 0.973 0.36 Oikopleura diotica 679 0.019 0.001 51 1 0.920 0.27 Saccharomices Cerevisiae 308 0.027 0.001 37 1 0.995 0.11 Tetraodon nigroviridis 1573 0.0032 0.0001 312 7 0.883 0.74 Tribolium castaneum 2455 0.0026 0.0001 388 3 0.983 0.46
The resulting fit parameters are shown in Table 1. As it can be seen, the fit is very good (, ) for the group of organisms in Fig. 1 which showed a different CG distribution. Moreover, for these organisms, the fit parameters are very similar, with a characteristic length ranging from to about bases (from a minimum of for Equus to a maximum of for Mouse). The only exception is Monodelphis, which has a characteristic length of 452, nearly double the others. This can be due to the fact that in this organism CpG autosomal density is very different from the other amniotes ( versus [32]). For the other group of organisms, once again, the situation is more heterogeneous: for example, for Apis and Danio the exponential function seems to fit the empirical data well (, ) and also the characteristic lengths are comparable with the ones of the first group (, , respectively), while Drosophila and Saccharomices have very good fits (, for S. cerevisiae), but their characteristic lengths differ by an order of magnitude ( respectively). For other organisms the exponential distribution seems unfit, even if with an heterogeneous degree of dissimilarity (see Supplementary Figure 2 for a visual inspection).
Finally we remark that some small characteristic lengths could be related to the small size of the genome of the organism (as for Adenovirus, E. coli and S. cerevisiae), but this association between parameter and genome size cannot be generalized to the other organisms.
4 Discussion
We have characterized the first-return time distributions of dinucleotides in DNA sequences, from a large set of organisms with different levels of complexity (from viruses to primates).
What we have found in human DNA is a striking difference for the dinucleotide CG: the inter-distance distribution of CG’s has an exponential tail, while the distributions for the other dinucleotides exhibit a power-law tail. An exponential distribution of return times is found in a stochastic process with a characteristic time scale, that in our case represents a characteristic distance between the dinucleotides, which is very different from a process with a power-law distribution of return times. This feature of the dinucleotide CG might reflect their peculiar functional and structural role inside DNA, since CG dinucleotides are known to be the sites for DNA methylation, an epigenetic mechanism known to be involved in gene regulation and also in structural conformation of DNA chromatin.
We have extended this analysis to other 20 organisms, many of which (such as mammals) should be very similar to man in terms of DNA processing while others (like viruses, bacteria and unicellular organisms) should be very different. Finally for the other organisms considered in our study (such as insects, fish and worms ), the differences are not in principle so clear. For example, many of the chosen organisms (E. coli, C. elegans, honeybee, fruitfly, Ciona, Tribolium, Danio, Tetraodon, mouse, man) are known to have different degrees of functional similarities between each other, in terms of hortologies of the main family of enzymes governing DNA methylation processes (see [25]), but for many of the organisms we studied such information is not actually available.
What we observe is a striking similarity between mammals (Fig. 2), which are known to have very similar DNA methylation processes, and also similar levels of global DNA methylation. The investigation of the CG cumulative distributions in these organisms showed a common exponential distribution for the long-range dinucleotide inter-distances. Moreover, the characteristic lengths associated to these distributions are also consistently similar (), thus suggesting that the common biological mechanisms involved in CG methylation are reflected in the similar DNA structure at the scale of dinucleotide inter-distance.
The remaining organisms (Fig. 3) span a larger range of organismal complexity, thus the overall picture appears more heterogeneous from a biological point of view, and this is reflected in our analysis. For example Escherichia Coli, a bacterium that does not possess similar epigenetic mechanisms and probably does not exploit DNA methylation processes for the same purposes as pluricellular organisms, does not present significant differences between dinucleotide distributions. The same is true for Adenovirus. This different behavior might be justified by a different role of DNA methylation in bacteria, or by the fact that only a small portion of bacterial DNA is affected by this process [15]. Thus, our statistical approach might not be sensitive enough to highlight possible differences. The case of fruitfly looks similar, since the difference between dinucleotide distributions is not as marked, as shown in the double logarithmic plot of Fig. 5. This is consistent with what is known about the very low levels of DNA methylation in fruitfly, and the absence of DNMT family hortologs [25].
This approach has been exploited to classify organisms in phylogenetic trees [1], but our analysis shows that it might also help infer the presence of DNA epigenetic mechanisms in poorly characterized organisms, even if a clear association of these observations with specific biological mechanisms is yet to come.
The exponential function used to fit of the CG inter-distance distribution at a whole-genome level seems to highlight a structural role of CGs in higher-level organisms, since it is the signature of a regular “marking” along all the DNA sequence. An observation, that in our opinion might deserve deeper investigation, is that the characteristic lengths found in the first group of organisms is comparable to the length typically associated with histones, protein complexes that play a role in chromatin modelling. It is known that the length of a DNA sequence wrapped around histones is the size of the nucleosome plus a variable linker DNA region, summing up to about 220 bases, therefore the characteristic length of CG inter-distance could be associated with the positioning of histone positioning along the genome and possibly with three-dimensional structure of DNA.
Authors’ contribution
GP generated the data and analyzed the data. GC designed the analysis and analyzed the data. BM, ML, MDE and GCC helped interpreting the results and revised the paper. DR designed the analysis, analyzed the data and wrote the paper. The Authors declare no financial or other competing interests.
Funding
DR, GC, BM and ML were partially funded by the University of Bologna grant "FARB Linea 1" 2013-2016. DR and GCC were also partially funded by the MIUR Flagship InterOmics grant (PB05).
References
- [1] V. Afreixo, C. A. Bastos, A. J. Pinho, S. P. Garcia, and P. J. Ferreira. Genome analysis with inter-nucleotide distances. Bioinformatics, 25(23):3064–3070, Dec 2009.
- [2] V. Afreixo, C. A. Bastos, J. M. Rodrigues, and R. M. Silva. Identification of dna cpg using inter-dinuclotide distances. Communications in Computer and Information Science, 499:162–172, 2015.
- [3] Paolo Allegrini, Paolo Grigolini, and BJ West. A dynamical approach to DNA sequences. Physics Letters A, 211:217–222, 1996.
- [4] E. G. Altmann, G. Cristadoro, and M. D. Esposti. On the origin of long-range correlations in texts. Proc. Natl. Acad. Sci. U.S.A., 109(29):11582–11587, Jul 2012.
- [5] A Arneodo, E Bacry, PV Graves, and JF Muzy. Characterizing long-range correlations in DNA sequences from wavelet analysis. Physical Review Letters, 74(16):3293–3297, 1995.
- [6] Alain Arneodo, Cédric Vaillant, Benjamin Audit, Françoise Argoul, Yves D’Aubenton-Carafa, and Claude Thermes. Multi-scale coding of genomic information: From DNA sequence to genome structure and function. Physics Reports, 498(2-3):45–188, 2011.
- [7] B. Audit, C. Thermes, C. Vaillant, Y. D’Aubenton-Carafa, J. Muzy, and A. Arneodo. Long-Range Correlations in Genomic DNA: A Signature of the Nucleosomal Structure. Physical Review Letters, 86(11):2471–2474, 2001.
- [8] C. A. Bastos, V. Afreixo, A. J. Pinho, S. P. Garcia, J. M. Rodrigues, and P. J. Ferreira. Inter-dinucleotide distances in the human genome: an analysis of the whole-genome and protein-coding distributions. J Integr Bioinform, 8(3):172, 2011.
- [9] T. Bettecken, Z. M. Frenkel, and E. N. Trifonov. Human nucleosomes: special role of CG dinucleotides and Alu-nucleosomes. BMC Genomics, 12(1):273, 2011.
- [10] S. V. Buldyrev, A. L. Goldberger, S. Havlin, R. N. Mantegna, M. E. Matsa, C. K. Peng, M. Simons, H. E. Stanley, and A. L. Goldberger. Long-range correlation properties of coding and noncoding DNA sequences: GenBank analysis. Phys Rev E Stat Phys Plasmas Fluids Relat Interdiscip Topics, 51(5):5084–5091, May 1995.
- [11] R. K. Chodavarapu, S. Feng, Y. V. Bernatavichute, P. Y. Chen, H. Stroud, Y. Yu, J. A. Hetzel, F. Kuo, J. Kim, S. J. Cokus, D. Casero, M. Bernal, P. Huijser, A. T. Clark, U. Kramer, S. S. Merchant, X. Zhang, S. E. Jacobsen, and M. Pellegrini. Relationship between nucleosome positioning and DNA methylation. Nature, 466(7304):388–392, Jul 2010.
- [12] J. S. Choy, S. Wei, J. Y. Lee, S. Tan, S. Chu, and T. H. Lee. DNA methylation increases nucleosome compaction and rigidity. J. Am. Chem. Soc., 132(6):1782–1783, Feb 2010.
- [13] T. Cover and J. Thomas. Elements of information theory. John Wiley and Sons, second edition, 2006.
- [14] K. N. Dahl, P. Scaffidi, M. F. Islam, A. G. Yodh, K. L. Wilson, and T. Misteli. Distinct structural and mechanical properties of the nuclear lamina in Hutchinson-Gilford progeria syndrome. Proc. Natl. Acad. Sci. U.S.A., 103(27):10271–10276, Jul 2006.
- [15] R. Donczew, J. Zakrzewska-Czerwi?ska, and A. Zawilak-Pawlik. Beyond DnaA: the role of DNA topology and DNA methylation in bacterial replication initiation. J. Mol. Biol., 426(12):2269–2282, Jun 2014.
- [16] Richard Durrett. Probability : theory and examples. Cambridge University Press, 2010.
- [17] M. Esteller. Non-coding RNAs in human disease. Nat. Rev. Genet., 12(12):861–874, Dec 2011.
- [18] KM Frahm and DL Shepelyansky. Poincaré recurrences of DNA sequences. Physical Review E, 2012.
- [19] M. Gardiner-Garden and M. Frommer. CpG islands in vertebrate genomes. J. Mol. Biol., 196(2):261–282, Jul 1987.
- [20] I Grosse, H Herzel, S V Buldyrev, and H E Stanley. Species independence of mutual information in coding and noncoding DNA. Physical review. E, Statistical physics, plasmas, fluids, and related interdisciplinary topics, 61(5 Pt B):5624–5629, 2000.
- [21] L. Guelen, L. Pagie, E. Brasset, W. Meuleman, M. B. Faza, W. Talhout, B. H. Eussen, A. de Klein, L. Wessels, W. de Laat, and B. van Steensel. Domain organization of human chromosomes revealed by mapping of nuclear lamina interactions. Nature, 453(7197):948–951, Jun 2008.
- [22] M. Guttman and J. L. Rinn. Modular regulatory principles of large non-coding RNAs. Nature, 482(7385):339–346, Feb 2012.
- [23] H Herzel and I Grosse. Correlations in DNA Sequences and the Role of Protein Coding Segments. Physical Review E, (55):800–810, 1997.
- [24] H. Heyn, S. Moran, and M. Esteller. Aberrant DNA methylation profiles in the premature aging disorders Hutchinson-Gilford Progeria and Werner syndrome. Epigenetics, 8(1):28–33, Jan 2013.
- [25] A. Jeltsch. Molecular biology. Phylogeny of methylomes. Science, 328(5980):837–838, May 2010.
- [26] I. Jimenez-Useche and C. Yuan. The effect of DNA CpG methylation on the dynamic conformation of a nucleosome. Biophys. J., 103(12):2502–2512, Dec 2012.
- [27] T. Jursch, C. Miskey, Z. Izsvak, and Z. Ivics. Regulation of DNA transposition by CpG methylation and chromatin structure in human cells. Mob DNA, 4(1):15, 2013.
- [28] W Li. The study of correlation structures of DNA sequences: a critical review. Computers & chemistry, 21(4):257–71, 1997.
- [29] Wentian Li, TG Marr, and K Kaneko. Understanding long-range correlations in DNA sequences. Physica D: Nonlinear Phenomena, 1994.
- [30] D Loewenstern and P N Yianilos. Significantly lower entropy estimates for natural DNA sequences. Journal of computational biology : a journal of computational molecular cell biology, 6(1):125–42, 1999.
- [31] R. P. McCord, A. Nazario-Toole, H. Zhang, P. S. Chines, Y. Zhan, M. R. Erdos, F. S. Collins, J. Dekker, and K. Cao. Correlated alterations in genome organization, histone methylation, and DNA-lamin A/C interactions in Hutchinson-Gilford progeria syndrome. Genome Res., 23(2):260–269, Feb 2013.
- [32] T. S. Mikkelsen, M. J. Wakefield, B. Aken, C. T. Amemiya, J. L. Chang, S. Duke, M. Garber, A. J. Gentles, L. Goodstadt, A. Heger, J. Jurka, M. Kamal, E. Mauceli, S. M. Searle, T. Sharpe, M. L. Baker, M. A. Batzer, P. V. Benos, K. Belov, M. Clamp, A. Cook, J. Cuff, R. Das, L. Davidow, J. E. Deakin, M. J. Fazzari, J. L. Glass, M. Grabherr, J. M. Greally, W. Gu, T. A. Hore, G. A. Huttley, M. Kleber, R. L. Jirtle, E. Koina, J. T. Lee, S. Mahony, M. A. Marra, R. D. Miller, R. D. Nicholls, M. Oda, A. T. Papenfuss, Z. E. Parra, D. D. Pollock, D. A. Ray, J. E. Schein, T. P. Speed, K. Thompson, J. L. VandeBerg, C. M. Wade, J. A. Walker, P. D. Waters, C. Webber, J. R. Weidman, X. Xie, M. C. Zody, J. A. Graves, C. P. Ponting, M. Breen, P. B. Samollow, E. S. Lander, and K. Lindblad-Toh. Genome of the marsupial Monodelphis domestica reveals innovation in non-coding sequences. Nature, 447(7141):167–177, May 2007.
- [33] A. S. Nair and T. Mahalakshmi. Visualization of genomic data using inter-nucleotide distance signals. Proceedings of IEEE Genomic Signal Processing, 408, 2005.
- [34] CK Peng. Statistical properties of DNA sequences. Physica A, 221:180–92, 1995.
- [35] CK Peng, SV Buldyrev, and AL Goldberger. Long-range correlations in nucleotide sequences. Nature, 365:168–170, 1992.
- [36] C. Pennetta and L. Palatella. Statistics of extreme variations of rr heartbeat intervals. Fluct. Noise Lett., 11(1):1240015, 2012.
- [37] H. Poincaré. On the three-body problem and the equations of dynamics. Acta mathematica, 13:1–270, 1890.
- [38] A. Razin. CpG methylation, chromatin structure and gene silencing-a three-way connection. EMBO J., 17(17):4905–4908, Sep 1998.
- [39] L. Rossi and G. Turchetti. Poincaré recurrences and multifractal properties of genomic sequences. Physica A, 338:267 – 271, 2004.
- [40] A O Schmitt and H Herzel. Estimating the entropy of DNA sequences. Journal of theoretical biology, 188(3):369–77, 1997.
- [41] G. E. Sims, S. R. Jun, G. A. Wu, and S. H. Kim. Whole-genome phylogeny of mammals: evolutionary information in genic and nongenic regions. Proc. Natl. Acad. Sci. U.S.A., 106(40):17077–17082, Oct 2009.
- [42] E. N. Trifonov, A. K. Konopka, and T. M. Jovin. Unusual frequencies of certain alternating purine-pyrimidine runs in natural DNA sequences: relation to Z-DNA. FEBS Lett., 185(1):197–202, Jun 1985.
- [43] RF Voss. Evolution of long-range fractal correlations and 1/f noise in dna base sequences. Physical Review Letters, 68(25):3805–3808, 1992.
- [44] Richard F Voss. Comments on "Linguistic Features of noncoding DNA sequences". Physical Review Letters, 76, 1996.
- [45] Z. Zhao and L. Han. CpG islands: algorithms and applications in methylation studies. Biochem. Biophys. Res. Commun., 382(4):643–645, May 2009.