SMA observations of the W3(OH) complex: Dynamical differentiation between W3(H2O) and W3(OH)
Abstract
We present Submillimeter Array (SMA) observations of the HCN (3–2) and HCO+ (3–2) molecular lines toward the W3(H2O) and W3(OH) star-forming complexes. Infall and outflow motions in the W3(H2O) have been characterized by observing HCN and HCO+ transitions. High-velocity blue/red-shifted emission, tracing the outflow, show multiple knots, which might originate in episodic and precessing outflows. ‘Blue-peaked’ line profiles indicate that gas is infalling onto the W3(H2O) dust core. The measured large mass accretion rate, 2.310-3 M⊙ yr-1, together with the small free-fall time scale, 5103 yr, suggest W3(H2O) is in an early evolutionary stage of the process of formation of high-mass stars. For the W3(OH), a two-layer model fit to the HCN and HCO+ spectral lines and Spizter/IRAC images support that the W3(OH) Hii region is expanding and interacting with the ambient gas, with the shocked neutral gas being expanding with an expansion timescale of 6.4103 yr. The observations suggest different kinematical timescales and dynamical states for the W3(H2O) and W3(OH).
keywords:
stars:formation— ISM: individual objects (W3(H2O), W3(OH))—ISM: kinematics and dynamics1 Introduction
Current theories and observations suggest that low-mass stars form by gravitational collapse and subsequent accretion through a circumstellar disk, with the accretion energy driving a collimated outflow perpendicular to the plane of the disk. Therefore, accretion disks and outflows are physically connected and are key ingredients in the process of formation of low-mass stars. For high-mass stars, their formation process is still not well understood. Outflows are frequently detected in high-mass star forming regions, but it is thought that high-mass star formation is not merely a scaled-up version of the low-mass star formation process characterized by larger outflow parameters (e. g., Wu et al. 2004), poor collimation around massive young stars (e. g., Shepherd & Churchwell 1996; Zhang et al. 2005) and higher accretion rates (see review by Zinnecker & Yorke 2007). Additionally, disks in high-mass young stellar objects are still elusive — only a few of them have been detected (Zhang et al. 1998; Shepherd, Claussen & Kurtz 2001; Patel et al. 2005; Jiang et al. 2005; Sánchez-Monge et al. 2013a, 2014) — probably due to their short lifetimes, the necessity of achieving high angular resolution (not available in the observations prior to ALMA) and source confusion in dense clusters. Therefore, the study and characterization of the outflow and infall processes involved in the formation of high-mass stars need to be understood in more detail. Since high-mass stars form in dense cores, dense gas tracers such as HCN are useful in identifying outflow and infall motions (e. g., Liu et al. 2011a, 2011b, 2013, 2015; Wu et al. 2005). It has also been demonstrated that the profile of spectral lines such as HCN (3–2) and HCO+ (3–2) are good tools to search for and study the infall motions (see simulations by Smith et al. 2012, 2013; and Chira et al. 2014).
Located at a distance of 2.04 kpc (Hachisuka et al. 2006), the W3(OH) complex, consisting of two objects: W3(OH) itself and W3(H2O), is one of the well-studied high-mass star forming regions. W3(OH) is associated with an ultracompact (UC) Hii region powered by an O7 star ( Dreher & Welch 1981; Wilner, Welch & Forster 1995), while W3(H2O) is rich in H2O maser emission and organic molecules (Alcolea et al. 1993; Wyrowski et al. 1999; Hernández-Hernández et al. 2014; Qin et al. 2015), suggesting that it is at an earlier evolutionary stage. The observations suggest that W3(H2O) has a mass of 10–20 M⊙ and a luminosity of 103–104 L⊙ (Wilner, Welch & Forster 1995). High-angular resolution observations of the continuum and CH3CN lines resolve W3(H2O) into three subcomponents: A, B, and C; with A and C likely forming a binary system (Wyrowski et al. 1999; Chen et al. 2006). Non-thermal radio jets and water maser outflows have been revealed with VLA and VLBA (Alcolea et al. 1993; Reid et al. 1995; Wilner et al. 1999) observations along the east-west direction centered on W3(H2O). Two CO molecular outflows (with PA=40∘ and 15∘) and probably a rotating disk, have been studied in the W3(H2O) with interferometers (Zapata et al. 2011). Single-pointing spectral line surveys reveal infall motions in the W3(OH) complex (e. g., Wu & Evans 2003; Wu et al. 2010), but the infalling center and the gas accretion rate have not been well determined. The kinematics of W3(OH) are still under debate. OH masers and NH3 absorption features suggest a collapsing outer envelope (Reid et al. 1980; Garay, Reid & Moran 1985; Guilloteau, Stier & Downes 1983), while expansion motions were proposed based on OH maser observations and multi-epoch VLA observations (Bloemhof, Reid & Moran 1992; Kawamura & Masson 1998).
In this paper, we present HCN and HCO+ line observations of the W3(OH) star-forming complex obtained with the Submillimeter Array (SMA)111The Submillimeter Array is a joint project between the Smithsonian Astrophysical Observatory and the Academia Sinica Institute of Astronomy and Astrophysics and is funded by the Smithsonian Institution and the Academia Sinica. and Caltech Submillimeter Observatory (CSO). The results show kinematical differences between the W3(H2O) and W3(OH), in which infall motion seems to occur only towards the W3(H2O) with evidence for jet procession, while gas expansion is observed towards W3(OH).
2 Observations
The SMA was used to observe the HCN (3–2) and HCO+ (3–2) transitions at 267 GHz. We summarize here the main aspects of the observations, while further details and the data reduction process can be found in Qin et al. (2015). The observations cover the HCN (3–2) and HCO+ (3–2) transitions at 267 GHz, with an spectral resolution of 0.406 MHz (corresponding to 0.5 km s-1). The weather conditions were good during the observations resulting in system temperatures of around 200 K. Flux calibration was performed using Uranus and we estimate an uncertainty of 20%. The rms (1 ) noise level is 0.15 Jy beam-1.
Single-dish observations of HCN (3–2) were obtained using the 10.4 m telescope at the Caltech Submillimeter Observatory (CSO), on 2003, January 15. We covered an area of 110, with 10′′ spacing. The beam size and main beam efficiency are 28′′ and 60%, respectively. These observations were used to complement the missing short spacing information of the HCN (3–2) SMA observations. The CSO data were converted to Miriad format. The task MOSMEM was used to perform a joint deconvolution of the interferometric and single-dish data. The resulting combined dataset has a spatial resolution of 22 (PA=–60∘) with robust weighting, and a sensitivity of 0.17 Jy beam-1, with 1 Jy beam-1 corresponding to a main beam brightness temperature of 3.5 K.
3 Results
3.1 Gas Distribution
3.1.1 HCN spectra obtained with the CSO

The W3(H2O) hot core was first studied in the HCN (1–0) line at 89 GHz by Turner & Welch (1984). However, their observations lack a good spectral resolution (4.1 km s-1), and can not resolve detailed kinematics. The single pointing CSO observations of W3(OH) by Wu & Evans (2003) show that the HCN (3–2) line has a double peak, with the blue-shifted peak being stronger than the red-shifted one (hereafter ‘blue profile’), while the H13CN (3–2) line peaks at the absorption dip of the HCN (3–2), which was used by the authors to identify W3(OH) as a collapsing candidate object. However, their low-spatial resolution observations can not determine the center of collapse. Our CSO observations of the HCN (3–2) line, covering an area of 110, are shown in Figure 1. The ‘blue-profile’ is not only seen towards the central position but towards a large area, suggesting that the W3(OH) complex is overall undergoing collapse, similar to what is observed in the G10.60.4 star forming region (Liu et al. 2013).
3.1.2 Channel maps and velocity field
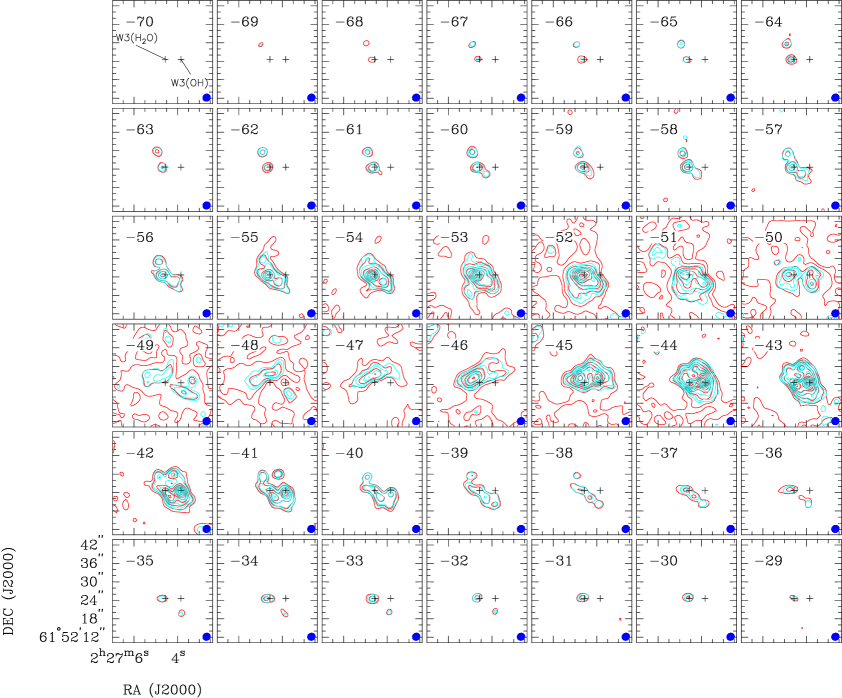
Figure 2 shows the velocity channel map of the HCN (3–2) line at 265.886 GHz as observed with the SMA (green contours). The combined SMA and CSO data (SMA+CSO, red contours) are overlaid. The structure of the emission is the same in the SMA and SMA+CSO datasets in the velocity ranges from 69 to 53 km s-1 and from 42 to 29 km s-1. Around the systemic velocity of the cloud (i. e., from 52 to 43 km s-1), the distribution of the gas consists of compact and diffuse components. As expected, the SMA data pick up the compact component well, while the diffuse gas is only detected with the CSO single-dish observations. A velocity gradient is seen in the channel maps, with a blue-shifted (from 69 to 56 km s-1) component to the north-east of the W3(H2O), and a red-shifted component (from 40 to 32 km s-1) to the south-west. At around 47 to 46 km s-1, we identify a flattened structure, without diffuse emission, elongated in the southeast-northwest direction. This velocity range is close to the self-absorption peak (see Section 3.2.2 and Figure 3) for the HCN (3–2) line, suggesting that it traces a high-obscured part of the core, therefore likely locates at the center of the dense core. This structure is perpendicular to the high velocity blue and red-shifted gas, which might indicate the presence of a disk (or toroid) and outflow system. In general, the gas is mainly associated with W3(H2O), suggesting that HCN high velocity gas is most likely related to the presence of W3(H2O) rather than W3(OH). In addition to the high velocity gas associated with W3(H2O), emission from 44 to 40 km s-1 reveals a north-south velocity gradient across W3(OH) which is consistent the CH3OH line as reported in Qin et al. (2015) and with the 6.7 GHz CH3OH maser observations of Menten et al. (1992).
3.1.3 Spectra obtained with the SMA
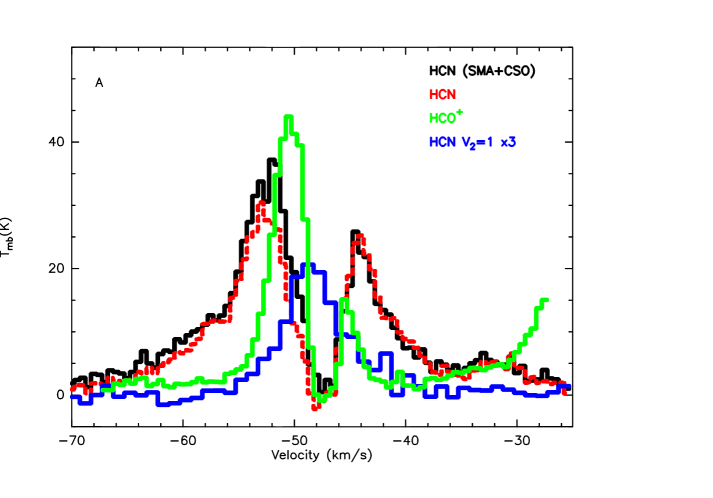
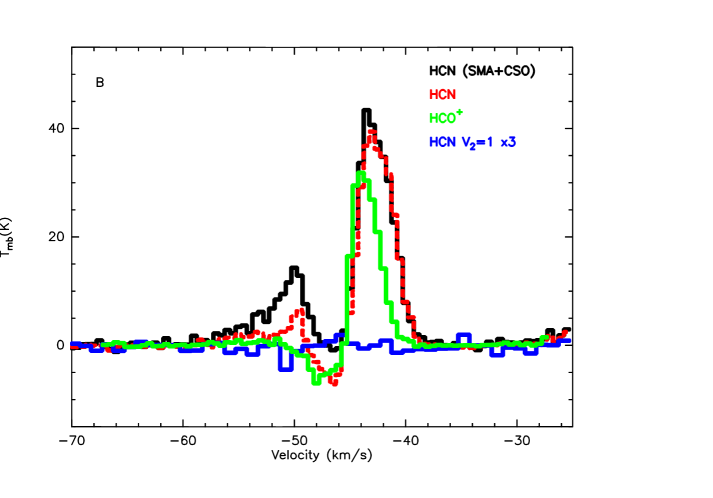
In Figure 3, we show the HCN spectrum obtained after combining the SMA and CSO data (SMA+CSO, black line), and the HCN, HCO+, HCN v2=1 spectra as observed with the SMA (red, green, and blue lines) towards the W3(H2O) and W3(OH) continuum peaks. Both HCN and HCO+ spectra towards the W3(H2O) and W3(OH) show double peak line profiles while weak HCN v2=1 line is only seen towards the W3(H2O). In principle, higher energy transitions can only be exictated in the hot regions while lower energy transitions present in the cold surrounding regions, but also in the hot regions. Qin et al. (2015) argued that non-detection of HCN v2=1 towards the W3(OH) is due to the fact that the gas seen in the W3(OH) comes from the outer region of the UC Hii region and inner portion of this hot core has been disociated by the stars, and lower HCN abundance and gas temperature of envelope make the HCN v2=1 too weak and expected intensity is lower than the SMA detection limit. The broad line is seen in HCN but not in HCO+ towards the W3(H2O) (see top panel of Figure 3), suggesting that HCN is better tracing the molecular outflow of this region. Both HCN and HCO+ show an absorption dip at around 47.8 km s-1, with the blue-shifted peak being stronger (‘blue profile’ asymmetry). On the other side, the HCN v2=1 line peaks at around 49 km s-1, i. e., near the position of the absorption dip. The bottom panel of Figure 3 shows the spectra towards the W3(OH) continuum peak position. Differently to the case of W3(H2O), the spectra are prominently red-shifted, i. e., with the red-shifted peak being stronger than the blue-shifted one. This kind of profiles are indicative of gas expansion (e. g., Aguti et al. 2007).
The combined SMA+CSO spectrum at the W3(H2O) continuum peak (top panel of Figure 3) is only slightly stronger than the SMA-only spectrum, indicating that even with only the SMA we are recovering most of the HCN emission, as expected for a tracer of compact and dense gas. The blue side of the SMA spectrum at the W3(OH) continuum peak is much weaker than that of the SMA+CSO data. Previous observations of single dish and interferometers (Mauersberger, Wilson & Henkel 1988; Wilson et al. 1991, 1993; Wink et al. 1994) suggested that the W3(OH) complex consists of extended envelope with lower gas density of 105 cm-3 and the compact core W3(H2O) with gas density of 107 cm-3. The critical density of HCN (3–2) is at one order of 107 cm-3 (at 50 K), so one should see similar spectral profile at the W3(H2O) position with the SMA and SMA+CSO. This is also verified from the channel maps (see Figure 2), in which compact clumps observed by the SMA and SMA+CSO have almost same morphology and extended emission located outside of the compact clumps can only be seen by the SMA+CSO data. As for the W3(OH), the weakness of blue side of the HCN spectrum observed with the SMA should be caused by the filtering effect of the interferometer in which lower density gas in front of Hii region should show blue-shifted emission if the cloud is in expansion, but can be recovered by single dish observations.
The different line profiles may reflect different kinematcis between the W3(H2O) and W3(OH). In Section 3.2.2 and 3.3, we discuss the nature of these profiles.
3.2 Kinematics in W3(H2O)
Observations showed that molecular line emissions mainly arise from the W3(H2O) core with higher gas density while absorption lines are obseved in the W3(OH) which have lower density (Mauersberger, Wilson & Henkel 1988; Wilson et al. 1991, 1993, Wink et al. 1994). The two sources are spatially separated and have different systemic velocities (Wilson et al. 1991; Qin et al. 2015), implying different physics and kinematics. At a large scale, the two sources share same envelope and the background sources will affect the observed optically thick line shapes in both line profile and intensity if the background source has different kinematics. We think these will not obviously affect the observed line shape and intensity of the W3(H2O) since higher density gas dominates kinematics of the compact core as seen from Figure 2 and Figure 3. 90% of the molecular matter associated with the W3(OH) is located behind or to the side of the W3(OH) Hii region (Wilson et al. 1991). Thus one should see ‘red asymmetry’ line profile of HCN and HCO+ with comparable read peak line intensity observed by the SMA and SMA+CSO. An alternative explanation of the line profile toward the W3(OH) is that W3(OH) may be located behind W3(H2O) and the blue-shifted HCN emission toward this source is absorbed by the dense envelope of the W3(H2O), producing the observed red asymmetry. If so, one should see similar velocity pattern as in the W3(H2O). But the blue-shifted peak velocities between the two cores are different (see Figure 3), thus the observed ‘red asymmetry’ line profile supports gas expansion in the W3(OH) region.
3.2.1 Molecular outflows
Previous observations of the CO (2–1) line show two large-scale bipolar outflows driven by the W3(H2O)-A and C sources (Zapata et al. 2011). Compared to the CO transition, HCN (3–2) has a higher critical density and should trace compact outflows close to the exciting sources. Figure 4 presents the HCN velocity-integrated intensity map of the SMA+CSO HCN line. Both the blue and red-shifted gas have three emission clumps. The clumps located close to W3(H2O) are likely associated with W3(H2O)-A, while the other clumps are located to the northeast and southwest of the W3(H2O)-C source, suggesting that they are tracing an outflow powered by source C. The outflow has a position angle of 54∘. Assuming that the HCN line wing emission is optically thin, an excitation temperature of 50 K (as in Zapata et al. 2011), and an HCN abundance of 9.610-9 (Qin et al. 2015), under local thermodynamic equilibrium (LTE), we infer an outflow mass of (2.60.3) M⊙ with some uncertainties due to the assumptions of optically thin emission, excitation temperature and fractional abundance of HCN. The estimated dynamic time of the outflow is (5.60.2)103 yr, and the mass loss rate is (4.60.5) 10-4 M⊙ yr-1.

3.2.2 Infall motions
The HCN and HCO+ SMA spectra toward the W3(H2O) continumm peak position show an absorption dip at around the systemic velocity (47.8 km s-1, see Figure 3-top). This absorption dip is also visible in the single-dish data (see Figure 1 of Wu & Evans 2003), indicating that it is not caused by interferometric spatial filtering. Another possible explanation is the presence of two different velocity components, but this is ruled out when examining the higher energy transition of HCN v2=1, which is expected to be optically thin and shows a single peak at the position of the absorption dip (see Figure 3-top). Therefore, the profile seen in the HCN and HCO+ lines is likely due to these lines being optically thick. Moreover, the blue-shifted peak is stronger than the red-shifted one, showing ‘blue profile’ asymmetry. The classical ‘blue asymmetry’ says that the optically thin will peak in the middle of absorption dip of the optically thick line if the emission is from a single source. But in the W3(H2O) case, higher angular observations of continuum and lines have resolved W3(H2O) into A and C subcomponents with different systemic velocities, in which sources A and C have systemic velocities of –51.4 and –48.6 km s-1 (Chen et al. 2006), and –50.5 and –46.5 km s-1 (Zapata et al. 2011) respectively. The HCN v2=1 line presents east-west velocity gradient (Qin et al. 2015) and the emission may contribute from both sources A and C. Therefore the peak velocity of HCN v2=1 does not peak at the HCN absorption dip. Our ‘two-layer model’ gave a medium value of –47.8 km s-1 (see next paragraph) between –48.6 and –46.5 km s-1 of C component, indicating that gas in falling onto the W3(H2O)-C. Following Mardones et al. (1997), we use the asymmetry parameter — the velocity difference between the peaks of the optically thick line () and the optically thin () lines — to quantify the blue asymmetry of the HCN and HCO+ lines in W3(H2O). The parameter is defined as =(/, with being the line width of the optically thin HCN v2=1. An statistically significant excess of blue asymmetric line profiles with indicate that the molecular gas is infalling onto the cores (e. g., Mardones et al. 1997; Wu & Evans 2003; Fuller, Williams & Sridharan 2005; Wu et al. 2007). Gaussian fitting is made to the HCN (3–2), HCO+ (3–2) and HCN v2=1 lines. The resulting for HCN (3–2) and HCO+ (3–2) are and , respectively. These values indicate gas infalling towards the W3(H2O) continuum core.
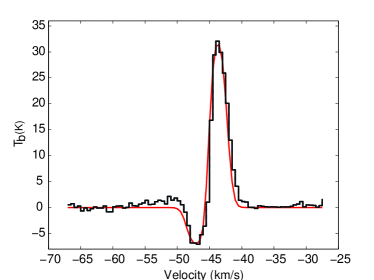
Although the asymmetry parameters devived from both HCN (3–2) and HCO+ (3–2) lines suggest gas infalling motion, the HCN spectrum in the W3(H2O) may be confused by the outflows as seen from Figure 2 and Figure 3. In the case of HCO+ (1–0), the interferometer see 40% of the single dish flux (Wink et al. 1994). HCO+ (3-2) has larger critical denisty compared to HCO+ (1–0) should recover more flux of the single dish observations. In order to quantify the infall rate, we modeled the ‘blue profile’ HCO+ spectrum using a two-layer model (see Appendix, and Myers et al. 1996; Di Francesco et al. 2001). The model fits the observed spectrum by setting the background temperature of the continuum source, the excitation temperature, the beam filling factor, the systemic velocity, the infall velocity, the velocity dispersion, and the peak optical depth. The best fit to the HCO+ spectrum (see Figure 5) results in an infall velocity () of 2.70.3 km s-1 and a velocity dispersion of 0.80.1 km s-1. Similar to the work done by Pineda et al. (2012), we assume that the gas is in a spherically symmetric free fall onto the W3(H2O) core. Therefore, we can estimate the mass infall rate () to be (2.30.7)10-3 M⊙ yr-1.

3.3 Expansion in W3(OH)
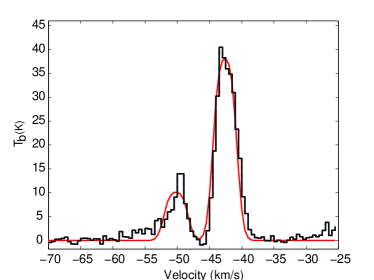
Figure 6 (left panel) shows the HCN spectrum (CSO+SMA) at the W3(OH) continuum peak position. It shows an absorption dip at around the systemic velocity (46.4 km s-1) with the red-shifted peak being stronger than the blue-shifted one (‘red profile’), suggestive of expansion. In the right panel, we show the HCO+ spectrum, which reveals a P-cygni profile. The two-layer model (Myers et al. 1996) was used to fit the observed ‘red profile’ and determine the expansion velocity. Note that we set same filling factor and background temperature for the HCN and HCO+ lines in the model. The mean expansion velocities are estimated to be 3.80.4 km s-1 and 1.60.2 km s-1 from the HCN (CSO+SMA) and HCO+ lines (SMA), respectively. The critical denisty of HCN (3–2) is one order of magnitude higher than that of HCO+ and then one expects HCN to be more opaque in denser regions (Wu & Evans 2003; Reiter et al. 2011). HCN and HCO+ are likely tracing different layers of the cloud, which lead to different expansion velocities. More quantitative analyses by use of radiative transfer model such as RATRAN (Hogerheiheijde & van der Tak 2000) are needed. As done by Rolffs et al. (2010), modeling multiple transitions of HCN or HCO+ spanning a wide energy levels with different opacities can constrain velocity field, abundance and density profiles, and kinematics well. Currently the density and temperature profiles are only obtained towards the W3(H2O) core (Chen et al. 2006). Observations of multilevel transitions of the HCN or HCO are needed to obtain the physical and kinematical structures toward the W3(OH) complex in the future.
 |
 |
In Figure 7, we present the flux ratio map of the Spitzer/IRAC 4.5 m to 3.6 m emission (in color scale) overlaid with the SMA 1.1 mm continuum emission (in contours) towards the W3(OH) complex. The observations and analyses suggested that the morphologies observed at 3.6 m and 4.5 m are similar to each other and to H2 1–0 S(1) line, and thus the emissions of the 4.5 m and 3.6 m bands include bright H2 lines (e. g., Cyganowski et al. 2009; Takami et al. 2010) compared to the other bands of the Spitzer/IRAC instrument. It is thought that a 4.5 m to 3.6 m flux ratio larger than 1.5 traces shocked gas (e. g., Takami et al. 2010). As shown in the figure 7, both the 4.5 and 3.6 m images are saturated within the 1.1 mm continuum emission (the region encompassed by the pink circle), and a reliable ratio image can not be obtained. However, the ratio can be determined in the non-saturated pixels. Values of the ratio are found in an area of diameter 50′′. The ratio map shows a gradient distribution decreasing towards the outer regions, with the largest values found around the W3(OH) continuum source. This result might indicate large-scale shocks in the region. Interestingly, pixels with ratios larger than 3 are found in three ring-like structures surrounding the W3(OH) continuum peak, mainly distributed to the south. This can be interpreted as the ambient gas not being uniform, if the shocked material is due to the expansion of the Hii region.

4 Discussion
4.1 Outflows and infall
At least two CO molecular outflows are identified in the W3(OH) complex, likely driven by the sources W3(H2O)-A and C (Zapata et al. 2011). In comparison, the outflows that we have detected in the HCN (3–2) transition show a smaller spatial extension and outflow mass, which could be explained by the fact that the CO traces large-scale and extended outflowing material. The directions of the outflows determined for both HCN and CO outflows are consistent (see arrows in Figure 4), associated with W3(H2O)-C, and show multiple knots in the red and blue-shifted lobes. So far, only a few massive outflows associated with high-mass star forming regions have been observed to show a discrete knotty structure (e. g., Qiu & Zhang 2009; Sánchez-Monge et al. 2014). One possible interpretation is that the HCN outflows in our observations are made of swept-up ambient gas originated from an episodic and precessing mass-loss process (Arce & Goodman 2001). Non-thermal radio jets and water maser outflows along the east-west direction (PA) revealed by the VLA and VLBI observations (e. g., Wilner et al. 1999), two CO molecular outflows (with PA and 15∘; Zapata et al. 2011) and our HCN outflows (PA) suggest that different tracers trace different kinematics of the outflows, providing another evidence for jet precession in the W3(H2O). A binary system (and disk candidates) have been reported in the W3(H2O) (e. g., Wyrowski et al. 1999; Chen et al. 2006; Zapata et al. 2011). It has been proposed that episodic and precessing outflows might be related to the presence of a binary system (e. g. Arce & Goodman 2001). Therefore, episodic and precessing outflows in the W3(H2O) might be related to the presence of a binary system. The lack of an Hii region in W3(H2O), the presence of strong dust emission and the derived short outflow timescale of (5.60.2)103 yr, compared with other high-mass molecular outflows (e. g., Beuther et al. 2002; Wu et al. 2004; Zhang et al. 2005; Sánchez-Monge et al. 2013b), suggest that the W3(H2O) could be in an early evolutionary stage of the high-mass star formation process.
Spectral infall signatures are seen in W3(H2O), and an unusually large spherical mass infall rate of (2.30.7)10-3 M⊙ yr-1 is derived. Recent observations have revealed high mass accretion rates (10-3–10-2 M⊙ yr-1) in other high-mass star forming regions (e. g., Sandell, Goss & Wright 2005; Garay et al. 2007; Zapata et al. 2008; Wu et al. 2009; Rolffs et al. 2010; Liu et al. 2011a, 2013). This work predicts comparable accretion rates, suggesting high-mass stars are forming in W3(H2O). Adopting an H2 number density of 108 cm-3 (Chen et al. 2006), and assuming that the collapse is uniform, pressure-free, and non-rotating, the free-fall time () is estimated to be 5103 yr, which is consistent with the outflow time scale. The assumptions are reasonable since the derived density profile of W3(H2O) support free fall collapse (Chen et al. 2006). The infall velocity derived from a two-layer collapse model fit to the HCO+ (3–2) line is 2.70.3 km s-1. Assuming that the velocity dispersion (0.80.1 km s-1) is caused by thermal motions, the large infall velocity suggests that collapse is proceeding in a supersonic way. Chen et al. (2006) derived the W3(H2O)-A and C systemic velocities of 51.4 and 48.6 km s-1, respectively, while Zapata et al. (2011) derive systemic velocities of 50.5 and 46.5 km s-1 for the A and C sources. Our two-layer model fitting to the HCO+ line results in a systemic velocity of 47.8 km s-1, which seems to indicate that the gas is infalling onto the W3(H2O)-C.
4.2 Expansion
Based on the relative proper motions of the OH maser spots observed at different epochs towards W3(OH), Bloemhof, Reid & Moran (1992) proposed gas expansion from the UC Hii region to explain the observed pattern of motions. Furthermore, a direct measurement of expansion of the W3(OH) was made through the different difference maps obtained by the VLA at three epochs (Kawamura & Masson 1998). They suggest that the shell-like Hii region is slowly expanding with a typical speed of 3–5 km s-1 and derive a dynamical age of 2300 yr.
The HCN red profile and HCO+ P-cygni profile towards the W3(OH) continuum peak position suggest that the gas in the envelope is expanding (see Figure 6). The two-layer model results in mean expansion velocities of 3.80.4 km s-1 and 1.60.2 km s-1, respectively. Considering the different critical densities of the two transitions, this suggests that the expansion of the envelope is decelerating. Flux ratio map of Spitzer/IRAC 4.5 m and 3.6 m images shows a radial distribution from inside to outside, with the largest ratios found around the W3(OH) continuum source, likely pinpointing W3(OH) as the expansion center. Ratios larger than 1.5 indicate shocked gas, likely produced by the interaction of the expanding Hii region and the molecular cloud. At the distance of W3(OH) (2.2 kpc; Hachisuka et al. 2006), the shock radius of 25′′ (see Figure 7) and the expanding velocity of 3.80.4 km s-1 (derived from HCN line) result in an expanding timescale of about (6.40.7)104 yr. This value is larger than the timescale of 2300 yr derived by Kawamura & Masson (1998), but lower than the typical age of 105 yr for UCHii regions. We do think that the expansion timescale of W3(OH) as derived in this work is reasonable, since the timescale of infall and outflow motions in the W3(H2O) is approximately 5103 yr, and W3(H2O) is likely at an earlier evolutionary stage compared to W3(OH).
4.3 Dynamical state of the W3(OH) complex
The W3(OH) complex is an nearby star formation region harboring two sites of high-mass star formation, W3(H2O) and W3(OH), with different properties. W3(H2O) is rich in water masers and organic molecules, and at earlier evolutionary stage compared to W3(OH), which is associated with an UCHii region and is rich in OH masers. Previous observations of OH masers and NH3 absorption features suggest a collapsing outer envelope outside the UCHii region. Our CSO grid spectra of the HCN (3–2) line (see Figure 1) show a ‘blue profile’ in a large area suggesting that collapse is not happening only around the UCHii region but it is a global collapse in the W3(OH) complex.
At small scales, the two sources have different kinematics, based on both previous studies and the observations presented in this work. A small-scale non-thermal radio jet and water maser outflows along the east-west direction together with large scale CO outflows and a rotating disk candidate have been reported towards in W3(H2O) in previous works. Complementary to this, our HCN and HCO+ line results show infall and outflow motions, and a flattened structure perpendicular to the direction of the outflows. At the same time, relative proper motions of OH maser spots and multi-epoch radio continuum maps suggest the presence of expansion motions originated from the W3(OH) UCHii region. Our molecular line observations, combined with Spitzer/IRAC images confirms the expansion interpretation with W3(OH) being located at the center. From the expansion velocity derived with the two-layer model fit and the size of the shocked gas as revealed by the IRAC images, we determine an expansion timescale of (6.40.7)104 yr.
Based on the above statements, we present a sketch of the dynamical state of the W3(OH) complex in Figure 8. We describe the picture in the following. The W3(OH) complex harbors W3(H2O) and W3(OH), with W3(H2O) being in an earlier evolutionary stage of massive star formation compared to W3(OH), who has already developed an Hii region. Far from the forming stars, the outer envelope of the W3(OH) complex is collapsing inwards. Inside the complex, W3(H2O) is still undergoing collapse and is associated with collimated outflowing material. On the other side the Hii region of W3(OH) is expanding and driving a shock front into the ambient material, which leads to the observed neutral gas expansion and shock.

5 Summary
We have carried out SMA and CSO observations of different molecular tracers (HCN and HCO+ lines) towards the W3(OH) star forming complex. The results are summarized in the following.
-
•
The CSO grid spectral observations of HCN show a blue asymmetric profile over a large area covering the whole star forming complex, which suggests that the outer envelope of the W3(OH) complex is undergoing global collapse.
-
•
The SMA (and SMA+CSO) observations reveal blue asymmetric line profiles for both HCN and HCO+ spectral lines towards the W3(H2O) dust continuum core. A two-layer collapse model is used to fit the HCO+ line shape. The derived mass accretion rate is (2.30.7)10-3 M⊙ yr-1. The free fall timescale is estimated to be 5103 yr.
-
•
Bipolar outflows, identified in the HCN images, are likely driven by the source C in W3(H2O). The molecular outflows show a knotty structure, which might be caused by an episodic and precessing process, likely related to the presence of a binary system in W3(H2O). A mass loss rate of (4.60.7)10-4 M⊙ yr-1 is derived, larger than the typical values found in low-mass molecular outflows. The dynamic time scale of the outflows is around (5.60.2)103 yr, consistent with the free fall timescale. The large accretion and mass loss rates, confirm the formation of high-mass stars in the W3(H2O) region.
-
•
The red asymmetric profile of the HCN line together with the HCO+ P-cygni profile at the W3(OH) continuum peak, indicate that the envelope around this source is expanding. A two-layer model fit to the spectra results in expansion timescales of (6.40.7)103 yr. The Spitzer/IRAC 4.5 m-to-3.6 m flux ratio image is also consistent with the envelope around W3(OH) being in expansion, and shows a gradient distribution from inside to outside with largest values (i. e., more evidence of shock, likely related to a faster expansion) around the W3(OH) continuum source. We conclude that the W3(OH) Hii region is expanding and interacting with the ambient gas, and the shocked neutral gas is decelerating expanding.
In summary, the W3(OH) complex is undergoing global collapse. Inside the complex, the two objects W3(H2O) and W3(OH) are at different evolutionary stage of massive star formation. Infall and outflow motions are observed at an earlier stage in the W3(H2O), while the W3(OH) Hii region is expanding, which leads to observed neutral gas expansion and shock.
Acknowledgements
We thank the anonymous referee, and editor Morgan Hollis for their constructive comments on the paper. This work has been supported by the National Natural Science Foundation of China under grant Nos. 11373026, 11373009, 11433004, 11433008, U1331116, and the National Basic Research Program of China (973 Program) under grant No. 2012CB821800, by Top Talents Program of Yunnan Province (2015HA030) and Midwest universities comprehensive strength promotion project (XT412001, Yunnan university), by the Deutsche Forschungsgemeinschaft, DFG through project number SFB956.
References
- [1] Alcolea, J., Menten, K. M., Moran, J. M., & Reid, M. J. 1993, in Proc. Conf. Astrophysical Masers, Vol. 412, Lecture Notes in Physics, ed. A. W. Clegg & G. E. Nedoluha (Berlin: Springer), 225
- [2] Aguti, E. D., Lada, C. J., Bergin, E. A., et al. 2007, ApJ, 665, 457
- [3] Arce, H. G., & Goodman, A. A. 2001, ApJ, 554, 132
- [4] Beuther, H., Schilke, P., Sridharan, T. K., et al. 2002, A&A, 383, 892
- [5] Bolemhof, E. E., Reid, M. J., & Moran, J. M. 1992, ApJ, 397, 500
- [6] Chen, H.-R., Welch, W. J., Wilner, D. J., & Sutton, E. C. 2006, ApJ, 639, 975
- [7] Chira, R., Smith, R. J., Klessen, R. S., et al. 2014, MNRAS, 444, 974
- [8] Cyganowski, C. J., Brogan, C. L., Hunter, T. R., & Churchwell, E. 2009, ApJ, 702, 1615
- [9] Di Francesco, J., Myers, P. C., Wilner, D. J., et al. 2001, ApJ, 562, 770
- [10] Dreher, J.W., & Welch, W. J. 1981, ApJ, 245, 857
- [11] Garay, G., Reid, M. J., & Moran, J. M. 1985, ApJ, 289, 681
- [12] Garay, G., Mardones, D., Bronfman, L., et al. 2007, A&A, 463, 217
- [13] Fuller, G. A., Williams, S. J., & Sridharan, T. K. 2005, A&A, 442, 949
- [14] Guilloteau, S., Stier, M. T., & Downes, D. 1983, A&A, 126, 10
- [15] Hachisuka, K., Brunthaler, A., Menten, K. M., et al. 2006, ApJ, 645, 337
- [16] Hernández-Hernández, V., Zapata, L., Kurtz, S., & Garay, G. 2014, ApJ, 786, 38
- [17] Hogerheijde, M. R., & van der Tak, F. F. S. 2000, A&A, 362, 697
- [18] Jiang, Z. B., Tamura, M., Fukagawa, M., et al. 2005, Nature, 437, 112
- [19] Keto, E., Ho, P. T. P., & Reid, M. J. 1987, ApJ, 323, L117
- [20] Kawamura, J. H., & Masson, C. R. 1998, ApJ, 509, 270
- [21] Liu, T., Wu, Y. F., Wu, J. W., et al. 2013, MNRAS, 436, 1335
- [22] Liu, T., Wu, Y. F., Liu, S.-Y., et al. 2011a, ApJ, 730, 102
- [23] Liu, T., Wu, Y. F., Liu, S.-Y., et al. 2011b, ApJ, 728, 91
- [24] Liu, T., Kim, K.-T., Wu, Y. F., et al. 2015, ApJ, 810, 147
- [25] Mardones, D., Myers, P. C., Tafalla, M., & Wilner, D. J. 1997, ApJ, 489, 719
- [26] Mauersberger, R., Wilson, T. L., & Henkel, C. 1988, A&A, 201, 123
- [27] Menten, K. M., Reid, M. J., Pratap, P., & Moran, J. M. 1992, ApJ, 401, L39
- [28] Myers, P. C., Mardones, D., Tafalla, M., et al. 1996, ApJ, 465, L133
- [29] Patel, N. A., Curiel, S., Sridharan, T. K., et al. 2005, Nature, 437, 109
- [30] Pineda, J. E., Maury, A. J., Fuller, G. A., et al. 2012, A&A, 544, L7
- [31] Qin, S.-L., Schilke, P., Wu, J. W., et al. 2015, ApJ, 803, 309
- [32] Qiu, K., & Zhang, Q. 2009, ApJ, 702, L66
- [33] Reid, M. J., Haschick, A. D., Burke, B. F., et al. 1980, ApJ, 239, 89
- [34] Reid, M. J., Myers, P. C., & Bieging, J. H. 1987, ApJ, 312, 830
- [35] Reid, M. J., Argon, A. L., Masson, C. R., et al. 1995, ApJ, 443, 238
- [36] Reiter, M., Shirley, Y. L., Wu, J. W., et al. 2011, ApJ, 740, 40
- [37] Rolffs, R., Schilke, P., Comito, C., et al. 2010, A&A, 521, L46
- [38] Sánchez-Monge, Á., Cesaroni, R., Beltrán, M. T., et al. 2013a, A&A, 552, L10
- [39] Sánchez-Monge, Á., López-Sepulcre, A., Cesaroni, R., et al. 2013b, A&A, 557, 94
- [40] Sánchez-Monge, Á., Beltrán, M. T., Cesaroni, R., et al. 2014, A&A, 569, 11
- [41] Sandell, G., Goss, W. M., & Wright, M. 2005, ApJ, 621, 839
- [42] Shepherd, D. S., & Churchwell, E. 1996, ApJ, 472, 225
- [43] Shepherd, D. S., Claussen, M. J., & Kurtz, S. E. 2001, Science, 292, 1513
- [44] Shu, F. H., Adams, F. C., & Lizano, S. 1987, ARA&A, 25, 23
- [45] Smith, R. J., Shetty, R., Stutz, A. M., & Klessen, R. S. 2012, ApJ, 750, 64
- [46] Smith, R. J., Shetty, R., Beuther, H., et al. 2013, ApJ, 771, 24
- [47] Takami, M., Karr, J. L., Koh, H., et al. 2010, ApJ, 720, 155
- [48] Turner, J. L., & Welch, W. J. 1984, ApJ, 287, L81
- [49] Wilner, D. J., Welch, W. J., & Forster, J. R. 1995, ApJ, 449, L73
- [50] Wilner, D. J., Reid, M. J., & Menten, K. M. 1999, ApJ, 513, 755
- [51] Wink, J. E., Duvert, G., Guilloteau, S., et al. 1994, A&A, 281, 505
- [52] Wilson, T. L., Johnston, K. J., & Mauersberger, R. 1991, A&A, 251, 220
- [53] Wilson, T. L., Gaume, R. A., & Johnston, K. J. 1993, ApJ, 402, 230
- [54] Wu, J. W., & Evans II, N. J. 2003, ApJ, 592, L79
- [55] Wu, J. W., Evans II, N. J., Shirley, Y. L., & Knez, C. 2010, ApJS, 188, 313
- [56] Wu, Y., Wei, Y., Zhao, M., et al. 2004, A&A, 426, 503
- [57] Wu, Y., Zhu, M., Wei, Y., et al., 2005, ApJ, 628, L57
- [58] Wu, Y. F., Henke, S., Xue, R., et al. 2007, ApJ, 669, L37
- [59] Wu, Y. F., Qin, S.-L., Guan, X., et al. 2009, ApJ, 697, L116
- [60] Wyrowski, F., Schilke, P., Walmsley, C. M., & Menten, K. M. 1999, ApJ, 514, L43
- [61] Zapata, L. A., Palau, A., Ho, P. T. P., et al. 2008, A&A, 479, L25
- [62] Zapata, L. A., Rodríguez-Garza, C., Rodríguez, L.F., et al. 2011, ApJ, 740, L19
- [63] Zhang, Q., Hunter, T. R., Sridharan, T. K. 1998, ApJ, 505, L151
- [64] Zhang, Q., Hunter, T. R., Brand, J., et al. 2005, ApJ, 625, 864
- [65] Zinnecker, H., & Yorke, H. W. 2007, ARA&A, 45, 481
Appendix: Two-layer model
The two-layer model (Myers et al. 1996; Di Francesco et al. 2001) is aimed at fitting the observed spectrum by setting the radiation temperatures of the continuum source , the excitation temperature of the ”rear” and ”front” layers and , the cosmic background radiation , the beam filling factor , the systemic velocity , the kinematic velocity , the velocity dispersion and the peak optical depth . The predicted line brightness temperature at velocity is given by
| (1) |
where
| (2) |
| (3) |
| (4) |
and the radiation temperature is expressed as .
In this model the kinematic velocity is given by
| (5) |
where is the brightness temperature of absorption dip, and and are the intensity of the blue and red peaks above the dip, respectively. Positive corresponds to gas infalling onto the continuum core, while negative indicates gas expansion (e. g., Myers et al. 1996; Aguti et al. 2007).
We applied the ‘lsqcurvefit’ method in matlab to fit the spectrum. We fitted the HCO+ spectra first by setting all the parameters free. The line profile is mainly determined by , and , while the intensity of the two peaks is mainly determined by , , , and . In the model, we set the ranges for from 0.1 to 10, for the filling factor from 0 to 1, , and from 10 to 100 K, from 50 to 43 km s-1, from 0.1 to 3 km s-1, from 0.1 to 6 km s-1. For each set of initial values, ‘lsqcurvefit’ will be converged to a solution and try to give the best estimated values. We find that , , , and are very sensitive to initial values and cannot be determined accurately due to degeneracy. Contrary to that, , and are much less sensitive to the initial input values. When we change the initial values, the output for , and only varies by less than 10%. Thus, the error of the inferred infall speed is expected to be smaller than 10%.