The young nuclear stellar disc in the SB0 galaxy NGC 1023
Abstract
Small kinematically decoupled stellar discs with scalelengths of a few tens of parsec are known to reside in the centre of galaxies. Different mechanisms have been proposed to explain how they form, including gas dissipation and merging of globular clusters. Using archival Hubble Space Telescope imaging and ground-based integral-field spectroscopy, we investigated the structure and stellar populations of the nuclear stellar disc hosted in the interacting SB0 galaxy NGC 1023. The stars of the nuclear disc are remarkably younger and more metal rich with respect to the host bulge. These findings support a scenario in which the nuclear disc is the end result of star formation in metal enriched gas piled up in the galaxy centre. The gas can be of either internal or external origin, i.e. from either the main disc of NGC 1023 or the nearby satellite galaxy NGC 1023A. The dissipationless formation of the nuclear disc from already formed stars, through the migration and accretion of star clusters into the galactic centre, is rejected.
keywords:
galaxies: elliptical and lenticular, cD – galaxies: evolution – galaxies: formation – galaxies: nuclei – galaxies: photometry – galaxies: structure1 Introduction
Small discs of stars with scalelengths of a few tens of parsecs and luminosities up to are known to reside in the nuclei of galaxies (Pizzella et al., 2002; Ledo et al., 2010).
Different mechanisms have been proposed to explain how nuclear stellar discs (NSDs) assembled. Most of them are believed to be formed from gas funnelled into the nucleus, either via bar-driven secular infall (Sil’chenko, 1997; Scorza & van den Bosch, 1998; Krajnović & Jaffe, 2004) or by external accretion (Pizzella et al., 2002; Morelli et al., 2004; Corsini et al., 2012). In both scenarios, the gas is efficiently driven toward the galactic centre, where first it settles as it dissipates and then it turns into stars as density rises. Ionized gas and dust are actually observed in a few nuclear discs (Kormendy et al., 1994, 2005).
This picture has been recently challenged by the simulations analysed by Portaluri et al. (2013). They found that most of the mass of NSDs can be assembled from already formed stars through the migration and accretion of star clusters into the galactic centre. However, some gas is needed in the very early stages of the formation of the flattened NSD. Moreover, the subsequent dissipationless building of the NSD works only for a very narrow range of initial conditions.
In this context, NSDs could be a powerful tool to constrain the assembly history of galaxies. This is because recent numerical simulations have shown that NSDs are indeed fragile structures that are easily disrupted during a major merger event (Sarzi, Ledo, & Dotti, 2015). Therefore, the stellar age of NSDs may be adopted as a proxy to date the epoch since their host galaxies experienced the last major merging.
To date, the properties of the stellar populations (i.e. age, metallicity, and star formation time scale) in the nuclear regions of a number of galaxies hosting an NSD have been studied in some detail using colour-colour diagrams (van den Bosch et al., 1998), line-strength indices (Sil’chenko, 1999; Morelli et al., 2004; Krajnović & Jaffe, 2004), and population synthesis models (Sarzi et al., 2005). However, all these results concern the total stellar population of the galactic nucleus without properly separating the contribution of the NSD from that of the host galaxy. The only exception is the elliptical galaxy NGC 4458, where Sarzi et al. (2016) found that the NSD is at least 6 Gyr old. To precisely constrain the stellar population of an NSD it is indeed necessary to perform a detailed measurement of its light distribution. This is quite challenging since the luminosity of NSDs is only a few per cent of that of the galactic nucleus and locally NSDs contribute at most half of the total surface brightness (Pizzella et al., 2002; Morelli et al., 2004, 2010; Corsini et al., 2012).
These findings call for a systematic investigation of the NSD stellar ages in galaxies of different mass and across different environments in order to time their assembly. This will allow to test some of the predictions for the accretion phase in the two-phase galaxy formation scenario (e.g. Naab et al., 2007; Oser et al., 2010; Lackner et al., 2012). For instance, older NSDs are expected to reside in less massive cluster galaxies. Indeed, they should have assembled earlier and have experienced less merging events, capable to destroy the nuclear disc, than their counterparts in the field.
In this paper, we revisit the case of NGC 1023 since it represents an excellent test case to derive the properties of the NSD stellar population. NGC 1023 is a highly-inclined disc galaxy classified as SB01(5) by Sandage & Tammann (1981) and SB0-(rs) by de Vaucouleurs et al. (1991, hereafter RC3). Its total -band magnitude is (RC3), which, after correcting for inclination and extinction, corresponds to for an adopted distance of Mpc (Faber et al., 1997, km s Mpc-1). NGC 1023 is the brightest member of the LGG 70 group (Garcia, 1993). Its closest companion, NGC 1023A, is a Magellanic irregular dwarf galaxy of low surface brightness (Sandage & Bedke, 1994), located about (RC3) East of NGC 1023 centre. This corresponds to a projected linear distance of about kpc. The two galaxies are connected by a bridge of neutral hydrogen which suggests an on-going interaction (Sancisi et al., 1984). The global properties and spectral energy distribution of NGC 1023 are suggestive of a minor merger occurred Gyr ago (Bettoni et al., 2012). The broad-band images of the centre of NGC 1023 obtained by Hubble Space Telescope (HST) show an almost edge-on NSD (Faber et al., 1997; Sil’chenko, 1999; Sarzi et al., 2006; Ledo et al., 2010). The stellar dynamics confirms the presence of a nuclear flattened component, as it results from the tangentially anisotropic distribution of the innermost stellar orbits (Bower et al., 2001). Finally, the stellar population of the nucleus shows significantly different chemical properties from the rest of the galaxy. In particular, the nucleus is younger, more metal rich, and it shows higher magnesium overabundance than the surrounding bulge (Sil’chenko, 1999; McDermid et al., 2006).
Here, we improve the previous results by quantitatively constraining the light distribution, stellar age, and iron abundance of the NSD of NGC 1023. The photometric decomposition of archival multiband optical images of the galaxy nucleus obtained with HST allows us to get the basic structural parameters of the NSD (central surface brightness, scalelength radius, inclination, and major-axis position angle) in Section 2. The contribution of the NSD to the total surface-brightness distribution is adopted in Section 3 in combination with stellar population models to derive at last the actual properties of the stellar population (age and iron abundance) of the NSD and its host bulge from the line-strength indices measured in the galaxy nucleus. Our findings about the formation process of the NSD are discussed in Section 4.
2 Photometric properties of the nuclear disc
2.1 Broad-band imaging
We retrieved from the HST Science Data Archive the images of NGC 1023 obtained with the Advanced Camera for Survey (ACS) and filter F475W (Prop. Id. 12202, PI: G. Sivakoff) and with the Wide Field Planetary Camera 2 (WFPC2) and filters F555W and F814W (Prop. Id. 6099, PI: S. M. Faber). These three data sets were selected as a compromise to analyse the deepest and unsaturated broad-band images of the galaxy nucleus obtained at the highest spatial resolution.
The ACS images were taken with the Wide Field Channel (WFC), which consists of two SITe CCDs with pixels each of size m2. The image scale is arcsec pixel-1 and the field of view of the combined detectors covers an approximately square area of about arcsec2. The gain and readout noise of the four WFC amplifiers are about 2.0 count-1 and 4.2 (rms), respectively. All the WFPC2 exposures were taken by centring the galaxy nucleus on the Planetary Camera (PC). The PC detector is a Loral CCD with pixels and a pixel size of m2. The image scale of 0.046 arcsec pixel-1 yields a field of view of about arcsec2. The gain and readout noise are 14.0 count-1 and 7.0 (rms), respectively. To help in identifying and correcting cosmic ray events, different exposures were taken with each filter. The total exposure time was 1552 s for the F475W filter, 1620 s for the F555W filter, and 1880 s for the F814W filter. For both ACS and WFPC2 images the telescope was always guided in fine lock, giving a typical rms tracking error per exposure of 0.005 arcsec.
The ACS images were calibrated using the calacs reduction pipeline in iraf111The Imaging Reduction and Analysis Facility (iraf) is distributed by the National Optical Astronomy Observatory, which is operated by the Association of Universities for Research in Astronomy (AURA), Inc., under cooperative agreement with the National Science Foundation.. Reduction steps include bias subtraction, dark current subtraction, flat-fielding correction, and correction for geometric distortion with iraf task multidrizzle (Fruchter et al., 2009) as described in detail in ACS instrument and data handbooks (Pavlovsky et al., 2004, 2006). The images were aligned by comparing the centroids of stars in the field of view and then combined, rejecting cosmic rays in the process. Residual cosmic ray events and hot pixels were removed using the lacos_ima procedure (van Dokkum, 2001). The sky level was determined from regions free of sources at the edge of the field of view and then subtracted. The WFPC2 images were reduced using the calwfpc reduction pipeline in iraf. Reduction steps include bias subtraction, dark current subtraction, and flat-fielding, as described in detail in the WFPC2 instrument and data handbooks (Baggett et al., 2002; McMaster et al., 2008). Subsequent analysis including alignment and combination of images and rejection of cosmic rays was performed using multidrizzle and lacos_ima. The sky level was determined from regions free of sources in the Wide Field (WF) chips and subtracted from the combined PC frames after appropriate scaling.
The ACS/F475W, WFPC2/F555W, and WFPC2/F814W passbands are similar to Johnson-Cousins , , and bands, respectively. The flux calibration to the Vega magnitude system in the three observed HST passbands was performed following Holtzman et al. (1995), Sirianni et al. (2005), and Bohlin (2012), and included aperture and gain corrections.
2.2 Photometric model
The surface-brightness distribution of the NSD of NGC 1023 was independently derived in the different passbands using the method of Scorza & Bender (1995) as implemented by Morelli et al. (2004). But, we adopted a different best-fitting algorithm to perform the photometric decomposition and followed the prescriptions of Morelli et al. (2010) and Corsini et al. (2012) for the treatment of the isophotal shape of the bulge and to account for the point-spread function (PSF), respectively. The photometric decomposition is based on the assumption that the isophotal disciness, quantified by the positive value of the fourth cosine Fourier coefficient (Jedrzejewski, 1987; Bender, Doebereiner, & Moellenhoff, 1988), is the result of the superimposition of the light contribution of a rounder host bulge and a more elongated nuclear disc. We assumed that the nuclear disc has perfectly elliptical isophotes () with constant ellipticity, , and constant position angle, PANSD, whereas the bulge has elliptical isophotes with constant , constant ellipticity , and constant position angle PAbulge. Moreover, the bulge isophotes can be either perfectly elliptical () or be characterised by a constant discy () or boxy shape ().
Let be the Cartesian coordinates in sky plane with the origin in the galaxy centre, the -axis parallel to the direction of right ascension and pointing westward, the -axis parallel to the direction of declination and pointing northward. We assumed the surface brightness of the NSD to follow the exponential law (Freeman, 1970) and have elliptical isophotes centred on with constant PANSD and constant where is the isophotal minor-to-major axis ratio. We considered the disc to be infinitesimally thin and derived its inclination as . The disc surface-brightness distribution is given by:
| (1) |
where and are the central surface brightness and scalelength of the disc, respectively, and is:
| (2) | |||||
where and .
The isophote fitting with ellipses was carried out on the galaxy image using the iraf task ellipse (Jedrzejewski, 1987). First, isophotes were fitted by ellipses allowing their centres to vary. Within the errors, no variation in the ellipse centres was found. Therefore, we assumed the disc centre to be coincident with the galaxy centre. The final ellipse fits were done at fixed ellipse centres out to a distance of 3.6 arcsec. The ellipse-averaged profiles of the surface brightness, position angle, ellipticity, and fourth cosine Fourier coefficient are plotted in Fig. 1.
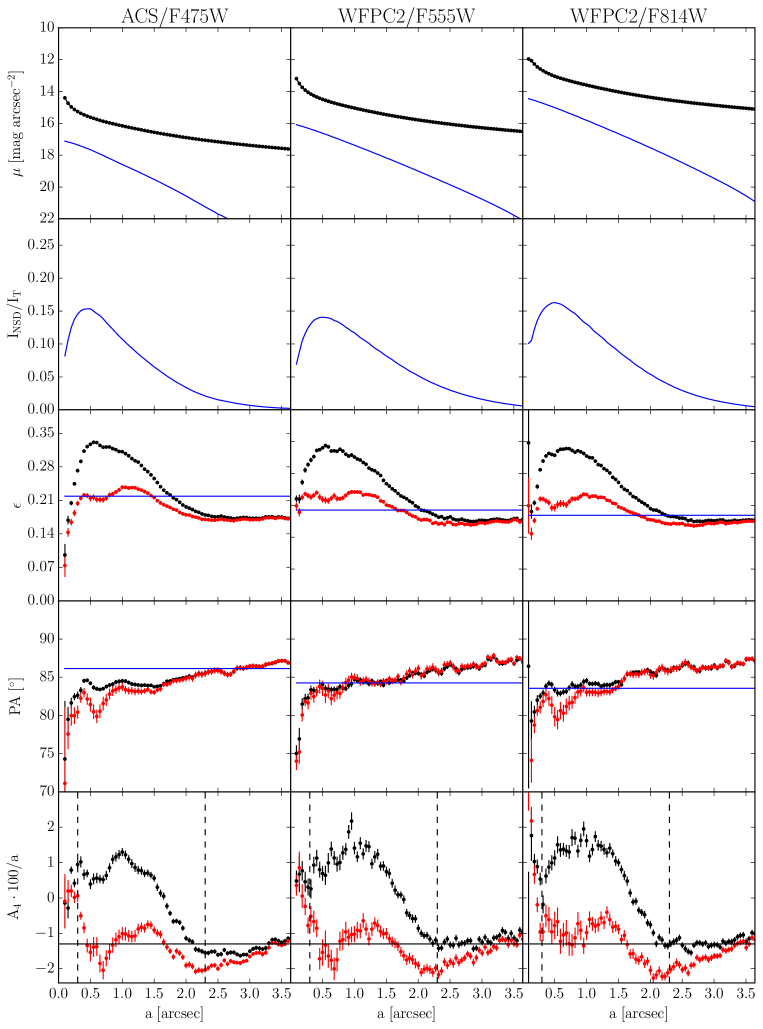
We derived the photometric parameters of the nuclear disc (, , , and PANSD) by iterative subtraction of the model surface brightness given by Eq. 1 from the observed surface-brightness distribution of the galaxy. For each nuclear disc model, the disc-free image of the galaxy was obtained from the galaxy image by subtracting the nuclear disc model after convolving with the HST PSF. The adopted PSF model was calculated with the tinytim package (Krist & Hook, 1999) taking into account the instrumental set-up and position of the NSD on the given image.
Then, we performed an isophotal analysis of the disc-free image using ellipse. The nuclear disc parameters were adjusted until the isophotes in the disc-free image have out to the very centre. For the bulge of NGC 1023, we derived the mean between 2.3 and 3.3 arcsec outside the region where the inner peak of is observed. The mean values measured in the different passbands are consistent within the errors. Therefore, we calculated as the mean and standard deviation of the mean of all the available values between 2.3 and 3.3 arcsec, respectively. We did no assumption for the radial profiles of surface brightness, ellipticity, and position angle of the bulge which is triaxial (Sil’chenko, 2005). We calculated:
| (3) |
where is the value of the Fourier coefficient measured for the -th isophote in the disc-free image and is the number of fitted isophotes in the region of the NSD. This is the radial range between 0.3 and 2.3 arcsec, which is bracketed by two vertical lines in Fig. 1. We assumed as the mean error on the values of in the NSD region of the best-fitting disc-free image. It is , and for the ACS/F475W, WFPC2/F555W, and WFPC2/F814W images, respectively. The disc models resulting in were rejected to avoid unrealistic solutions.
| Filter | PANSD | ||||
|---|---|---|---|---|---|
| [mag arcsec-2] | [pc] | [∘] | [∘] | [] | |
| (1) | (2) | (3) | (4) | (5) | (6) |
| ACS/F475W | |||||
| WFPC2/F555W | |||||
| WFPC2/F814W |
Note. Column (1): passband. Column (2): observed central surface brightness. Column (3): scalelength. Column (4): inclination derived as . Column (5): major-axis position angle. Column (6): total luminosity derived as .
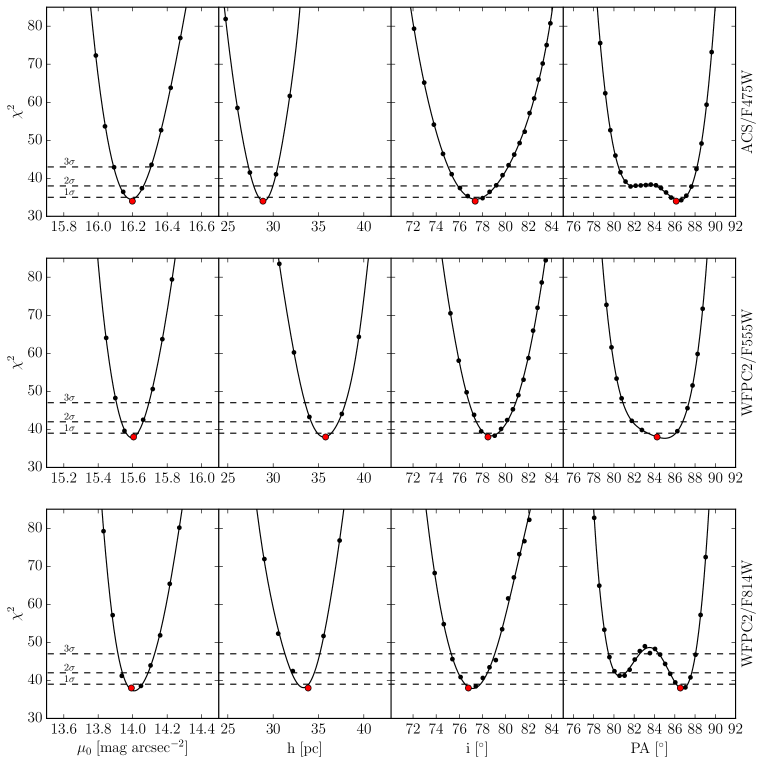
We explored the parameter space in a twofold process by running a pyraf222pyraf is a product of the Science Software Branch at the Space Telescope Science Institute. code. First, we built a set of NSD models covering the central surface brightnesses mag arcsec-2, mag arcsec-2, mag arcsec-2, scalelengths pc, axial ratios , and position angles . The model corresponding to the minimum value of was adopted as the starting guess for a further minimization based on the downhill simplex method (Nelder & Mead, 1965). The resulting minimum, , corresponds to the best-fitting model of the nuclear disc.
We determined and derived its confidence levels under the assumption that the errors are normally distributed and after rescaling to be equal to the number of degrees of freedom. It is , where is the number of fitted isophotes in the NSD region. The best-fitting values and confidence levels of , , , and PANSD alone, marginalizing over all other parameters, are shown in Fig. 2. The photometric parameters of the NSD and their errors are listed in Table 1. The comparison between the isophotal parameters of NGC 1023 measured before and after the subtraction of the best-fitting model of the NSD is shown in Fig. 1.
| Id. No. | Radius | []′ | [FeH] | |||
|---|---|---|---|---|---|---|
| [arcsec] | [Å] | [Å] | [Gyr] | [dex] | ||
| (1) | (2) | (3) | (4) | (5) | (6) | (7) |
| 1 | 0.00-0.65 | 0.06 | ||||
| 2 | 0.65-1.95 | 0.03 | ||||
| 3 | 1.95-3.25 | 0.00 | ||||
| 4 | 3.25-4.55 | 0.00 | ||||
| 5 | 4.55-5.85 | 0.00 | ||||
| 6 | 5.85-7.15 | … | … | 0.00 | ||
| 7 | 7.15-8.45 | 0.00 |
Note. Column (1): identification number of the concentric circular ring. Column (2): minimum and maximum radius of the concentric circular ring. Columns (3)-(4): equivalent widths of the line-strength indices measured in the concentric ring. The values of are directly from Sil’chenko (1999), while the values of []′ are calculated from the data of Sil’chenko (1999). Columns (5)-(6): age and iron abundance of the total stellar population based on the SSP models of Worthey (1994). Column (7): NSD-to-total luminosity ratio within the ring in the WFPC2/F555W passband.
The location and orientation of the NSD (i.e. position of the centre, inclination, and position angle) are the same in all the available images. But, the NSD appears more concentrated in the bluer image, given that the value for the scalelength obtained with the ACS/F475W image is inconsistent with those found for the WFPC2/F555W and F814W images even when considering 3 errors. This also implies the presence of colour gradients in the NSD, an important constraint on the star formation process (Morelli et al., 2010). The mean values of the NSD parameters are pc, , and . The size and luminosity of the NSD of NGC 1023 are consistent with those of the other NSDs detected so far (see Ledo et al., 2010, for a census).
3 Stellar population properties of the nuclear disc
3.1 Integral-field spectroscopy
The integral-field spectroscopic observations of the nucleus of NGC 1023 were carried out with the 6 m telescope of the Special Astrophysical Observatory by Sil’chenko (1999). The Multi-Pupil Field Spectrograph (MPFS) mapped a field of view of arcsec2 at with spectra. The spectral range between 4600 and 5450 Å was covered with an instrumental resolution of 5 Å (FWHM) corresponding to km s-1 at . The exposure time on the galaxy was 3600 s with an average seeing arcsec. Further details about the observations and data reduction are given in Sil’chenko (1999).
The resulting spectra were summed to obtain azimuthally averaged spectra within concentric circular rings centred onto the galaxy nucleus (Table 2). This allowed to increase the signal-to-noise ratio and derive more precise values for the Mg, Fe5270, Fe5335, and Lick/IDS line-strength indices, as defined by Worthey et al. (1994). The mean accuracy of the line-strength indices measured in the azimuthally averaged spectra is 0.10 Å (Sil’chenko, 1999).
We extracted the values of the Mg, Fe5270, , and indices from figs. 4a and 5a in Sil’chenko (1999). Then, we calculated the values of the Fe5335 index and derived the magnesium-iron index, []′ as defined by Thomas, Maraston, & Bender (2003). The equivalent widths of the and []′ line-strength indices measured in the azimuthally averaged spectra and their errors are listed in Table 2. The measurements by Sil’chenko (1999) are in agreement with those by Kuntschner et al. (2006), which are corrected for emission-line infill and based on integral-field spectroscopic data obtained with the Spectroscopic Areal Unit for Research of Optical Nebulae (SAURON). As a matter of fact, no significant emission is detected within 2 arcsec from the centre, whereas it is very weak and patchy within 9 arcsec (Sarzi et al., 2006).
3.2 Stellar population analysis
3.2.1 Age and iron abundance of the total stellar population
We derived the radial trend of the properties of the total stellar population using the evolutionary population models by Worthey (1994), which provide the values of the equivalent widths of the Lick/IDS line-strength indices for a single stellar population (SSP) of arbitrary age and iron abundance [FeH], given a specific initial mass function333Model outputs also include magnitudes, colours, mass-to-light ratios, and spectral energy distribution of the SSPs and are available at http://astro.wsu.edu/dial/dial_a_model.html.. The models cover the ages Gyr and iron abundances dex, except for Gyr and dex. We adopted the Salpeter (1955) initial mass function for our analysis.
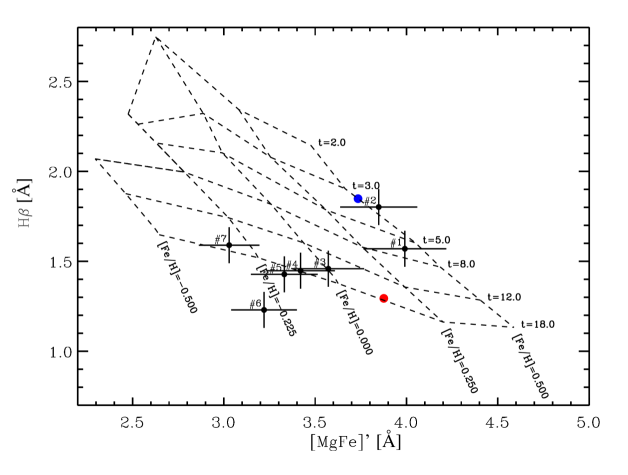
Among the measured line-strength indices, we considered and []′. The former is sensitive to warm turn-off stars and, thus, it is an useful age indicator. The latter provides an estimation of the total metal abundance, almost independently of the [] ratio between the and iron-peak elements (Thomas, Maraston, & Bender, 2003). The equivalent widths of and []′ measured in the azimuthally averaged spectra of NGC 1023 are compared with the model predictions in Fig. 3. In order to derive the parameter pairs from the measured values (, []′), we linearly interpolated between the points of the model grid. We excluded the ring arcsec from the analysis because its values of and []′ are not consistent with the model predictions of age and iron abundance. The stellar-population age and iron abundance we calculated for the remaining concentric rings centred on the nucleus of NGC 1023 are given in Table 2. They are consistent with the results by McDermid et al. (2006) and Kuntschner et al. (2010).
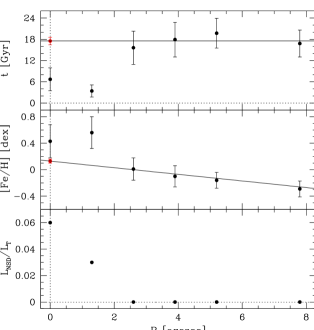
The radial profiles of stellar age and iron abundance observed in Fig. 3 and tabulated in Table 2 are plotted in Fig. 4. The inner regions of NGC 1023 ( arcsec) are younger ( Gyr) and more metal rich ([FeH] dex) than the outer regions ( arcsec). In fact, at these larger radii we measured old ages ( Gyr) and a decrease of iron abundance. It ranges from [FeH] dex to dex with increasing radius. These are recurrent trends for the stellar populations of S0 bulges (e.g. Sánchez-Blázquez, Gorgas, & Cardiel, 2006; Morelli et al., 2008; Kuntschner et al., 2010).
3.2.2 Age and iron abundance of the bulge and nuclear disc
The age and iron abundance variations of the total stellar population in the centre of NGC 1023 (Fig. 4) can be explained with the result of the superposition of two stellar populations with different properties (i.e. the bulge and NSD stellar populations).
To constrain the age and iron abundance of the bulge and NSD, we derived their light contribution to the total luminosity of the galaxy in the concentric circular rings listed in Table 2. We analysed the WFPC2/F555W and disc model images after convolving with a Gaussian PSF with arcsec to match the spectroscopic observations. The WFPC2/F555W passband was chosen to cover more suitably the measured line-strength indices. We found that the NSD contributes 6 and 3 per cent of the total luminosity in the two innermost apertures ( arcsec), whereas the bulge contributes all the galaxy light in the remaining outer rings ( arcsec, Table 2). We did not take into account the light contribution of the main stellar disc, because it becomes significant only at much larger radii ( arcsec; Debattista, Corsini, & Aguerri, 2002; Noordermeer et al., 2008) than those we considered.
Since for arcsec, we extrapolated at arcsec the values of age and iron abundance derived for the outer rings in order to have the best possible model of the stellar population of the bulge in the innermost circular aperture. We assumed the bulge age and its associated 1 uncertainty to be equal to the mean age and standard deviation of the mean in the outer rings, respectively. We found Gyr (Fig. 4). We linearly interpolated the iron abundances in the outer rings to estimate the iron abundance of the bulge and its 1 uncertainty as the central iron abundance and its standard deviation, respectively. To this aim, we rescaled the uncertainties on iron abundance to have value equal to the number of degrees of freedom for the best-fitting straight line. We obtained [FeH] dex (Fig. 4).
We exploited the inferred constraints on the NSD and bulge light fractions and on the bulge stellar population in the innermost circular aperture in order to look for the optimal combination of SSP models of Worthey (1994) for bulge and NSD matching the measured and []′ line-strength indices.
We calculated the total equivalent width of the line-strength index (i.e. , Mg, Fe5270, and Fe5335) of the composite stellar population of bulge and NSD as
| (4) |
where and Å are the widths of the line band for , Mg, Fe5270, and Fe5335, respectively. The total continuum and line fluxes of the line-strength index of the composite stellar population were derived as
| (5) | |||||
and
| (6) | |||||
respectively. The mass-weighted line and continuum fluxes of the line-strength index, and , and the mass-to-light ratio, , of the SSPs of bulge and NSD as a function of age and iron abundance were taken from the same models of Worthey (1994) used in Section 3.2.1. In addition, we adopted the weights and to account for the light contribution of the two components in the innermost circular aperture of NGC 1023. This allowed us to derive the equivalent widths of and []′ for any composite stellar population of bulge and NSD as soon as we defined their ages and , and iron abundances and .
We determined the best-fitting age and iron abundance for bulge and NSD in two different ways by minimizing the function defined as
| (7) |
where and are the errors on the equivalent widths of and []′ measured in the innermost circular aperture.
In the first approach, we performed a constrained fit by adopting for the bulge Gyr and [FeH] dex. We looked for the NSD properties on a fine grid in age from 2 to 6 Gyr (on steps of 0.2 Gyr) and iron abundance from 0.12 to 0.50 dex (on steps of 0.02 dex) obtained by linearly interpolating the models of Worthey (1994). We found that the best-fitting model of NSD stellar population has Gyr and [FeH] dex (Fig. 5).
In the second approach, as a consistency check, we performed an unconstrained fit by allowing for the bulge age to vary between 16.4 and 18.0 Gyr (on steps of 0.2 Gyr) and bulge iron abundance to vary between 0.10 and 0.16 dex (on steps of 0.02 dex) to account for the adopted uncertainties on the bulge properties. For the NSD, we explored the same ranges of age and iron abundance as for the constrained fit. The resulting best-fitting model requires a bulge with Gyr and [FeH] dex and an NSD with Gyr and [FeH] dex (Fig. 5).
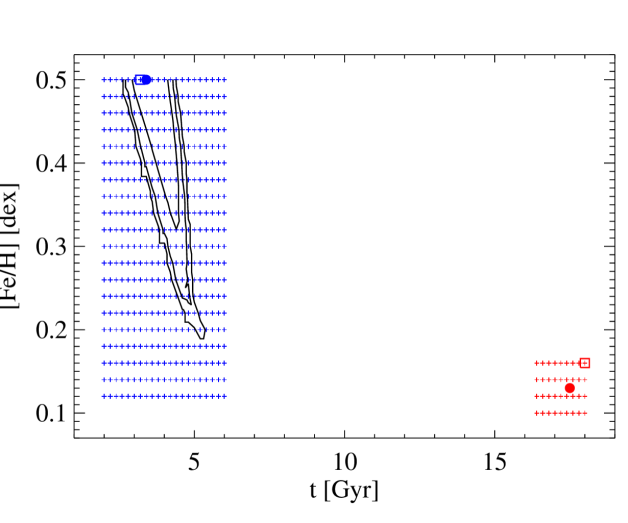
In both cases, we conclude that the NSD of NGC 1023 is much younger and more metal rich than the host bulge. The age of the NSD is well constrained, whereas the its iron abundance corresponds to the upper limit of the [FeH] range of the available SSP models. Without the knowledge of the light fraction of NSD, the age and metallicity of the NSD can be hardly recovered due to the degeneracy between these two parameters (see Sarzi et al., 2016, for a discussion).
4 Discussion and conclusions
The structure and properties of the stellar population of the nuclear region of the interacting SB0 galaxy NGC 1023 were investigated through a detailed analysis of archival HST imaging and ground-based integral-field spectroscopy. The galaxy is known to host a highly-inclined NSD (Faber et al., 1997; Sil’chenko, 1999; Sarzi et al., 2006; Ledo et al., 2010). Moreover, the stars of the galaxy nucleus have significantly different chemical properties with respect to the surrounding bulge. They are younger, more metal rich, and have a higher magnesium overabundance (Sil’chenko, 1999; McDermid et al., 2006; Kuntschner et al., 2010).
In this paper, we derived the central surface brightness, scalelength, inclination, and position angle of the NSD of NGC 1023 in all the available broad band HST images by assuming that it is an infinitesimally thin exponential disc. We applied the photometric decomposition method of Scorza & Bender (1995) and adopted the algorithm by Morelli et al. (2004, 2010), which we implemented for a better determination of the best-fitting parameters. The location and orientation of the NSD do not depend on the observed passband, as already observed for the few other NSDs for which a detailed multiband photometric analysis was performed (Krajnović & Jaffe, 2004; Morelli et al., 2010; Corsini et al., 2012) whereas the NSD appears more concentrated in the bluer image. We measured the light contribution of the NSD to the total luminosity of the galaxy in the same concentric circular rings centred on the galaxy nucleus where the equivalent widths of the Lick/IDS line-strength indices were obtained from ground-based integral-field spectroscopy by Sil’chenko (1999). In the WFPC2/F555W passband the NSD contributes a maximum of 6 per cent of the total luminosity within the innermost circular aperture ( arcsec), whereas all the galaxy light is given by the bulge in the outer rings ( arcsec).
The ratio was used in combination with the SSP models by Worthey (1994) to derive the properties of the stellar population of the NSD by matching the measured and []′ line-strength indices. For the host bulge we assumed an old stellar population ( Gyr) with super-solar iron abundance ([FeH] dex) to be consistent with the constant age and gradient of iron abundance which we measured in the outer rings where the light contribution of the NSD is null. We found that the nuclear disc of NGC 1023 is much younger ( Gyr) and more metal rich ([FeH] dex) than the host bulge.
These new results about NGC 1023 give us the opportunity to gain a further insight on the formation of NSDs and their host galaxies. Indeed, the only other NSD, whose stellar population was disentangled from that of its host galaxy is that in NGC 4458 (Sarzi et al., 2016). NGC 4458 is an intermediate-mass elliptical in the Virgo cluster. Its NSD is older than 6 Gyr, implying that the galaxy did not experience a disruptive event since . Therefore, NGC 4458 assembled most of its mass long time ago, consistently with the picture where smaller galaxies formed earlier and high-density environments reduce the incidence of mergers. On the contrary, the properties of the stellar populations of the other NSDs studied so far were derived by assuming a negligible contamination of the host galaxy to the colours and line-strength indices measured in nucleus. According to this assumption, some NSDs are found to be as old as the host galaxy (NGC 4128, Krajnović & Jaffe 2004; NGC 4342, van den Bosch et al. 1998; NGC 4458, Morelli et al. 2004; NGC 4621, Krajnović & Jaffe 2004; NGC 4698, Corsini et al. 2012). The NSD of NGC 4570 shows the same intermediate age, but it is more metal rich than the galaxy bulge (Krajnović & Jaffe, 2004). In NGC 4478 the NSD is younger, more metal rich, and it has a lower magnesium overabundance than the main body of the galaxy (Morelli et al., 2004). In contrast, the NSD of NGC 5308 is made of a younger and more metal-poor stellar population than the host galaxy (Krajnović & Jaffe, 2004). Finally, a few cases are characterised by on-going star formation (NGC 5845, Kormendy et al. 1994; NGC 4486A, Kormendy et al. 2005).
As far as NGC 1023 concerns, the younger age of its NSD excludes a scenario in which it assembled from already formed stars, accreted from star clusters that migrated from the much older bulge (e.g. Antonini et al., 2012; Portaluri et al., 2013). This points toward a dissipational process and in-situ star formation of gas funnelled into the galaxy centre. The stars of the NSD have super-solar iron abundance. Therefore, we argue they formed from processed gas, which can be of either internal or external origin. The main disc of NGC 1023 and interacting satellite NGC 1023A are both a possible reservoir of processed gas. The mild kinematic misalignment between stars and ionized gas measured in the velocity fields provided by SAURON is suggestive of a gradual change of the gas angular momentum as a function of radius (Sarzi et al., 2006). This could be interpreted as the result of the on-going interaction suffered by NGC 1023 and unveiled by the complex distribution of the neutral hydrogen. Processed gas could have been also accreted by NGC 1023 during the merger with a small companion which occurred Gyr ago, according to the results of the smooth particle hydrodynamical simulations performed by Bettoni et al. (2012). However, NGC 1023 has a bar which may have efficiently driven the gas to the galaxy centre, where it settled into a nuclear disc and fuelled star formation. Such a mechanism has been recently investigated by Cole et al. (2014) studying the bar-induced gas inflows in a disc galaxy using a smooth particle hydrodynamical simulation at high resolution. The simulation confirms that gas dissipation is a key ingredient for forming a thin, kinematically cool, young, and metal-rich structure within the central 500 pc of a galaxy. Assessing the properties of the stellar populations in the main disc of NGC 1023 and measuring the metallicity of the gas in the stream arising from the on-going merger between NGC 1023 and NGC 1023A will allow a direct test of any role they may have played in the formation of the NSD.
In this respect, our understanding of NSDs would benefit from an integral-field spectroscopic follow up of a representative sample of NSD galaxies. The optimized extraction of the spectrum of the host spheroid in combination with the analysis of spectra obtained in carefully selected regions, where the light contribution of the NSD is maximal, will give tighter constraints on the disc stellar population and unveil whether NGC 1023 and NGC 4458 are harbouring typical or peculiar NSDs.
Acknowledgments
We thank the anonymous referee for the valuable suggestions that improved this manuscript. We are especially grateful to Lodovico Coccato, Marc Sarzi, and Olga Sil’chenko for insightful discussions on the properties of nuclear stellar discs and to Claudia Maraston, Alexadre Vazdekis, and Guy Worthey for very helpful comments on the stellar population analysis. This work is supported by Padua University through grants 60A02-5857/13, 60A02-5833/14, 60A02-4434/15, and CPDA133894. L.M. acknowledges financial support from Padua University grant CPS0204. E.P. is partially supported by Fondazione Angelo Della Riccia and acknowledges the Jeremiah Horrocks Institute of the University of Central Lancashire for the hospitality while this paper was in progress.
References
- Antonini et al. (2012) Antonini F., Capuzzo-Dolcetta R., Mastrobuono-Battisti A., Merritt D., 2012, ApJ, 750, 111
- Bender, Doebereiner, & Moellenhoff (1988) Bender R., Doebereiner S., Moellenhoff C., 1988, A&AS, 74, 385
- Baggett et al. (2002) Baggett S., et al., 2002, WFPC2 Data Handbook, Version 4.0, STScI, Baltimore
- Bettoni et al. (2012) Bettoni D., Buson L., Mazzei P., Galletta G., 2012, MNRAS, 423, 2957
- Bohlin (2012) Bohlin R. C., 2012, Instrument Science Report ACS 2012-01, STScI, Baltimore
- Bower et al. (2001) Bower G. A., et al., 2001, ApJ, 550, 75
- Cole et al. (2014) Cole D. R., Debattista V. P., Erwin P., Earp S. W. F., Roškar R., 2014, MNRAS, 445, 3352
- Corsini et al. (2012) Corsini E. M., Méndez-Abreu J., Pastorello N., Dalla Bontà E., Morelli L., Beifiori A., Pizzella A., Bertola F., 2012, MNRAS, 423, L79
- Debattista, Corsini, & Aguerri (2002) Debattista V. P., Corsini E. M., Aguerri J. A. L., 2002, MNRAS, 332, 65
- de Vaucouleurs et al. (1991) de Vaucouleurs G., de Vaucouleurs A., Corwin H. G., Buta R. J., Paturel G., Fouquè P., 1991, Third Reference Catalogue of Bright Galaxies. Springer-Verlag, New York (RC3)
- Faber et al. (1997) Faber S. M., et al., 1997, AJ, 114, 1771
- Freeman (1970) Freeman, K. C., 1970, ApJ, 160, 811
- Fruchter et al. (2009) Fruchter A., Sosey M., Hack W., Dressel L., Koekemoer A. M., Mack J., Mutchler M., Pirzkal N., 2009, The MultiDrizzle Handbook, Version 3.0, STScI, Baltimore
- Garcia (1993) Garcia A. M. 1993, A&AS, 100, 47
- Holtzman et al. (1995) Holtzman J. A., et al., 1995, PASP, 107, 156
- Jedrzejewski (1987) Jedrzejewski R. I., 1987, MNRAS, 226, 747
- Kormendy et al. (1994) Kormendy J., Dressler A., Byun Y. I., Faber S. M., Grillmair C., Lauer T. R., Richstone D., Tremaine S., 1994, in Meylan G., Prugniel P., eds, Proc. ESO/OHP Workshop, Dwarf galaxies. ESO, Garching, p. 147
- Kormendy et al. (2005) Kormendy J., Gebhardt K., Fisher D. B., Drory N., Macchetto F. D., Sparks W. B., 2005, AJ, 129, 2636
- Krajnović & Jaffe (2004) Krajnović D., Jaffe W., 2004, A&A, 428, 877
- Krist & Hook (1999) Krist J., Hook R., 1999, STIS Instrument Handbook, Version 4.0, STScI, Baltimore
- Kuntschner et al. (2006) Kuntschner H., et al., 2006, MNRAS, 369, 497
- Kuntschner et al. (2010) Kuntschner H., et al., 2010, MNRAS, 408, 97
- Lackner et al. (2012) Lackner C. N., Cen R., Ostriker J. P., Joung M. R., 2012, MNRAS, 425, 641
- Ledo et al. (2010) Ledo, H. R., Sarzi, M., Dotti, M., Khochfar, S., Morelli, L., 2010, MNRAS, 407, 969
- McMaster et al. (2008) McMaster M., et al. 2008, WFPC2 Instrument Handbook, Version 10.0, STScI, Baltimore
- McDermid et al. (2006) McDermid R. M., et al., 2006, MNRAS, 373, 906
- Morelli et al. (2004) Morelli L., et al., 2004, MNRAS, 354, 753
- Morelli et al. (2008) Morelli L., et al., 2008, MNRAS, 389, 341
- Morelli et al. (2010) Morelli L., Cesetti M., Corsini E. M., Pizzella A., Dalla Bontà E., Sarzi M., Bertola F., 2010, A&A, 518, A32
- Naab et al. (2007) Naab T., Johansson P. H., Ostriker J. P., Efstathiou G., 2007, ApJ, 658, 710
- Nelder & Mead (1965) Nelder J. A., Mead R., 1965, Computer J., 7, 308
- Noordermeer et al. (2008) Noordermeer E., et al., 2008, MNRAS, 384, 943
- Oser et al. (2010) Oser L., Ostriker J. P., Naab T., Johansson P. H., Burkert A., 2010, ApJ, 725, 2312
- Pavlovsky et al. (2004) Pavlovsky C., et al., 2004, ACS Instrument Handbook, Version 5.0, STScI, Baltimore
- Pavlovsky et al. (2006) Pavlovsky C., et al., 2006, ACS Data Handbook, Version 5.0, STScI, Baltimore
- Pizzella et al. (2002) Pizzella, A., Corsini, E. M., Morelli, L., Sarzi, M., Scarlata, C., Stiavelli, M., Bertola, F., 2002, ApJ, 573, 131
- Portaluri et al. (2013) Portaluri E., Corsini E. M., Morelli L., Hartmann M., Dalla Bontà E., Debattista V. P., Pizzella A., 2013, MNRAS, 433, 434
- Salpeter (1955) Salpeter E. E., 1955, ApJ, 121, 161
- Sánchez-Blázquez, Gorgas, & Cardiel (2006) Sánchez-Blázquez P., Gorgas J., Cardiel N., 2006, A&A, 457, 823
- Sancisi et al. (1984) Sancisi R., van Woerden H., Davies R. D., Hart L. 1984, MNRAS, 210, 497
- Sandage & Bedke (1994) Sandage A., Bedke J., 1994, The Carnegie Atlas of Galaxies. Carnegie Institution of Washington, Washington DC
- Sandage & Tammann (1981) Sandage A., Tammann G. A., 1981, A Revised Shapley-Ames Catalog of Bright Galaxies. Carnegie Institution of Washington, Washington DC
- Sarzi et al. (2005) Sarzi M., Rix H.-W., Shields J. C., Ho L. C., Barth A. J., Rudnick G., Filippenko A. V., Sargent W. L. W., 2005, ApJ, 628, 169
- Sarzi et al. (2006) Sarzi M., et al., 2006, MNRAS, 366, 1151
- Sarzi, Ledo, & Dotti (2015) Sarzi M., Ledo H. R., Dotti M., 2015, MNRAS, 453, 1070
- Sarzi et al. (2016) Sarzi M., et al., 2016, MNRAS, in press (arXiv:1601.03292)
- Scorza & Bender (1995) Scorza, C. Bender, R., 1995, A&A, 293, 20
- Scorza & van den Bosch (1998) Scorza C., van den Bosch F. C., 1998, MNRAS, 300, 469
- Sil’chenko (1997) Sil’chenko O. K., 1997, Astron. Rep., 41, 567
- Sil’chenko (1999) Sil’chenko O. K., 1999, AJ, 117, 2725
- Sil’chenko (2005) Sil’chenko O. K., 2005, Astron. Lett., 31, 227
- Sirianni et al. (2005) Sirianni M., et al., 2005, PASP, 117, 1049
- Thomas, Maraston, & Bender (2003) Thomas D., Maraston C., Bender R., 2003, MNRAS, 339, 897
- van den Bosch et al. (1998) van den Bosch F. C., Jaffe W., van der Marel R.P., 1998, ApJ, 293, 343
- van Dokkum (2001) van Dokkum P. G., 2001, PASP, 113, 1420
- Worthey (1994) Worthey G., 1994, ApJS, 95, 107
- Worthey et al. (1994) Worthey G., Faber S. M., Gonzalez J. J., Burstein D., 1994, ApJS, 94, 687