Attenuation of vacuum ultraviolet light in liquid argon
Abstract
The transmission of liquid argon has been measured, wavelength resolved, for a wavelength interval from 118 to 250 nm. The wavelength dependent attenuation length is presented for pure argon. It is shown that no universal wavelength independent attenuation length can be assigned to liquid argon for its own fluorescence light due to the interplay between the wavelength dependent emission and absorption. A decreasing transmission is observed below 130 nm in both chemically cleaned and distilled liquid argon and assigned to absorption by the analogue of the first argon excimer continuum. For not perfectly cleaned argon a strong influence of impurities on the transmission is observed. Two strong absorption bands at 126.5 and 141.0 nm with approximately 2 and 4 nm width, respectively, are assigned to traces of xenon in argon. A broad absorption region below 180 nm is found for unpurified argon and tentatively attributed to the presence of water in the argon sample.
pacs:
29.40.McScintillation detectors and 33.20.NiVacuum ultraviolet spectra and 61.25.BiLiquid noble gases1 Introduction
Liquid rare gases have been proven to be excellent media for particle detection with fluorescence detectors due to their high fluorescence efficiency. Liquid argon and xenon, in particular, are used for rare event search in astroparticle physics and benefit from the outstanding scintillation properties of liquid rare gases. Several already existing or future experiments use argon as detector medium, both in scintillation counters and time projection chambers, covering nearly all present fields of astroparticle physics like direct search for dark matter particles (MiniCLEAN MiniCLEAN , DEAP-3600 DEAP/CLEAN , ArDM ArDM_1 ; ArDM_2 , WARP WARP , DarkSide DarkSide , and DARWIN DARWIN_1 ; DARWIN_2 ), neutrino physics (ICARUS ICARUS and GLACIER Rubbia_CP_Violation ), or the search for neutrinoless double-beta decay (GERDA GERDA uses a liquid argon veto).
Since some of the detector systems mentioned above use large quantities of liquid argon the scintillation light may have to traverse long distances from the position where it is produced to the detector. It is therefore important to study the attenuation of vacuum ultraviolet (VUV) light in liquid argon. However, an intensive literature search returned no publication showing a wavelength resolved attenuation length measurement for pure liquid argon. Ishida et al. Ishida_Abschwaechlaenge measured, among other noble gases and admixtures, the wavelength integrated attenuation length of pure liquid argon for its own scintillation light. The measuring principle was based on recording the amount of scintillation light (obtained by irradiating liquid argon with a heavy ion beam) at seven different distances between 137 mm and 737 mm from the light detector. For that purpose, liquid argon was contained in a steel cell with seven entrance windows for the heavy ion beam. Light detection was performed at the end of the steel cell via a Pyrex® window coated with sodium salicylate, which shifted the VUV scintillation light into visible light to enable detection with a regular photomultiplier. A wavelength integrated attenuation length of (663) cm in pure liquid argon was obtained in this experiment.
Recently we have measured the emission spectrum of liquid argon in the vacuum ultraviolet spectral range. The main result of this study Heindl_1 will be shown again here (section 3.1). It is obvious that the wavelength integrated measuring principle cannot disentangle the influence of possible impurities like water vapor, oxygen, or other noble gases, which have a huge effect on the transmission. It has also to be noted that impurities, depending on their concentrations, affect both the emission spectrum as well as the transmission spectrum. Any wavelength integrated measuring principle can therefore only measure a combined effect of emission and transmission, and consequently the obtained ”attenuation length” strongly depends on impurities. We will show that an attenuation length (for wavelength-integrated light) in the sense of an exponential decay of intensity and a reduction of light to cannot be applied due to the wavelength dependence of the absorption. We will also show that traces of other rare gases, xenon in particular in the case of liquid argon, can contribute significantly to light absorption. Since Ishida et al. Ishida_Abschwaechlaenge used the same experimental setup to measure all noble gases and admixtures, the probability of a noble gas contamination is high in these experiments but cannot be identified due to the wavelength-integrated data taking method. Wavelength resolved reference data for the absorption of xenon-doped liquid argon are available from a measurement by Raz and Jortner in 1970 Jortner_1970 and will be used to estimate the xenon impurity concentration in our experiments.
Here we follow the concept that the optical properties of liquid rare gases are similar to those of dense gases. From the latter some information is available to predict the attenuation. Detailed studies of the issue have been performed in the context of VUV excimer lasers of pure rare gases Photoabsorption_Cross_Section_Krypton_Xenon . Attenuation on the long wavelength side of the resonance lines of dense krypton and xenon gas has been described in ref. Photoabsorption_Cross_Section_Krypton_Xenon in that context. Both absorption due to optical transitions starting from the van der Waals minimum of the lower potential curve in the region of the so-called first excimer continuum and scattering due to increasing fluctuations of the index of refraction when approaching the resonance lines from longer wavelengths have been identified in that reference as the reason for light attenuation extending far out into the red wings of the resonance lines. Rayleigh scattering in rare gas liquids has also more recently been discussed in ref. Rayleigh_scattering_length_calculation resulting in a scattering length of 90 cm. Here we assume that the processes discussed in these publications are also relevant for the attenuation in liquid argon for wavelengths close to the resonance lines of argon at 104.82 nm 106.67 nm NIST , and longer wavelengths.
After a description of experimental details the VUV transmission of the best quality liquid argon achieved in this study will be presented. Then, it will be shown that traces of xenon in liquid argon lead to significant absorption bands, in part exactly at the peak of the emission band of liquid argon, and the data will be discussed using the results from ref. Jortner_1970 . Attenuation by impurities is a well known effect in the vacuum ultraviolet spectral region, and rare gas impurities are particularly critical because they are not removed by regular chemical gas purification techniques. It will be shown that these chemical purification steps are mandatory to remove regular impurities like oxygen and water vapour.
2 Experimental details
2.1 Experimental setup
The concept of the experiment was to use a very basic optical setup to avoid complications in the interpretation of the results for example due to changes in the geometry when the gas cell is cooled down (fig. 1). Vacuum ultraviolet light was produced by a deuterium lamp with a MgF window (Cathodeon Model V03). It was attached to an outer vacuum cell of 100 mm diameter (CF 100 cross piece). An inner cell made from copper was installed in the center of this vacuum cell. This inner cell had two optical MgF2 windows of 5 mm thickness and 25 mm diameter and could be filled with liquid argon. The distance between the inner surfaces of the MgF2 windows was 58 mm, which is the relevant distance for the transmission measurements. The light emitted from the deuterium lamp was collimated by a stack of 3 apertures with 4 mm diameter and sent through the center of the inner cell. Another set of apertures was mounted behind the inner cell. A f=30 cm vacuum spectrometer (McPherson model 218) was mounted at the outer cell opposite to the deuterium lamp. It was equipped with a VUV image intensifier (micro channel plate, MCP) with MgF2 entrance window, S20 multi-alkali cathode, and a diode array. The spectrometer could measure a spectrum of about 60 nm width in one exposure, and the center wavelength could be set manually.
The cryogenic setup and gas handling were analogous to those described in refs. Heindl_1 ; Heindl_2 . The setup including a schematic drawing of the gas handling system is shown in fig. 2. The inner cell was held in place and cooled by a copper rod attached to a dewar filled with liquid nitrogen. Temperature was measured using PT100 resistors and could be controlled by sending an electrical current through a 47 , 20 W resistor, which was soldered onto the copper rod. Gas filling and circulation were performed via a heat exchanger. The outer gas system consisted of a closed cycle of a rare gas purifier (SAES model MonoToRR® Phase II, PS4-MT3) and a metal bellows pump to circulate the gas through the system. The gas could be filled into the system from a gas bottle with a pressure reducer. The cryogenic cell was added as a bypass to the gas cycle so that the gas in that cell could be continuously refreshed by condensation and evaporation. A stainless steel storage volume was attached to the outer gas system, and could be cooled to liquid nitrogen temperature by immersing it into an open dewar filled with liquid nitrogen. This storage volume was used to distill the argon gas used for the absorption measurements as will be described below. Separate turbo molecular pumps were used to pump the gas system, the monochromator as well as the outer vacuum cell.
2.2 Experimental method
The basic concept was to divide the spectra obtained with the inner cell filled with liquid argon by the corresponding reference spectra recorded with the inner cell cooled and evacuated. Since both spectra were recorded with the inner cell at the same temperature, changes in the transmission due to geometrical effects (expansion and contraction of the rod holding the cell etc.) could be excluded. A fixed set of center wavelengths of 90, 120, 150, 180, and 210 nm was used for the experiments described below. The individual spectra overlapped by 30 nm. An overall spectrum was generated by minimizing the squared deviations of the optical signal in the overlapping regions Diplomarbeit . This allowed us to measure absorption spectra from the short wavelength cutoff of the detection system up to 250 nm above which the higher diffraction-order signals from the grating monochromator would have required edge filters to be used. The operation and readout of the detector was computer controlled and allowed to select the exposure time. Exposures could be repeated automatically several times to improve the statistics. The concept was to record transmission spectra when the inner cell was filled with liquid argon for every setting of the central wavelength and corresponding reference spectra with a cooled and evacuated inner cell. A necessary correction is to take the change in the index of refraction at the inner surfaces of the MgF2 windows into account between the case of an empty cell and a cell filled with liquid argon (Fresnel formula). A test to correct our raw data with this Fresnel formula using the index of refraction of MgF2 MgF2_Refractive_Index and liquid argon (scaled from the gas phase) GAr_Refractive_Index ; LAr_Refractive_Index , however, did not change the overall spectral shape, in particular, the decreasing transmission towards shorter wavelengths (described in section 3.1) remained. Therefore, the ”Fresnel correction” was not applied.
It was found that a more serious experimental problem appears due to condensation of residual gas components in the outer vacuum onto the surfaces of the MgF2 windows of the inner cell, a process which will be called ”fogging” in the text below. A series of transmission spectra of the cooled and evacuated inner cell recorded at various times after cooling the inner cell down is shown in fig. 3. An analysis of these data showed that the transmission was reduced exponentially with time at each wavelength position. This is documented in fig. 4 and allowed a proper correction of each spectrum according to the time at which it had been recorded after the start of the cooldown. The measurement of the time dependent fogging of the MgF2 windows (fig. 3) was performed 21 hours after the measurement of pure liquid argon. This was approximately the time difference which was necessary to heat up the cell to room temperature again, without thermally damaging the experimental setup. Therefore, changes in the composition of the residual gas components in the outer insulation vacuum between the measurement of pure liquid argon and the measurement of the fogging of the MgF2 windows can be excluded.
Since it was found that the liquid argon could be removed from the inner cell more quickly than condensed into it, the reference spectra were recorded after the spectra had been measured with the inner cell filled with the liquid. The time at which each spectrum was recorded with respect to the start of cooling the inner cell was carefully documented for corrections in the analysis of the data based on the findings shown in fig. 3 and fig. 4. The accuracy of time measurement was of the order of seconds and the time differences between the measurements of the cell filled with liquid argon and the corresponding reference measurements were between one and two hours depending on the intensity of the D2 lamp in the different spectral regions and consequently the required exposure times. The overall accuracy was of the order of minutes given by the exposure time of the data recording system. The statistical errors of the exponential fits of the transmission at each wavelength (fig. 4) were considered and incorporated in the total error analysis.
Besides the short-term degradation of the spectra shown in figs. 3 and 4 a long term modification (weeks) of the emission from the deuterium lamp was found. Exposure to the residual gas in the outer cell obviously led to a reduction of intensity in the short wavelength part of the VUV emission due to carbon hydroxides in the residual gas, which were cracked by the VUV light and coated the MgF2 window of the lamp. This effect is known in VUV optics and could be reversed by letting the lamp operate in an oxygen containing atmosphere for several hours.
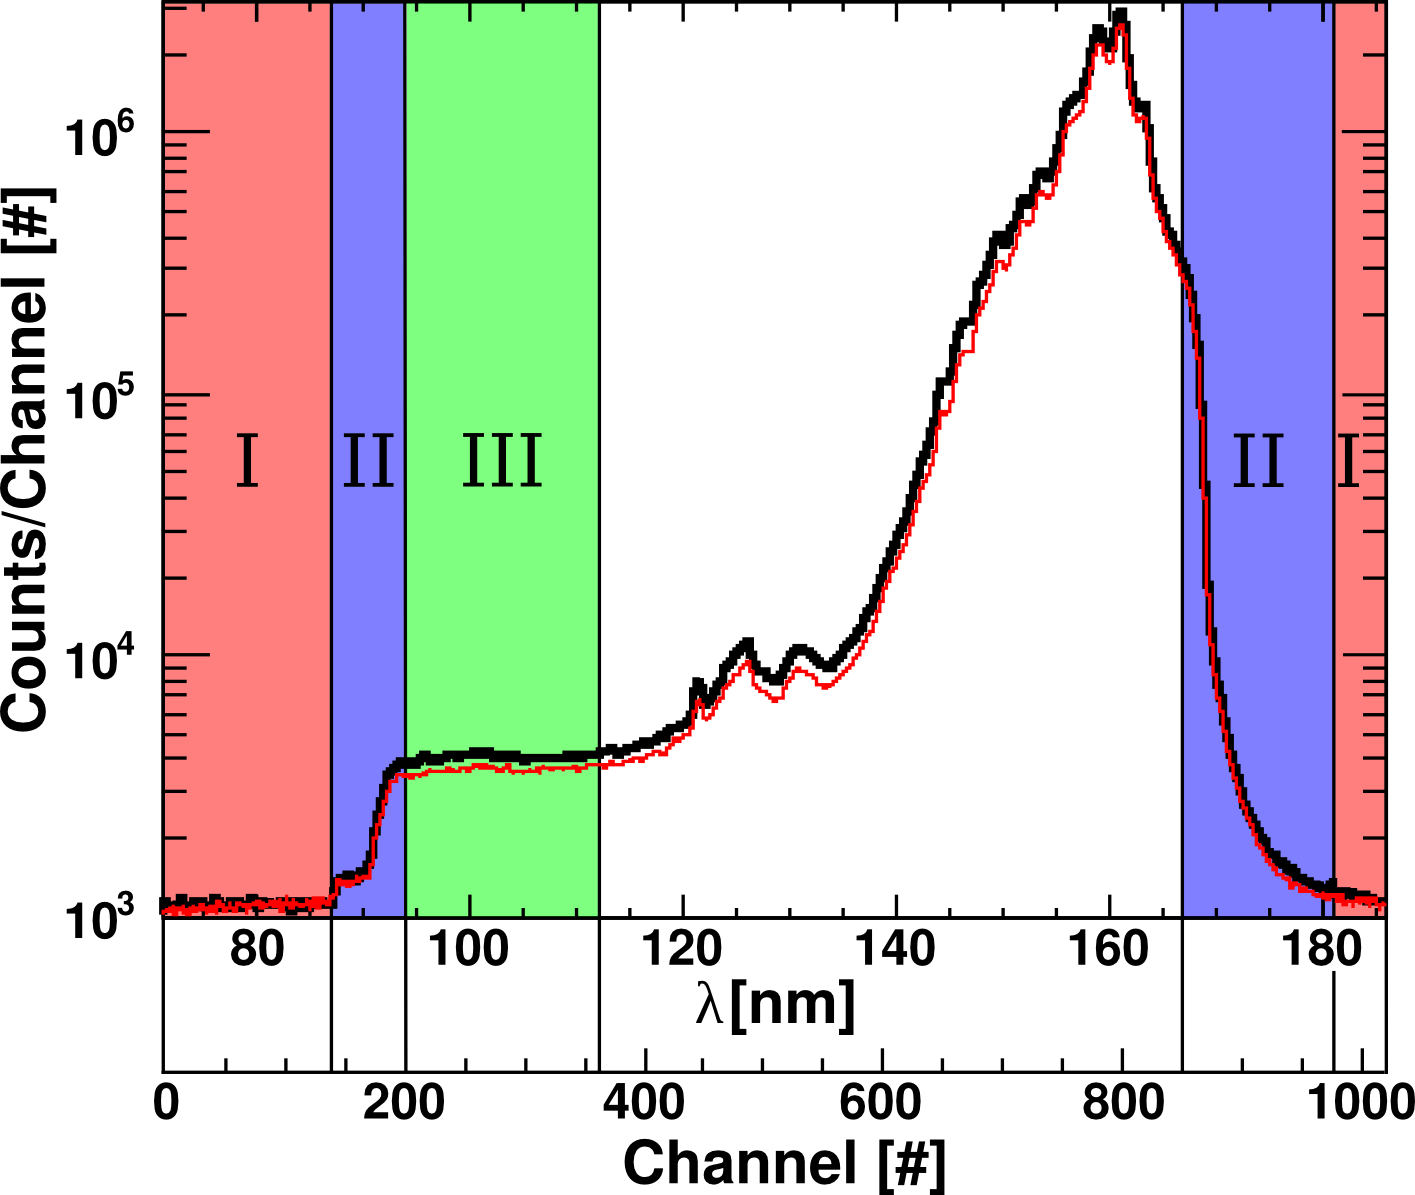
For the analysis of the data described below it was important to study the performance of the detector carefully. An important issue was to find the zero level in the spectra, which has to be subtracted from the raw data before the ratio between transmission spectrum and reference spectrum is calculated. First, background spectra were recorded by closing a valve in front of the spectrometer and subtracted from the subsequent measurements. Fig. 5 exhibits an example of the raw data measured in the most critical, short wavelength region (120 nm central wavelength setting at the monochromator). The thin (red) line shows the data obtained in a measurement of the inner cell evacuated and the thick (black) line shows data recorded in a measurement with the inner cell filled with liquid argon. Relevant are two background levels in which scattered light is taken into account. The first pedestal (I in fig. 5) which appears left and right in the spectra is due to the fact that the diode array is somewhat larger than the diameter of the MCP and sees no signal. After a transition phase (II in fig. 5), the second step is observed in the region (III in fig. 5) where the MCP and the diode array are both active. This level is used as a background level based on data which were recorded with wavelength settings for which no light can be expected: In our analysis we used wavelengths, which were shorter than the cutoff wavelength of the MgF2 windows (113 nm Abschnittkante_MgF2 ). A critical examination of the emission spectrum based on the emission spectrum of the lamp and the background issues of the detector showed that transmission measurements down to 118 nm can be performed with the setup described here. The light output from the deuterium lamp below 118 nm is too low to provide reliable data (see fig. 5). Transmission spectra shown below will therefore always start at this wavelength.
3 Results and discussion
3.1 Pure liquid argon
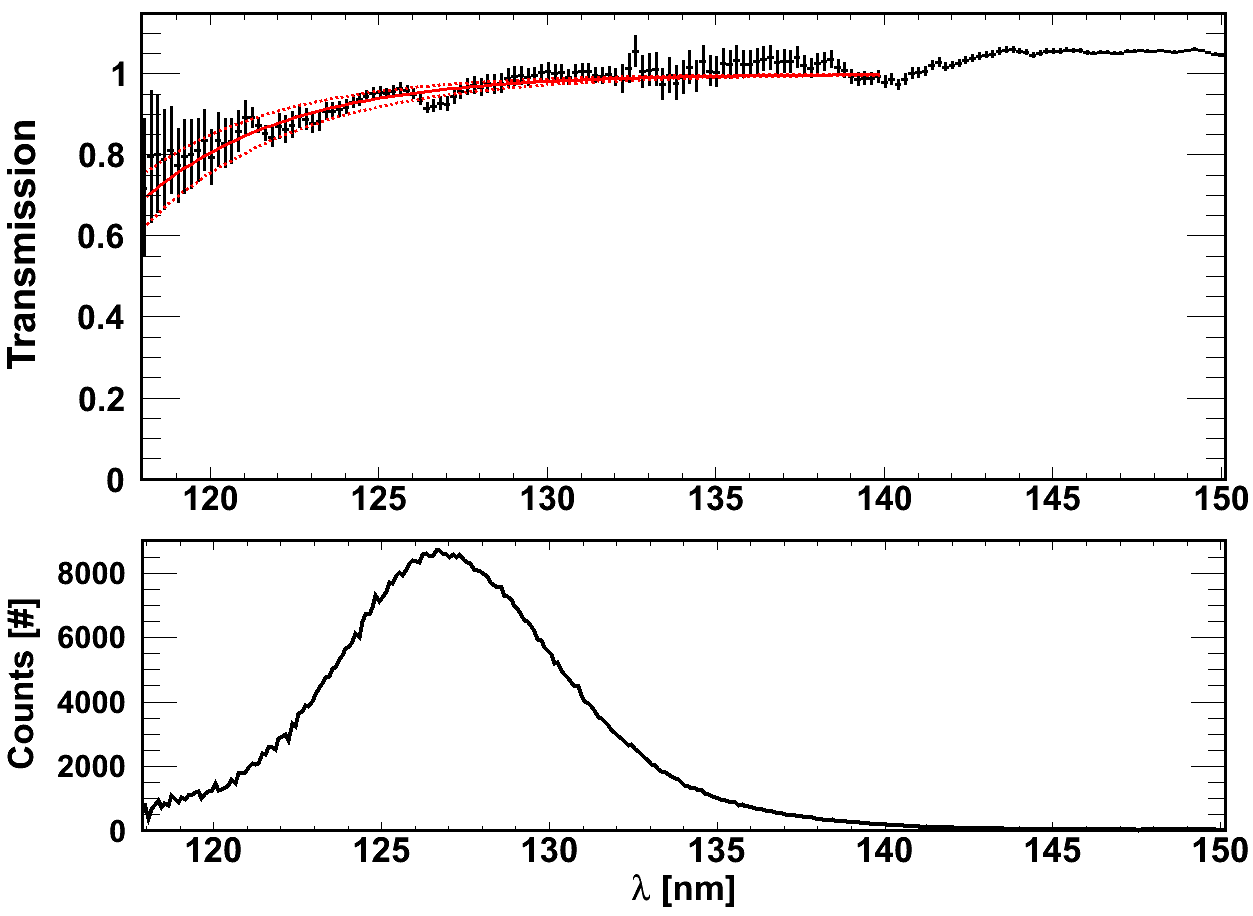
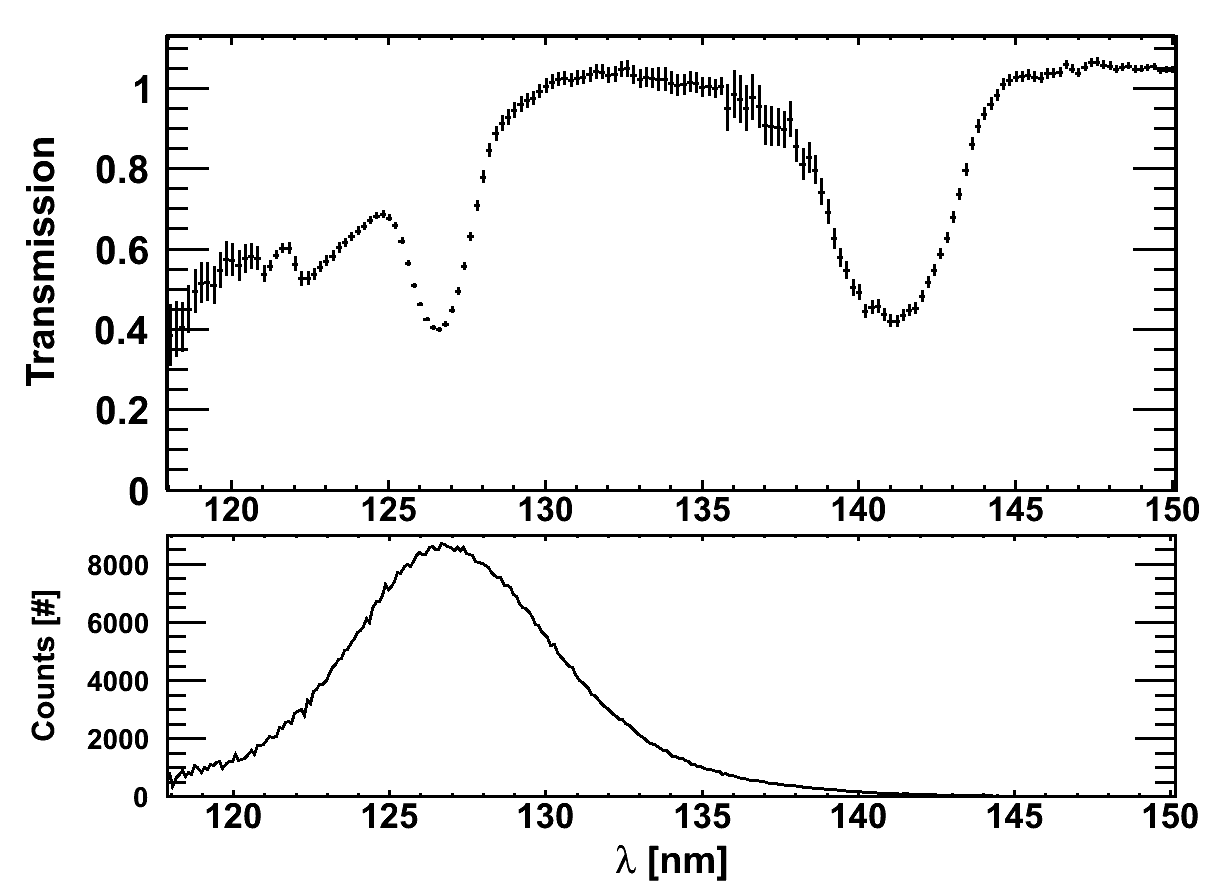
The best result, obtained so far, for the wavelength dependence of the transmission of VUV light through 58 mm liquid argon is shown in fig. 6 in comparison with the emission spectrum observed in ref. Heindl_1 . All purification steps described in section 3.2 below (usage of a gas purifier and distillation of liquid argon) were applied to record these data. Since the raw data showed a transmission slightly above 100% for long wavelengths, we compensated this so far unresolved systematic effect by scaling the 210 nm center wavelength transmission measurements to 100%. The transmission is close to 100% above 130 nm. It decreases towards shorter wavelengths and reaches 70% at 118 nm, the shortest wavelength of our measurements. It is believed that this decrease in transmission is due to argon itself and could be attributed to absorption by transitions corresponding to the analogue of the first argon excimer continuum. However, a residual unknown impurity, which in the presence of argon atoms causes this decrease, cannot be completely excluded. For an empirical description we fitted an exponential function (eq. 1) with two parameters a and b to the data from nm to 140 nm. The parameter b is a hint to the wavelength position of strong resonant absorption by the analogue of the first argon excimer continuum.
| (1) |
-
Incident light intensity as indicated by the spectrum (thin red line) in fig. 5
-
Light intensity after traversing a layer of thickness d
For our case, d=5.8 cm, we obtain the following values for a and b together with their 1 errors:
| (2) | |||||
| (3) |
The transmission data and the fit (full red line) are shown in fig. 6 (upper panel). The dashed (red) lines correspond to the two extreme combinations of the 1 errors of the fit parameters a and b. The experimental method as described in section 2.2 leads to transmission values slightly above unity around =145 nm. This is caused by a systematic error, which cannot be resolved until a measurement of the wavelength dependent refractive index of liquid argon is available to provide a correct reflection value at the surface between liquid argon and the MgF2 windows (Fresnel correction). Consequently, the presented transmission curve should rather be seen as an upper limit for the real transmission. However, the decrease towards the short wavelength end of the presented transmission spectrum (see fig. 6) is visible in all measurements and cannot be attributed to a systematic error. This decrease is probably even underestimated, due to the optimistic transmission scaling described above. The empirical description for the wavelength dependence of the transmission (eq. 1) is now used to calculate the wavelength dependent attenuation lengths (). The attenuation of light, traversing a medium can be described by an exponential decay111Equation 4 neglects any potential flourescence-light emission. This is expected to be justified since the emission of the deuterium lamp is weak below about 130 nm and the distance between the inner cell and the detector is large ( cm). at each wavelength :
| (4) | |||||
| (5) | |||||
| (6) |
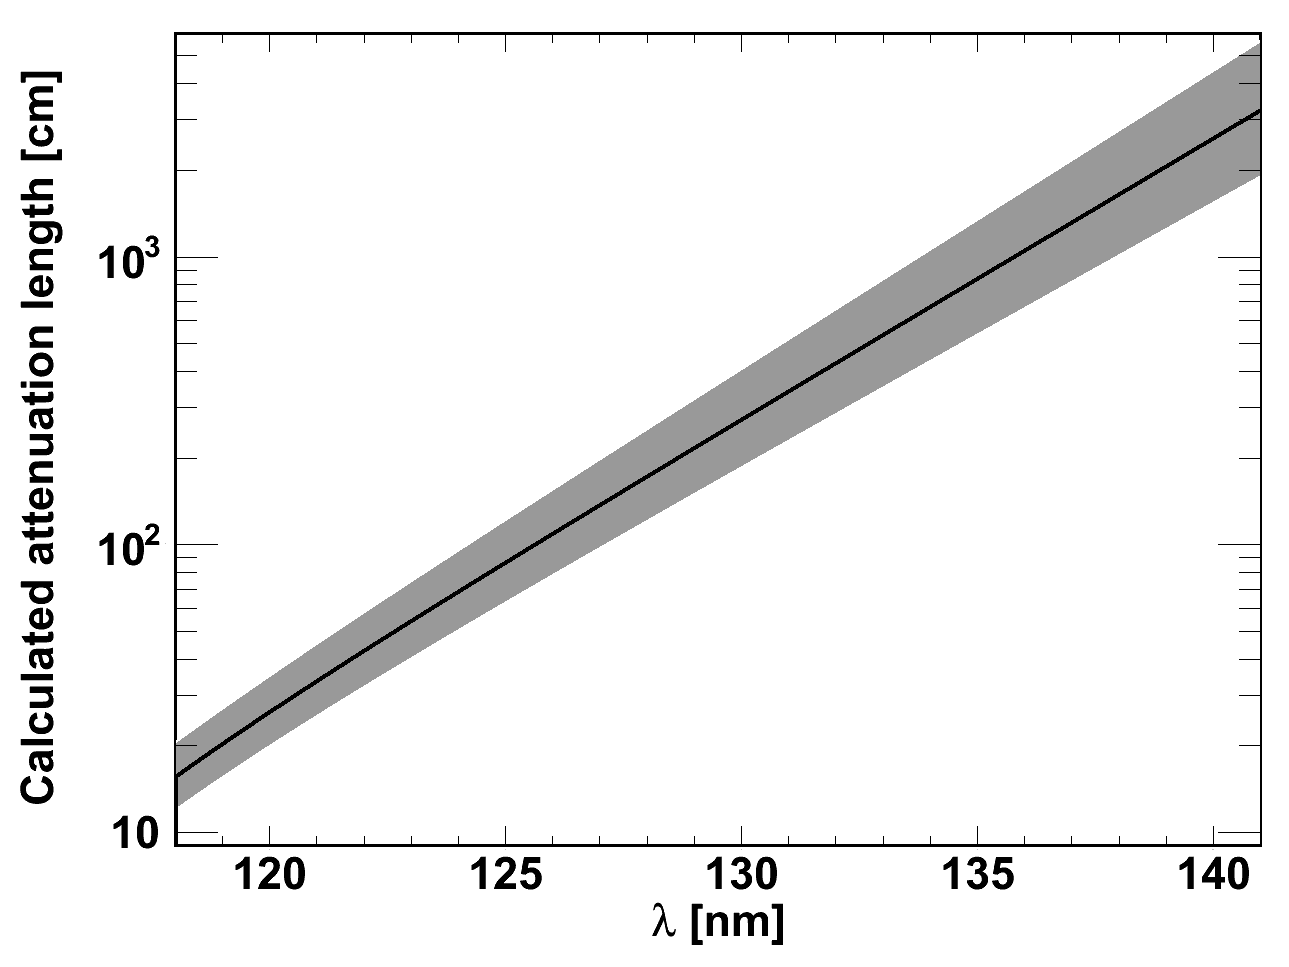
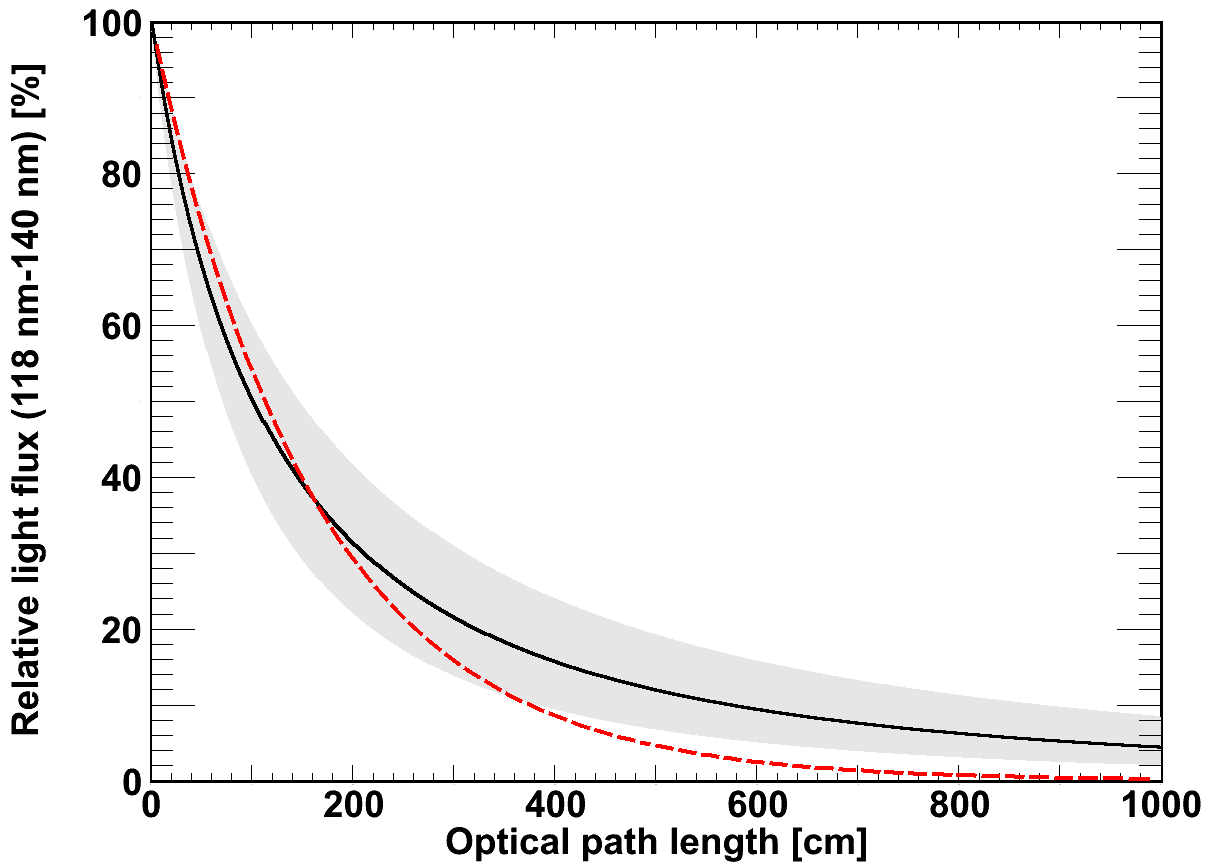
Using eq. 6 the wavelength dependent attenuation length was calculated. The result is shown in fig. 7. Note, that no unique attenuation length can be given for liquid argon in the VUV spectral range. However, combining a source spectrum with the transmission data, the wavelength integrated intensity versus distance traversed by the light in liquid argon can be calculated. This is demonstrated using the important example when fluorescence light of argon itself (fig. 6 lower panel) is attenuated and thereby modified in its spectral shape during its path through liquid argon. The modification of the spectral shape with distance is calculated using eq. 4 with the obtained attenuation length from eq. 6 and is depicted in fig. 8. It shows the ”reddening” of VUV light propagating in liquid argon just like sunlight observed around sunset. Wavelength integrated data for the light flux F(x) versus distance can be calculated from spectra analogous to fig. 8 along the path of light using eqs. 7 and 8, thereby taking the modification of the spectrum into account:
| (7) | |||||
| (8) |
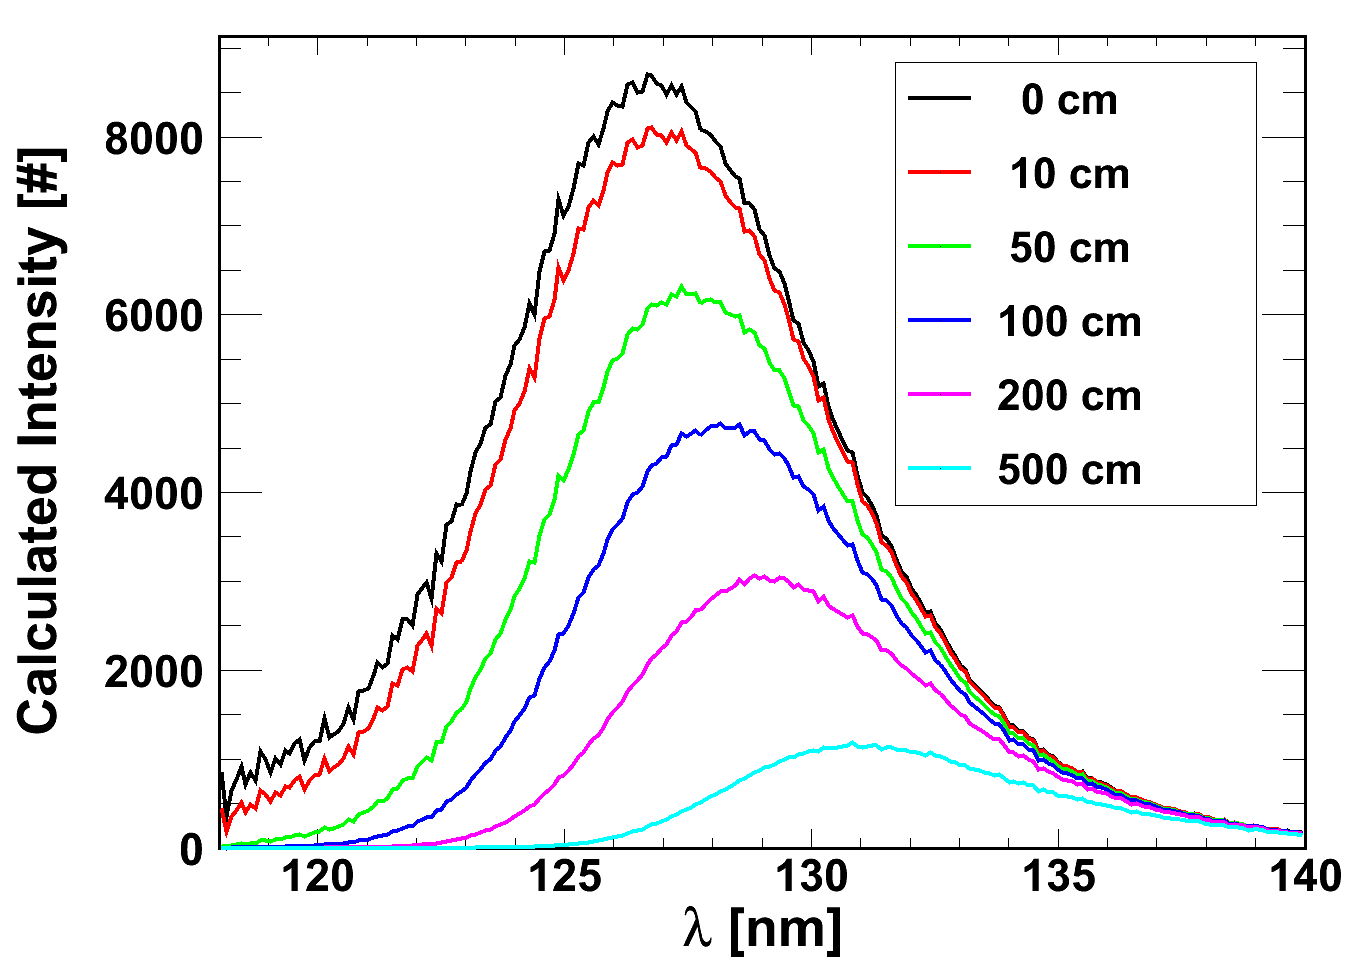
The results are shown in fig. 9. As mentioned above no unique attenuation length exists in liquid argon. The flux decrease with distance depends on the combination of the spectrum at the starting point and its modification by the wavelength dependent attenuation, and has to be calculated for each wavelength independently. Wavelength integrated values have to be obtained by integrating the spectrum afterwards and comparing this integral with the integral of the spectrum at the starting point. The flux reduction is not exponential as the comparison with an exponential function in fig. 9 shows. The nominal value with respect to the initial flux of the argon fluorescence light is 1.63 m.
3.2 Effect of xenon impurities
Although the 58 mm length of the absorption cell was too short for measuring reliable transmission values for wavelengths longer than about 130 nm it had the right length for studying the effect of impurities and gas handling. The transmission spectra shown in figs. 6 and 10 could only be observed after a series of about 20 measuring campaigns with stepwise improved gas handling. Here we follow this way backwards to emphasize the most critical issues by describing them first. Already in the emission spectra of ref. Heindl_1 it was found that it is difficult to remove other rare gases from argon, xenon in particular. Why krypton never played a role in our experiments cannot be answered by the authors, so far. In general, xenon (or may be in some cases krypton) may be contained in some gas bottles, or it may be released from components in the gas system if it had been used with xenon or krypton prior to argon measurements. Poly-tetra-fluor-ethylene (PTFE, Teflon) is one of the materials, which is critical because it is often used for gaskets, e.g. in the connector of the pressure reducer to the gas bottle. Measurements exposing a 1 mm thick Teflon sheet of 16 g weight for 1 h to 2 bar xenon led to an increase of 25 mg in weight, which was released again with a time constant of 2 to 3 days when it was again exposed to ambient air. This behaviour is also in agreement with the observation that another rare gas pressure reducer, used on a xenon bottle more than a year ago, still led to xenon impurities of more than 50 ppm even after several purgings.
The problem is that xenon (or krypton if it were contained in a gas system) cannot be removed by regular rare gas purifiers because they make use of chemical reactions and can therefore not act on rare gases. The situation is even more critical in experiments with a cryogenic cell because xenon (or krypton) impurities will condense in the experimental cell with time from all parts of the gas system at higher temperatures. Absorption features which could be attributed to xenon were indeed observed in the experiments described here. In fig. 10 (upper panel) the transmission of a liquid argon sample is shown for which the conventional chemical purification had been applied but the gas was not distilled before being used for the measurement. The fluorescence of liquid argon is again shown for comparison (lower panel). This demonstrates that there is, unfortunately, an almost exact coincidence between one of the xenon absorption features at 126.5 nm and the peak of the argon emission spectrum. For the assignment of the absorption dips a comparison of the absorption spectrum with the emission spectrum of our unpurified argon gas is shown in fig. 11. A low-energy electron beam excitation method described in ref. E_beam_induced_light_emission and references therein was used to record the emission spectrum in the gas phase. The resonance lines of xenon at 146.96 and 129.56 nm NIST are clearly visible (see fig: 11, lower panel). According to ref. Jortner_1970 the pronounced absorption dip at 141.0 nm can be attributed to a perturbed atomic transition of xenon ( , 146.96 nm). The second absorption dip at 126.5 nm, however, cannot be assigned to a perturbed atomic transition but rather to a trapped exciton (Wannier-Mott type) impurity state Jortner_1970 . The widths of the absorption bands are 2.0 and 3.8 nm, respectively. Xenon is therefore a very critical impurity, which can as a pure rare gas be easily underestimated in practical applications.
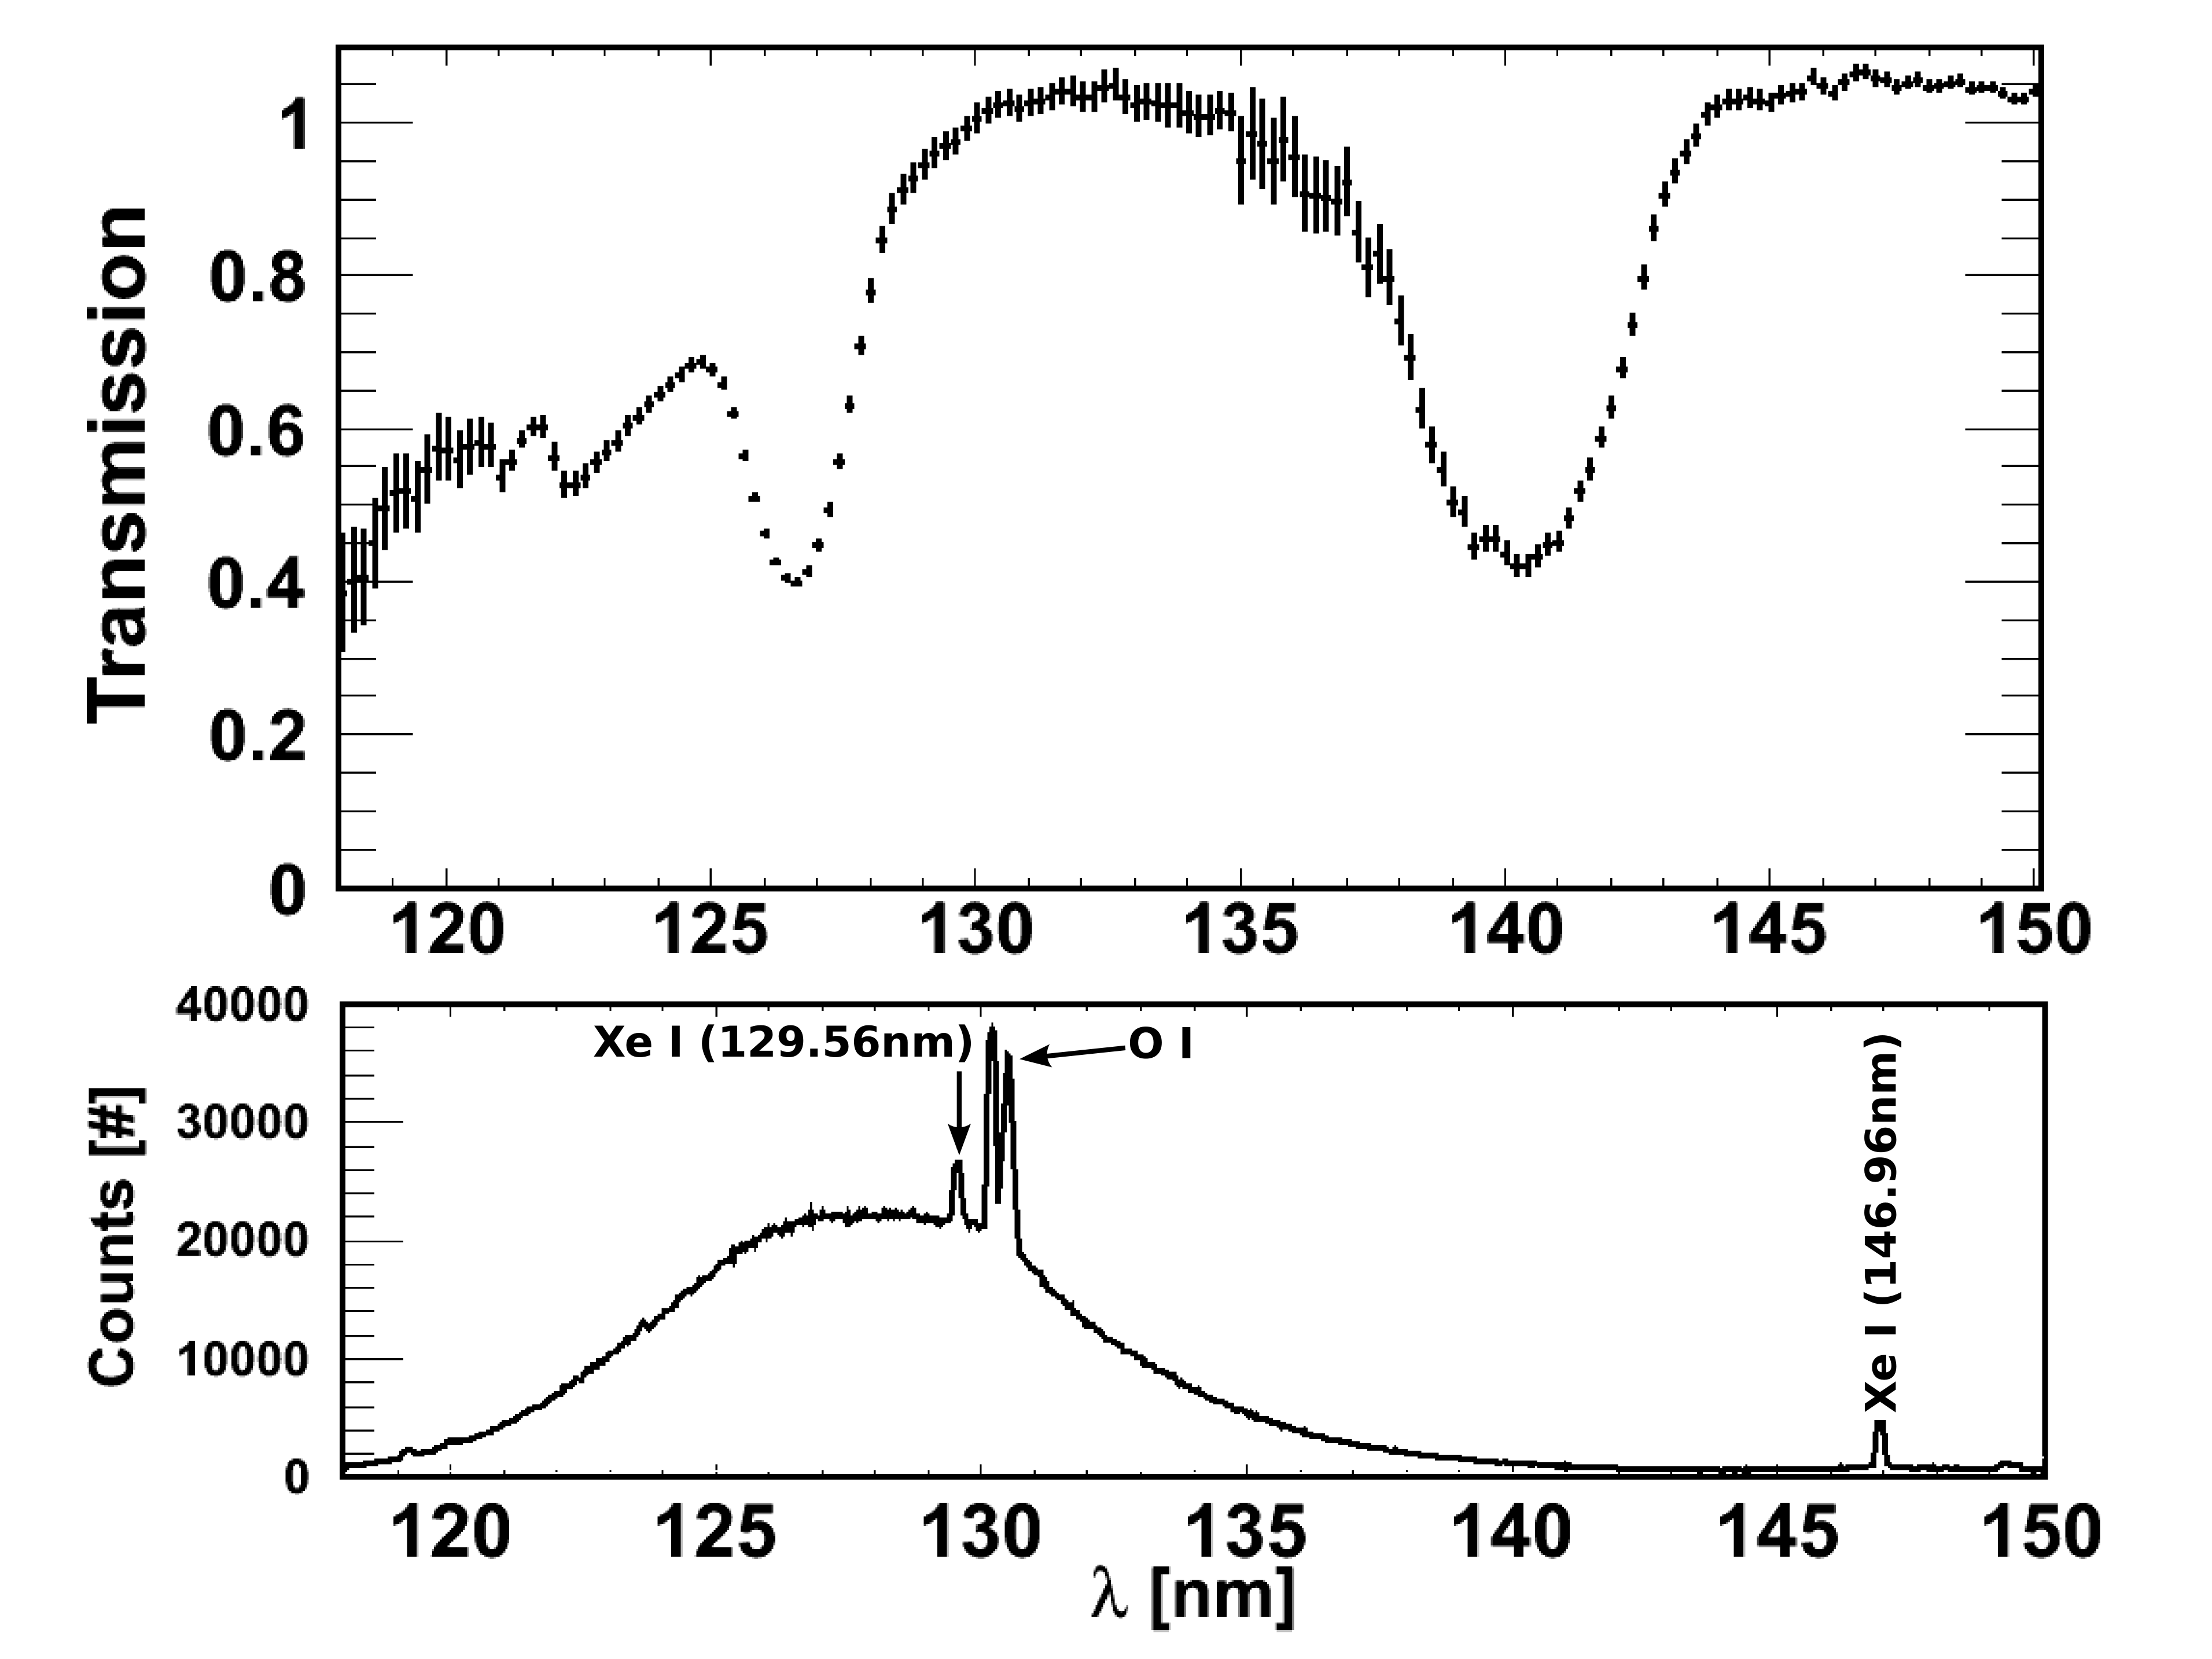
The concentration of xenon in the argon gas used in the present experiments could be estimated from emission measurements performed in the gas phase (fig. 11 lower panel) to be smaller than 3 ppm. This is obtained from a comparison with data shown in ref. Efthimiopoulos . The concentration of xenon could also be estimated from a comparison with measurements by Raz and Jortner Jortner_1970 . There, the optical density of liquid argon doped with 3 ppm of xenon was measured in a wavelength range from 120 nm to 160 nm, and for an optical path length of 1 cm. The transmission minimum at 141.0 nm is also clearly visible. A recalculation of their data to an optical path length of 5.8 cm and a subsequent comparison of the areas of the transmission minima at 141.0 nm lead to a concentration of approximately 140 ppb xenon for the undistilled argon sample used in our experiment. The effect of the fractional distillation can also be estimated. A comparison of the area of the small transmission minimum in pure liquid argon at 141.0 nm (fig. 6 upper panel), which is still visible but reduced compared to the undistilled liquid argon (e.g. fig. 10 upper panel) leads to a concentration of approximately 7 ppb. Consequently, the xenon contained in the argon was reduced by a factor of approximately 20 due to fractional distillation.
3.3 Absorption in unpurified liquid argon
A transmission spectrum of liquid argon as taken directly from the gas bottle (Ar 5.0, i.e. a nominal purity of 99.999 %) is shown in fig. 12. Besides the two absorption bands at 141.0 and 126.5 nm, which have been attributed to a xenon impurity, a broad absorption is observed below 180 nm with a minimum transmission of about 45% at 145 nm. The absorption/emission structure around 121 nm may be due to hydrogen released from the water or an artifact related to the Lyman- line of hydrogen emitted by the deuterium lamp. The broad absorption between about 125 and 180 nm is believed to be mainly due to water vapor contained in the argon gas, which has not been circulated through the rare gas purifier. The temperature dependent absorption of solid water in the VUV had been studied in refs. Ice_crystall_formation ; Absorption_Ice .
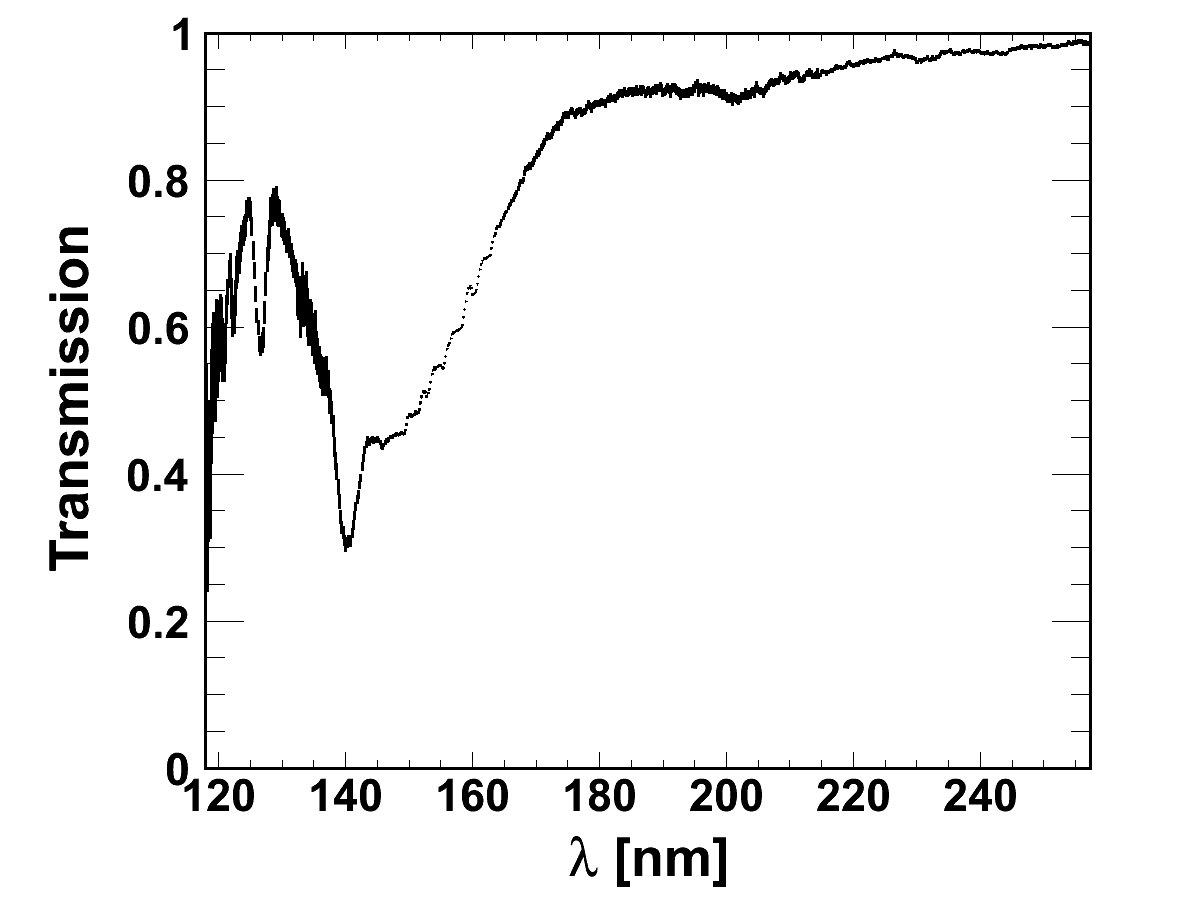
It has to be noted that the transmission shown in fig. 12 was only reached when the system had already been used for a long time with many purification cycles with the rare gas purifier. In the beginning of the experiments the transmission reduced towards shorter wavelengths starting at 180 nm reaching zero at about 150 nm. This means that chemical gas purification is mandatory for fluorescence detectors using liquid argon as detector material.
Finally, it should be noted that the transmission measurement had in one test experiment been extended to the visible spectral range. The data are not easy to interpret because of the higher diffraction orders of the grating in the VUV monochromator. However, since all structures in the spectra appeared at wavelength positions which could be related to first order structures we can conclude that no significant absorption exists in liquid argon in the longer wavelength UV and visible spectral range.
4 Summary
It has been shown that the light propagation in liquid argon, which is frequently and in large quantities used for particle detection, is strongly wavelength dependent. However, a purification level can be reached where an effective attenuation length on the order of 1.6 m can be obtained for its own fluorescence emission. If much longer propagation lengths are possible will become clear when experiments with higher accuracy will be performed, using longer absorption cells and improved light sources.
We found a systematic reduction of transmission in liquid argon from about 140 nm towards shorter wavelengths and attribute this to absorption in argon by transitions which are called the ”first continuum” in emission. Note that the atomic and molecular structure of the heavier rare gases neon through xenon are so similar that essentially all effects measured for one of the species can also be found in the other ones. Therefore, an absorption feature analogous to the one observed here must also be expected, e.g., in particle detectors using liquid xenon as the scintillating material.
Special care has always to be taken to avoid impurities. This is common knowledge as far as regular chemical rare gas purification is concerned. In the present paper it is shown that other rare gases, xenon in particular, lead to absorption bands, which in the case of xenon perfectly coincide with the emission band of argon. Therefore, it is important to test liquid argon used as scintillation material for the presence of this impurity.
5 Outlook
It may be worthwhile to explore the region near the wavelength cutoff of the present experiment (120 to 130 nm) with better statistics. A light source described in ref. Dandl emitting strongly in this region could be used for that purpose. Experiments with synchrotron radiation could also be considered Synchrotron . Critical opalescence (in dense gases), Rayleigh scattering (in general), and fluctuations of the index of refraction driven by temperature gradients etc. (in the liquid phase) will have to be considered in experiments with longer optical path lengths than that used in the present experiment.
Xenon and krypton added deliberately in well defined quantities could provide information about the absorption features of mixed Ar-Xe and Ar-Kr molecules and their absorption spectra. Absorption and emission experiments in the liquid and the gas phase could be performed for such a study. As an experimental improvement cryogenic baffles in front of the inner cell and cooled, e.g., to liquid helium temperature should be installed to avoid the degradation of the transmission of the inner cell’s optical windows by condensation of impurities from the insulating vacuum surrounding the inner cell.
Finally, we are aware of the fact that a setup in which monochromatic light would be used instead of the broadband emission of a deuterium lamp would be superior to the setup presented here because possible problems with fluorescence induced by the probe light could then be avoided. The light intensity at the exit of a monochromator, however, would have been too weak and the light would have had a divergence related to the aperture ratio of the monochromator, which would have required a much more complex optical setup. The issue of fluorescence will be tested in a separate experiment by trying to observe light through an additional window of the inner cell through which scattered or reemitted light can be observed at 90° with respect to the incident light.
Acknowledgements
We thank Roman Gernhäuser for kindly providing the gas system. This work was supported by funds of the Maier-Leibnitz-Laboratorium (Garching).
References
-
(1)
A. Hime (MiniCLEAN Collaboration),
arXiv:1110.1005v1 [physics.ins-det] (2011). - (2) K.S. Olsen, arXiv:0906.0348v1 [hep-ex] (2009)
- (3) A. Rubbia et al., J. Phys.: Conf. Ser. 39, 129 (2006)
- (4) A. Marchionni et al., J. Phys.: Conf. Ser. 308, 012006 (2011)
- (5) P. Benetti et al., arXiv:astro-ph/0701286v2 (2007)
-
(6)
A. Wright (DarkSide Collaboration),
arXiv:1109.2979v1 [physics.ins-det] (2011) -
(7)
L. Baudis (DARWIN consortium),
arXiv:1012.4764v1 [astro-ph.IM] (2009) -
(8)
M. Schumann (DARWIN consortium),
arXiv:1111.6251v1 [astro-ph.IM] (2011) - (9) C. Rubbia et al., JINST 6 P07011 (2011)
- (10) A. Rubbia, arXiv:hep-ph/0402110v1 (2004)
-
(11)
A.A. Smolnikov (GERDA Collaboration),
arXiv:0812.4194v1 [nucl-ex] (2008) - (12) N. Ishida et al., Nucl. Instrum. Meth. A 384, 380 (1997)
- (13) T. Heindl et al., EPL 91, 62002 (2010)
- (14) B. Raz and J. Jortner, Proc. Roy. Soc. A 317, 113 (1970)
- (15) J.B. Gerardo and A. W. Johnson, Phys. Rev. A 10, 4 (1974)
- (16) G.M. Seidel, R.E. Lanou, and W. Yao, Nucl. Instrum. Meth. A 489, 189 (2002)
- (17) Y. Ralchenko et al. (NIST ASD Team), National Institute of Standards and Technology, Gaithersburg, MD (2011)
- (18) T. Heindl et al., JINST 6, P02011 (2011)
-
(19)
A. Neumeier,
Diploma Thesis,
Technische Universität München (2012) - (20) P. Laporte et al., J. Opt. Soc. Am. 73, 8 (1983)
-
(21)
A. Bideau-Mehu et al.,
J. Quant. Spectrosc. Radiat. Transfer 25, 395 (1981) -
(22)
M. Antonello et al.,
Nucl. Instrum. Meth. A 516, 348 (2004) - (23) W. R. Hunter, ”Windows and Filters” in J. A. R. Samson and D. L. Ederer (Ed.) ”Vacuum Ultraviolet Spectroscopy I”, Academic Press San Diego, London, Boston, New York, Sydney, Toronto (1998)
- (24) A. Ulrich et al., Eur. Phys. J. Appl. Phys. 47, 22815 (2009)
-
(25)
T. Efthimiopoulos, D. Zouridis, and A. Ulrich,
J. Phys. D: Appl. Phys. 30, 1746 (1997) -
(26)
M. Blackman and N. D. Lisgarten,
Proc. Roy. Soc. 239, 93 (1957) -
(27)
R. Onaka and T. Takahashi,
J. Phys. Soc. Jap. 24, 548 (1968) - (28) T. Dandl et al., EPL 94, 53001 (2011)
- (29) T. Möller et al., Chem. Phys. Lett. 117, 301 (1985)