X-ray softening during the 2008 outburst of XTE J1810-189
Abstract
XTE J1810-189 underwent an outburst in 2008, and was observed over d by RXTE. Performing a time-resolved spectral analysis on the photospheric radius expansion burst detected on 2008 May 4, we obtain the source distance in the range of 3.5–8.7 kpc for the first time. During its outburst, XTE J1810-189 did not enter into the high/soft state, and both the soft and hard colours decreased with decreasing flux. The fractional rms remained at high values ( per cent). The RXTE/PCA spectra for 3-25 keV can be described by an absorbed power-law component with an additional Gaussian component, and the derived photon index increased from to when the unabsorbed X-ray luminosity in 3-25 keV dropped from ergs s-1 to ergs s-1. The relatively high flux, dense observations and broadband spectra allow us to provide strong evidence that the softening behaviour detected in the outburst of XTE J1810-189 originates from the evolution of non-thermal component rather than the thermal component (i.e. neutron star surface emission).
keywords:
accretion, accretion discs — stars: distances — stars: neutron — X-rays: bursts — X-rays: individual (XTE J1810-189)1 Introduction
X-ray binaries dominate the X-ray emission of our Galaxy, and hundreds of them have been detected in the Galaxy and the Magellanic Clouds (Liu et al. 2006, 2007). A low-mass X-ray binary (XRB) is a system in which a low-mass companion () feeds a black-hole (BH) or a weakly magnetized neutron star (NS) via Roche-lobe overflow. NS XRBs can be further classified into low luminosity atoll sources ( ) and high luminosity Z sources () according to their X-ray spectra and timing properties (Hasinger & van der Klis 1989; van der Klis 2006). Because BHs and NSs have similar gravitational fields, it is difficult to distinguish BH XRBs and NS XRBs unless type I X-ray bursts or coherent pulsations are detected.
Type I X-ray bursts are sudden energy release processes caused by unstable thermonuclear burning on the surface of NSs in XRBs (e.g. Lewin, van Paradijs & Taam 1993). The burst spectrum can be described well by a blackbody (BB) component. In the special class burst events, the so-called photospheric radius expansion (PRE) bursts, the peak X-ray luminosity reaches and remains at the local Eddington luminosity for a few seconds, during which the atmosphere is lifted up owing to strong radiation and the effective temperature decreases. At the moment of touchdown, the photosphere settles on the NS surface again, i.e. the radius derived from the BB normalization reaches a local minimum corresponding to the radius of a NS. Since the mass and surface red shift of NSs only vary in the narrow ranges, the Eddington luminosities measured from PRE bursts are good distance indicators (Basinska et al. 1984; Kuulkers et al. 2003).
The colour-colour diagram (CCD), in which both soft and hard colours are defined as the ratio of count rates between different energy bands, is particularly useful for characterizing the behaviour of NS XRBs (e.g., Muno, Remillard & Chakrabarty 2002). The complete CCD from atoll sources has a Z shape, consisting of, from top to bottom, the extreme island state, the island state, and the banana state (e.g., Gierliński & Done 2002). It has been suggested that, as accretion rates increase, atoll sources go through from the extreme island state to the banana state (e.g., Hasinger & van der Klis 1989). Following Lin, Remillard & Homan (2007), we describe the extreme island, island, banana states as low/hard, intermediate, and high/soft states, which are consistent with BH XRBs. Some observational phenomena indicate that the accretion rate might not monotonously increase when a source moves along the Z pattern, especially in the branch for the intermediate state (Galloway et al. 2008). The fast time variability, which can be characterized by the root mean square (rms), is another key tool for diagnosing accretion states in XRBs (e.g., Muñoz-Darias, Motta & Belloni 2011; Heil, Vaughan & Uttley 2012). The positive correlation between rms and hardness (or colour) is commonly observed in outbursts of both BH and NS XRBs (Lin et al. 2007; Muñoz-Darias et al. 2014). That is, XRBs have low variability when their radiation is dominated by thermal emission and vise versa (Belloni 2010). However, this correlation is not well explored below .
As already stated above, stellar-mass BHs and NSs have similar compactness; therefore, BH XRBs and NS XRBs share many spectral and temporal properties at high luminosity (; e.g., Done et al. 2007; Weng & Zhang 2011). Recently, much effort has been devoted to the differences between two classes of XRB at low luminosity (): (1) Compared to BH XRBs, NS XRBs are less radio loud at a given X-ray luminosity, or in the other words, BH XRBs have a lower X-ray radiative efficiency resulting from the advection-dominated accretion flows (Migliari & Fender 2006); (2) For the comparable accretion, NS XRBs are brighter than BH XRBs by a factor of , owing to additional emission from their solid surface (Narayan & McClintock 2008); (3) As the luminosity decreases, it has been proposed (Weng & Zhang 2011) that accretion discs in NS XRBs begin to leave the innermost stable circular orbit at higher luminosity, i.e. the discs are truncated by the NS magnetospheres at low luminosity; (4) At erg s-1, NS XRBs have softer spectra, probably arising from the soft thermal component emitted by NSs surface, which contributes a significant fraction of X-ray emissions (Wijnands et al. 2014).
XTE J1810-189 underwent an outburst in 2008 and was monitored by RXTE from 2008 March 19 to 2008 June 19. Markwardt, Strohmayer & Swank (2008) detected a type I X-ray burst from the source, identifying it as a NS XRB, and also put an upper limit for distance of kpc according to the peak flux of the type I X-ray burst. To date, the RXTE data have not been systematically analyzed in the literature. In Section 2, we estimate the interstellar hydrogen column density () with Swift/XRT data, measure the distance according to the mean peak flux of PRE burst detected by RXTE, and also evaluate the spectral evolution of the 2008 outburst of XTE J1810-189. We discuss these results in Section 3, and the summary follows in Section 4.
2 Data Analysis & Results
2.1 Estimate absorption column density using Swift data
Because RXTE/PCA is not sensitive to energies below 2 keV, the Swift/XRT spectra are analysed to constrain the absorption column density. Seven Swift pointing observations were made in 2008 March, and the other one was made on 2011 June 19. The initial event cleaning is performed with the task xrtpipeline with standard quality cuts. All XRT data were taken in photon-counting mode; however, all of them suffer from problems of pile-up because of high count rates 1.0-1.8 cts/s. We extract spectra within annular regions centered on the source position with the inner radius 6-8 pixels. The exposures maps are generated with xrtexpomap to correct for bad columns, the ancillary response files are produced with the task xrtmkarf, and the response matrix files (v014) are taken from the CALDB database. To ensure valid results using statistical analysis, the spectra are further grouped to have at least 30 counts per bin.
The Swift/XRT data in 2008 can be best fitted by an absorbed power-law model with the photon index in the range of 1.4–1.9; however, the poor statistics of the spectra do not permit two-component modelling. We fit these spectra simultaneously and link the hydrogen column density to have a common value, yielding cm-2 (Table 1), consistent with the value reported by Starling, Kennea & Krimm (2008). The spectrum for 2011 June 19 is very soft with , indicating that the emissions are dominated by the thermal component. Compared with the power-law model (), the absorbed blackbody (BB) model provides much better fits to the data (), and the obtained cm-2 is consistent with the results derived from the data in 2008. Thus, we adopt cm-2 for the following RXTE spectral analysis.
| Obs.ID | Obs-Date | /dof | |||
|---|---|---|---|---|---|
| 00031167001 | 2008-03-17 | 169.8/169 | |||
| 00306737000 | 2008-03-18 | … | … | ||
| 00031167002 | 2008-03-21 | … | … | ||
| 00031167003 | 2008-03-22 | … | … | ||
| 00031167004 | 2008-03-23 | … | … | ||
| 00031167005 | 2008-03-24 | … | … | ||
| 00031167006 | 2008-03-25 | … | … | ||
| 00455640000 | 2011-06-19 | 31.5/38 |
2.2 Properties of persistent emission
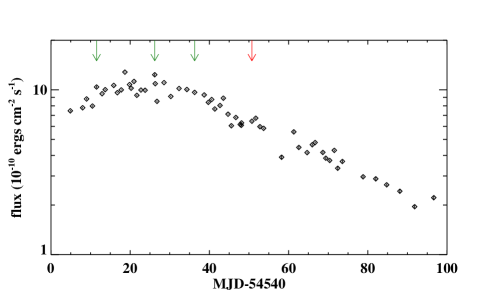
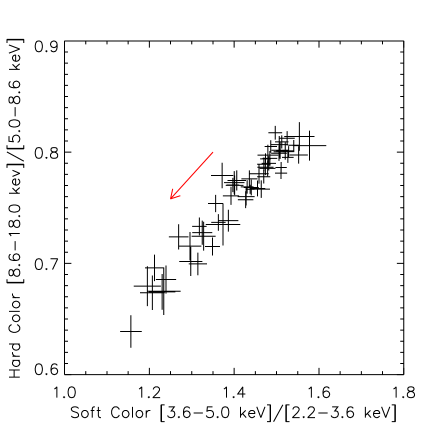
All 59 RXTE data of XTE J1810-189 taken by the Proportional Counter Array (PCA) are analysed with the FTOOLS software package version 6.13. The persistent emission, i.e. the X-ray emission when the type I X-ray bursts are not present, is extracted from the Standard2 data from the top layer of PCU2 with the standard criteria: the Earth-limb elevation angle is larger than and the spacecraft pointing offset is less than . The background files are created using the program pcabackest, while the latest bright background model is adopted for the first 43 observations and the faint background model is used for the last 16 observations, because the source count rate is less than 40 counts s-1 per PCU. Nevertheless, we checked that our results are not sensitive to the background model. Type I X-ray bursts are recorded in four observations (Fig. 1), in which the data of 300 s before and 1000 s after the type I X-ray bursts are excluded. The background-subtracted light curves are created and their count rates are averaged for each observation. The CCD of XTE J1810-189 is plotted in Fig. 2. We define the soft colour as the ratio of the count rates in the PCA channels of 9–11 (3.6–5.0 keV) and 0–8 (2.2–3.6 keV), and define the hard colour as the ratio of the count rates in the PCA channels of 21–43 (8.6–18.0 keV) and 12–20 (5.0–8.6 keV), respectively. In the 2008 outburst, the source evolved from the top right corner to the lower left corner, and both soft and hard colours were tightly correlated with the intensity (in 2.2–18.0 keV, Fig. 3).
The light curves, in the same PCA channels (0–43) as those used for producing the CCD, are extracted from the PCA Event mode data, E_125us_64M_0_1s for timing analysis. The power density spectra (PDS) are constructed using light curve segments of 32 s and 8 ms time bins with the task powspec (version 1.0). We adopt the method of Miyamoto to normalize the PDSs (Miyamoto, Kimura & Kitamoto 1991), and average them with the logarithmic rebin option -1.03 for each observation. The Poisson noise is subtracted (norm = -2), and the fractional rms is integrated over the 0.1–10 Hz frequency band. As can be seen in Fig. 3, XTE J1810-189 displays a high and nearly constant variability level ( per cent rms) during the outburst.

| Obs.ID | MJD | Exp.(s) | Flux | /dof | |
|---|---|---|---|---|---|
| 93044-07-03-00 | 54544.9 | 6080 | 100.5/45 | ||
| 93044-07-04-00 | 54548.0 | 1968 | 68.9/45 | ||
| 93044-07-04-01 | 54549.0 | 992 | 53.1/45 | ||
| 93044-07-04-02 | 54550.5 | 1248 | 30.6/45 | ||
| 93044-07-05-00 | 54552.9 | 2624 | 48.2/45 | ||
| 93044-07-05-01 | 54551.5 | 448 | 41.3/45 | ||
| 93044-07-06-00 | 54553.7 | 1232 | 42.5/45 | ||
| 93433-01-01-00 | 54555.9 | 2608 | 62.8/45 | ||
| 93433-01-01-01 | 54556.8 | 3184 | 85.1/45 | ||
| 93433-01-01-02 | 54557.8 | 3200 | 66.2/45 | ||
| 93433-01-01-03 | 54558.7 | 1376 | 31.6/45 | ||
| 93433-01-01-04 | 54559.8 | 2912 | 62.2/45 | ||
| 93433-01-02-00 | 54560.3 | 1232 | 72.3/45 | ||
| 93433-01-02-01 | 54561.0 | 1920 | 54.4/45 | ||
| 93433-01-02-02 | 54561.7 | 1408 | 47.7/45 | ||
| 93433-01-02-03 | 54562.7 | 2064 | 55.3/45 | ||
| 93433-01-02-04 | 54563.8 | 1440 | 50.8/45 | ||
| 93433-01-02-05 | 54566.2 | 320 | 50.0/45 | ||
| 93433-01-02-06 | 54566.3 | 1136 | 52.3/45 | ||
| 93433-01-02-07 | 54566.8 | 1376 | 61.9/45 | ||
| 93433-01-03-00 | 54568.6 | 2720 | 73.7/45 | ||
| 93433-01-03-01 | 54570.3 | 1952 | 49.4/45 | ||
| 93433-01-03-02 | 54572.3 | 3312 | 69.5/45 | ||
| 93433-01-04-00 | 54574.3 | 1552 | 49.2/45 | ||
| 93433-01-04-01 | 54576.3 | 1552 | 47.5/45 | ||
| 93433-01-04-02 | 54578.7 | 2896 | 88.7/45 | ||
| 93433-01-04-03 | 54579.8 | 1728 | 74.3/45 | ||
| 93433-01-04-04 | 54580.6 | 2288 | 56.2/45 | ||
| 93433-01-05-00 | 54581.4 | 1248 | 47.1/45 | ||
| 93433-01-05-01 | 54582.7 | 1664 | 64.2/45 | ||
| 93433-01-05-02 | 54583.5 | 1952 | 60.9/45 | ||
| 93433-01-05-03 | 54584.7 | 3040 | 68.0/45 | ||
| 93433-01-05-04 | 54585.6 | 2208 | 101.5/45 | ||
| 93433-01-05-05 | 54586.7 | 1760 | 56.8/45 | ||
| 93433-01-05-06 | 54587.8 | 3200 | 77.0/45 | ||
| 93433-01-06-00 | 54588.1 | 1280 | 64.4/45 | ||
| 93433-01-06-01 | 54588.1 | 1680 | 58.5/45 | ||
| 93433-01-06-02 | 54590.7 | 1824 | 45.8/45 | ||
| 93433-01-06-03 | 54591.7 | 3200 | 100.5/45 | ||
| 93433-01-06-04 | 54592.8 | 1312 | 48.5/45 | ||
| 93433-01-06-05 | 54593.7 | 2416 | 74.6/45 | ||
| 93433-01-07-00 | 54598.2 | 656 | 49.8/45 | ||
| 93433-01-07-02 | 54601.3 | 1184 | 42.8/45 | ||
| 93433-01-08-00 | 54602.6 | 1104 | 34.3/45 | ||
| 93433-01-08-01 | 54604.7 | 3184 | 55.3/45 | ||
| 93433-01-08-02 | 54606.7 | 3168 | 62.3/45 | ||
| 93433-01-08-03 | 54608.7 | 1664 | 59.8/45 | ||
| 93433-01-08-04 | 54606.0 | 1536 | 47.3/45 | ||
| 93433-01-09-00 | 54609.4 | 1392 | 40.0/45 | ||
| 93433-01-09-01 | 54610.4 | 2224 | 47.3/45 | ||
| 93433-01-09-02 | 54611.5 | 3200 | 61.5/45 | ||
| 93433-01-09-03 | 54612.4 | 1008 | 35.9/45 | ||
| 93433-01-09-04 | 54613.6 | 1408 | 48.8/45 | ||
| 93433-01-10-00 | 54618.8 | 2288 | 51.2/45 | ||
| 93433-01-10-02 | 54622.0 | 1296 | 41.2/45 | ||
| 93433-01-11-00 | 54624.8 | 2400 | 49.9/45 | ||
| 93433-01-11-01 | 54628.1 | 960 | 29.3/45 | ||
| 93433-01-12-00 | 54631.8 | 2432 | 49.3/45 | ||
| 93433-01-12-01 | 54636.7 | 1488 | 45.2/45 |
The response matrix files are created by the generator PCARMF (v11.7), and the recommended systematic error of is applied for the spectral analysis. The persistent emission is fitted for 3-25 keV by an absorbed power-law model with the fixed to cm-2. An additional Gaussian component is required to mimic an iron line at keV. This model adequately fits all spectra with the reduced values in the range . Only three observations with relatively long exposure time (observation IDs: 93044-7-03-00, 93433-01-05-04, and 93433-01-06-03) have the reduced larger than 2. The worse fits might be due to strong spectral fluctuation; therefore, we assign a typical relative error of to for these data (Table 2). The unabsorbed flux is calculated with the convolution model, cflux. As can be seen in Fig. 4, the spectra become softer when the X-ray flux decreases.

2.3 Evaluate source distance from PRE burst
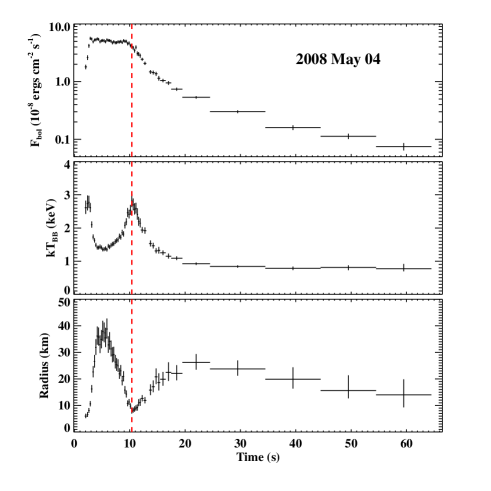
The PCA Event mode data are analysed to study the PRE burst detected on 2008 May 4 (observation ID = 93433-01-06-02). We extract the time-resolved spectra of PRE burst within a time bin size of 0.25 s around the burst peak, and use the longer integration time to compensate for the flux decay in the burst tail. Since the count rate of persistent emission is relatively low ( cts/s), we extract the spectrum from the whole observation in burst-free intervals to minimize the fluctuation, and the spectrum is used as the background for the PRE burst spectral modelling. The dead time effect is corrected following the approach suggested by the RXTE team 111http://heasarc.nasa.gov/docs/xte/recipes/pca_deadtime.html. The spectra are fitted by a BB model (phabs*bbodyrad in XSPEC), and the C statistic is used to accommodate low count rates. The fittings are generally performed over the energy range of 3-20 keV but concentrated to 3-18 keV or 3-15 keV to avoid unphysical parameters (mostly for the spectra at the late stage). For this observation, only PCU2 was on and channel 11 had zero counts; therefore, this channel is ignored in the fitting.
The derived parameters are plotted in Fig. 5, in which the red dashed lines mark the moment of touchdown. The bolometric flux of a burst is evaluated from the bbodyrad model as:
| (1) |
where is the BB temperature in units of keV, and is the normalization. The measured flux is lower than the locally observed value by a factor of due to the gravitational red shift, where the red-shift factor (Lewin et al. 1993). Because the photosphere is lifted up to higher radius (smaller ), the mean peak flux of PRE burst ergs cm-2 s-1 is slightly larger than the touchdown flux: ergs cm-2 s-1. Since there is only a small discrepancy between and , we adopt the standard process, i.e. using as the Eddington luminosity (from the NS surface) to minimize the fluctuation of spectral fitting.
We calculate the distance of XTE J1810-189 according to
| (2) | |||
given by Galloway et al. (2008), where is the mass of NS and is the hydrogen mass fraction in the atmosphere. Assuming the typical values , (for and km), and (cosmic abundances), we obtain kpc, that is significantly smaller than the upper limit ( kpc) reported by Markwardt et al. (2008).
3 Discussions
Fig. 3 shows that both the soft and hard colours decrease as the flux decays, and the fractional rms remains at per cent. Even though the values of both colours are consistent with an intermediate state, both the low luminosity and the strong variability point to a low/hard state for the atoll source. Accretion states of XRBs have been well explored at high luminosity, and colour variations are interpreted as the coevolution of both thermal and non-thermal components. Generally, compared to cases in the high/soft state, the accretion disc in the low/hard state is cooler, the power-law component becomes harder (smaller ), and the power-law fraction increases (e.g. Dunn et al. 2010; Muñoz-Darias et al. 2013). However, a study of the spectral evolution at low luminosity, when the contribution of accretion disc is negligible, is challenged by the low flux. Currently, collecting a sample of spectra at 0.5–10 keV for NS XRBs (i.e. taken from Chandra/XMM-Newton/Swift), Wijnands et al. (2014) suggested that the photon index increases with decreasing X-ray luminosity between and ergs s-1, and BH XRBs have significantly harder spectra at the same luminosity (Armas Padilla et al. 2011; Plotkin, Gallo & Jonker 2013). However, because of the sparse data points for each source and large scatters on , the anti-correlation between and the X-ray luminosity is relatively weak. Moreover, it is difficult to reveal the nature of spectral softening with the limited band spectra (0.5–10 keV), and two possible scenarios have been proposed (see also Allen et al. 2015): (1) The thermal emission from the NS surface becomes the major component at the low luminosity. (2) The power-law component softens as the X-ray luminosity decrease to erg s-1, below which the thermal component and another harder power-law component start to overcome the original power-law emission.
In this work, we reveal that the significant softening process occurs in the 2008 outburst of XTE J1810-189 in the flux range of ergs cm-2 s-1, which is well above the PCA background level. Since the PCA spectra in 3–25 keV provide a good constraint on the power-law component, the tight correlation between and the X-ray luminosity with the dense RXTE observations is found in Fig. 4. Fitting all these data with the function using the error of as the weight, we obtain the coefficients: , . The source has at ergs s-1, that is softer than spectra of most BH XRBs at the same luminosity.
To check whether the softening spectra result from a larger contribution of NS surface emissions, we refit the data using the model with an additional BB component included (phabs*(powerlaw+bbodyrad+gau) in XSPEC). Because RXTE/PCA is not sensitive at the energy band below 3 keV, the surface temperature is allowed to vary, but restricted to below 5 keV to avoid unphysical parameters (Table 3). As can be seen, the thermal component only contributes a small fraction () of the total flux and becomes cooler as the flux decays. Since the main part of BB component with keV is out of the coverage of PCA, its unabsorbed flux in 3–25 keV is less constrained. When the thermal component is added, the non-thermal component becomes slightly harder with a larger error in . Nonetheless, the softening trend still emerges in the fitting; that is, increases from to . The high and constant variability levels indicate that the emissions in 3–25 keV are dominated by the non-thermal component, and the fractional contribution of the thermal component does not increase with decreasing flux. Note that the model’s independent parameter, the hard colour ((8.6–18.0)/(5.0–8.6) keV) also decreases following the flux decays (Fig. 3). Therefore, we demonstrate that the softer spectra at lower luminosity are caused by the softening of the power-law component.
The largest uncertainty in our results arises from the distance of the source, which depends on , (), and the composition of accretion material . The caveats for using PRE bursts as the distance indicator are: (1) The Eddington luminosities vary from source to source (Kuulkers et al. 2003) and (2) even in the same source, PRE bursts could reach different peak fluxes due to the variation of burst fuel composition (Galloway et al. 2008). Assuming that , , and are uniformly distributed in the typical range of , km (e.g. Lattimer & Prakash. 2007; Steiner, Lattimer & Brown 2010), and , respectively, while ergs cm-2 having a normal distribution, we randomly generate 100 points for each parameters, then calculate of according to Equation (2). The simulated has values in the range of kpc, and the Gaussian fit to the profile of its distribution indicates kpc. Thus, we suggest that the used above could vary by a factor of 3 at most, which would not change our conclusions.
| Obs.ID | MJD | (keV) | Flux | /dof | ||
|---|---|---|---|---|---|---|
| 93044-07-03-00 | 54544.9 | 38.1/43 | ||||
| 93044-07-04-00 | 54548.0 | 33.7/43 | ||||
| 93044-07-04-01 | 54549.0 | 47.6/43 | ||||
| 93044-07-04-02 | 54550.5 | 22.7/43 | ||||
| 93044-07-05-00 | 54552.9 | 28.0/43 | ||||
| 93044-07-05-01 | 54551.5 | 33.6/43 | ||||
| 93044-07-06-00 | 54553.7 | 30.4/43 | ||||
| 93433-01-01-00 | 54555.9 | 34.7/43 | ||||
| 93433-01-01-01 | 54556.8 | 42.5/43 | ||||
| 93433-01-01-02 | 54557.8 | 38.9/43 | ||||
| 93433-01-01-03 | 54558.7 | 23.9/43 | ||||
| 93433-01-01-04 | 54559.8 | 36.0/43 | ||||
| 93433-01-02-00 | 54560.3 | 34.7/43 | ||||
| 93433-01-02-01 | 54561.0 | 28.7/43 | ||||
| 93433-01-02-02 | 54561.7 | 27.1/43 | ||||
| 93433-01-02-03 | 54562.7 | 40.6/43 | ||||
| 93433-01-02-04 | 54563.8 | 34.9/43 | ||||
| 93433-01-02-05 | 54566.2 | 45.3/43 | ||||
| 93433-01-02-06 | 54566.3 | 30.8/43 | ||||
| 93433-01-02-07 | 54566.8 | 41.8/43 | ||||
| 93433-01-03-00 | 54568.6 | 25.2/43 | ||||
| 93433-01-03-01 | 54570.3 | 35.5/43 | ||||
| 93433-01-03-02 | 54572.3 | 38.1/43 | ||||
| 93433-01-04-00 | 54574.3 | 27.8/43 | ||||
| 93433-01-04-01 | 54576.3 | 35.4/43 | ||||
| 93433-01-04-02 | 54578.7 | 20.6/43 | ||||
| 93433-01-04-03 | 54579.8 | 30.8/43 | ||||
| 93433-01-04-04 | 54580.6 | 37.8/43 | ||||
| 93433-01-05-00 | 54581.4 | 34.8/43 | ||||
| 93433-01-05-01 | 54582.7 | 40.1/43 | ||||
| 93433-01-05-02 | 54583.5 | 27.0/43 | ||||
| 93433-01-05-03 | 54584.7 | 45.0/43 | ||||
| 93433-01-05-04 | 54585.6 | 62.3/43 | ||||
| 93433-01-05-05 | 54586.7 | 37.7/43 | ||||
| 93433-01-05-06 | 54587.8 | 24.3/43 | ||||
| 93433-01-06-00 | 54588.1 | 32.5/43 | ||||
| 93433-01-06-01 | 54588.1 | 40.0/43 | ||||
| 93433-01-06-02 | 54590.7 | 20.1/43 | ||||
| 93433-01-06-03 | 54591.7 | 37.1/43 | ||||
| 93433-01-06-04 | 54592.8 | 20.2/43 | ||||
| 93433-01-06-05 | 54593.7 | 33.2/43 | ||||
| 93433-01-07-00 | 54598.2 | 35.1/43 | ||||
| 93433-01-07-02 | 54601.3 | 23.3/43 | ||||
| 93433-01-08-00 | 54602.6 | 22.7/43 | ||||
| 93433-01-08-01 | 54604.7 | 38.0/43 | ||||
| 93433-01-08-02 | 54606.7 | 38.5/43 | ||||
| 93433-01-08-03 | 54608.7 | 44.7/43 | ||||
| 93433-01-08-04 | 54606.0 | 32.1/43 | ||||
| 93433-01-09-00 | 54609.4 | 23.2/43 | ||||
| 93433-01-09-01 | 54610.4 | 26.9/43 | ||||
| 93433-01-09-02 | 54611.5 | 26.2/43 | ||||
| 93433-01-09-03 | 54612.4 | 31.9/43 | ||||
| 93433-01-09-04 | 54613.6 | 34.0/43 | ||||
| 93433-01-10-00 | 54618.8 | 26.4/43 | ||||
| 93433-01-10-02 | 54622.0 | 26.0/43 | ||||
| 93433-01-11-00 | 54624.8 | 35.2/43 | ||||
| 93433-01-11-01 | 54628.1 | 24.5/43 | ||||
| 93433-01-12-00 | 54631.8 | 29.9/43 | ||||
| 93433-01-12-01 | 54636.7 | 34.3/43 |
4 Summary
Investigating the X-ray archival data, we determined the distance of XTE J1810-189 as 3.5–8.7 kpc via the PRE burst for the first time. The source presents some peculiar X-ray behaviours, which distinguish it from most other NS XRBs: (1) During the 2008 outburst, XTE J1810-189 did not enter into the high/soft state, and moved steadily from the top right corner to the lower left corner in the CCD as the accretion rate decreased, as if the X-ray luminosity were proportional to the accretion rate; (2) The source is highly variable, and the fractional rms remains at a nearly constant level of per cent with evolving spectra; (3) Both soft and hard colours increase with the intensity. As the X-ray luminosity decreased from ergs s-1 to ergs s-1, the X-ray spectra became softer with the photon index increasing from to . The dense observations, relatively high flux and broadband spectra allow us to provide the strong evidence for softening of the non-thermal component (rather than NS surface emissions as suggested in literature) at low luminosity. Our results also confirm that NS XRBs have softer spectra below erg s-1 than those of BH XRBs, indicating there are different accretion mechanisms in two classes of XRBs, probably due to the boundary layer existing in NS XRBs.
Acknowledgements
We thank the referee for helpful comments which significantly improved this work. We are grateful to Long Ji for help discussions on type I X-ray burst data analysis. This work is partially supported with funding by 973 Program of China under grant 2014CB845802, the National Natural Science Foundation of China under grants 11133002, 11373036, and 11303022, the Qianren start-up grant 292012312D1117210, and by the Strategic Priority Research Program “The Emergence of Cosmological Structures” of the Chinese Academy of Sciences, Grant No. XDB09000000. S.S.W. is funded by the Co-Circulation Scheme, supported by the EC-FP7 Marie Curie Actions-People-COFUND and TÜBİTAK.
References
- [] Allen, J. L., Linares, M., Homan, J., & Chakrabarty, D. 2015, ApJ, 801, 10
- [] Armas Padilla, M., Degenaar, N., Patruno, A., Russell, D. M., Linares, M., Maccarone, T. J., Homan, J., Wijnands, R., 2011, MNRAS, 417, 659
- [] Basinska, E. M., Lewin,W. H. G., Sztajno, M., Cominsky, L. R.,& Marshall, F. J. 1984, ApJ, 281, 337
- [] Belloni T. M., 2010, in Belloni T., ed., The Jet Paradigm C From Micro- quasars to Quasars. Lect. Not. Phys., 794, 53. Springer Verlag, Berlin
- [] Done, C., Gierliński M., & Kubota, A. 2007, A&ARv, 15, 1D
- [] Dunn R. J. H., Fender R. P., Körding E. G., Belloni T., Cabanac C., 2010, MNRAS, 403, 61
- [] Galloway, D. K., Muno, M. P., Hartman, J. M., Psaltis, D., Chakrabarty, D., 2008, ApJS, 179, 360
- [] Gierliński, M. & Done, C. 2002, MNRAS, 337, 1373
- [] Hasinger, G., & van der Klis, M. 1989, A&A, 225, 79
- [] Heil L. M., Vaughan S., Uttley P., 2012, MNRAS, 422, 2620
- [] Kuulkers, E., den Hartog, P. R., in’t Zand, J. J. M., Verbunt, F. W. M., Harris, W. E., Cocchi, M., 2003, A&A, 399, 663
- [] Lewin, W. H. G., van Paradijs, J., & Taam, R. E. 1993, Space Sci. Rev., 62, 223
- [] Lattimer, J. M., & Prakash, M. 2007, Phys. Rep., 442, 109
- [] Lin, D., Remillard, R. A., & Homan, J. 2007, ApJ, 667, 1073
- [] Liu, Q. Z., van Paradijs, J., & van den Heuvel, E. P. J. 2006, A&A, 455, 1165
- [] Liu, Q. Z., van Paradijs, J., & van den Heuvel, E. P. J. 2007, A&A, 469, 807
- [] Markwardt, C. B., Strohmayer, T. E., & Swank, J. H. 2008, Astron. Telegram, 1443, 1
- [] Migliari. S., & Fender, R. P., 2006, MNRAS, 366, 79
- [] Miyamoto S., Kimura K., & Kitamoto S., 1991, ApJ, 383, 784
- [] Muno, M. P., Remillard, R. A., & Chakrabarty, D. 2002, ApJL, 568, L35
- [] Muñoz-Darias, T., Coriat, M., Plant, D. S., Ponti, G., Fender, R. P., Dunn, R. J. H., 2013, MNRAS, 432, 1330
- [] Muñoz-Darias, T., Fender, R. P., Motta, S. E., Belloni, T. M. 2014, MNRAS, 443, 3270
- [] Muñoz-Darias, T., Motta, S. E., Belloni, T. M. 2011, MNRAS, 410, 679
- [] Narayan, R., & McClintock, J.E. 2008, New Astron. Rev., 51, 733
- [] Plotkin, R. M., Gallo, E., & Jonker, P. G. 2013, ApJ, 773, 59
- [] Starling, R., Kennea, J., & Krimm, H. 2008, Astron. Telegram, 1441, 1
- [] Steiner, A. W., Lattimer, J. M., & Brown, E. F. 2010, ApJ, 722, 33
- [] Weng, S. S., & Zhang, S. N. 2011, ApJ, 739, 42
- [] Wijnands, R., Degenaar. N., Armas Padilla M., Altamirano, D., Cavecchi, Y., Linares, M., Bahramian, A., Heinke, C. O., 2014, arXiv:1409.6265
- [] van der Klis, M. 2006, in Compact Stellar X-ray Sources, ed. W. Lewin & M. van der Klis (Cambridge: Cambridge Univ. Press), 39