Specific heat measurement of thin suspended SiN membrane from 8 K to 300 K using the 3-Vlklein method
Abstract
We present a specific heat measurement technique adapted to thin or very thin suspended membranes from low temperature (8 K) to 300 K. The presented device allows the measurement of the heat capacity of a 70 ng silicon nitride membrane (50 or 100 nm thick), corresponding to a heat capacity of 1.4x10⁻¹⁰ J/K at 8 K and 5.1x10⁻⁸ J/K at 300 K. Measurements are performed using the 3 method coupled to the Vlklein geometry. This configuration allows the measurement of both specific heat and thermal conductivity within the same experiment. A transducer (heater/thermometer) is used to create an oscillation of the heat flux on the membrane; the voltage oscillation appearing at the third harmonic which contains the thermal information is measured using a Wheatstone bridge set-up. The heat capacity measurement is performed by measuring the variation of the 3 voltage over a wide frequency range and by fitting the experimental data using a thermal model adapted to the heat transfer across the membrane. The experimental data are compared to a regular Debye model; the specific heat exhibits features commonly seen for glasses at low temperature.
I Introduction
The study of thermal phenomena at the nanoscale has received great attention in the recent years due to the remarkable properties that differ significantly from their bulk counterparts A.D.McConnell2005 . When the microstructural length scales of a material become comparable to the mean free path of the phonon, surfaces start to influence the overall thermal transport Cahill2003 ; Kim2006 . These specific thermal properties can be of great use in various applications such as thermoelectricity or more generally energy conversion devices Hicks1993 ; Shakouri2011 . Apart from the technological considerations, the study of thermal properties at the nanoscale presents fundamental questions related to the interaction of heat transfer and microstructure at these small length scales: effect on the mean free path prbheron ; condmat , on the dispersion relations and then on the average phonon group velocities etc… cuffe . These effects are also of great interest in amorphous materials like silicon nitride, a material having large potential device applications due to its low thermal conductivity Zink2004 ; Revaz2005 ; Pohl2002 ; zink2013 .
Accurately tailoring the thermal properties of nanoscale systems requires the fabrication of very small samples. Hence, innovative techniques able to measure accurately the reduced values of the thermal properties are a growing need. The measurement of thermal transport properties in thin films has been improved significantly in recent years.
The 3 method is generally used to measure the thermal conductivity of semi-infinite materials F1990 . It has been also shown in the past that this technique based on a dynamic measurement can be used to extract the specific heat Birge1987 . However, this has never been demonstrated on a membrane system.
Here by coupling the 3 method Cahill1990 and the Vlklein geometry Voelklein2013 (elongated suspended membrane), we present a system designed to measure the specific heat of silicon nitride suspended membrane (50 nm and 100 nm thick) over a wide temperature range (8 to 300 K). This work is an extension of the recently proposed device to measure the thermal conductivity jain ; Sikora2012 ; Sikora2013 . The major advantage of the proposed technique comes from the concomitant measurement of the two important thermal properties of materials: the thermal conductivity () and the specific heat () by the measurement at different thermal excitation frequencies on the same sample; low frequency for and high frequency for . Although less sensitive, this technique offers possibilities that cannot be obtained easily from classical specific heat measurement like ac calorimetry bourg1 ; Lopeandia2010 ; rydh , fast scanning calorimetry viejo or relaxation calorimetry Revaz2005 .
II Experimental
The principle of the method consists in creating a sinusoidal Joule heating generated by an a.c. electrical current of frequency across a transducer centered along the long axis of a rectangular membrane. The center of the membrane is thermally isolated from the frame and hence its temperature is free to increase. The temperature oscillation of the membrane is at 2 and is directly related to its thermal properties by its amplitude and frequency respectively. By measuring the voltage appearing across the transducer, it is possible to deduce the thermal conductivity and the specific heat of the membrane. The transducer is made out of a material whose resistance is strongly temperature dependant. It serves as a thermometer and heater at the same time.
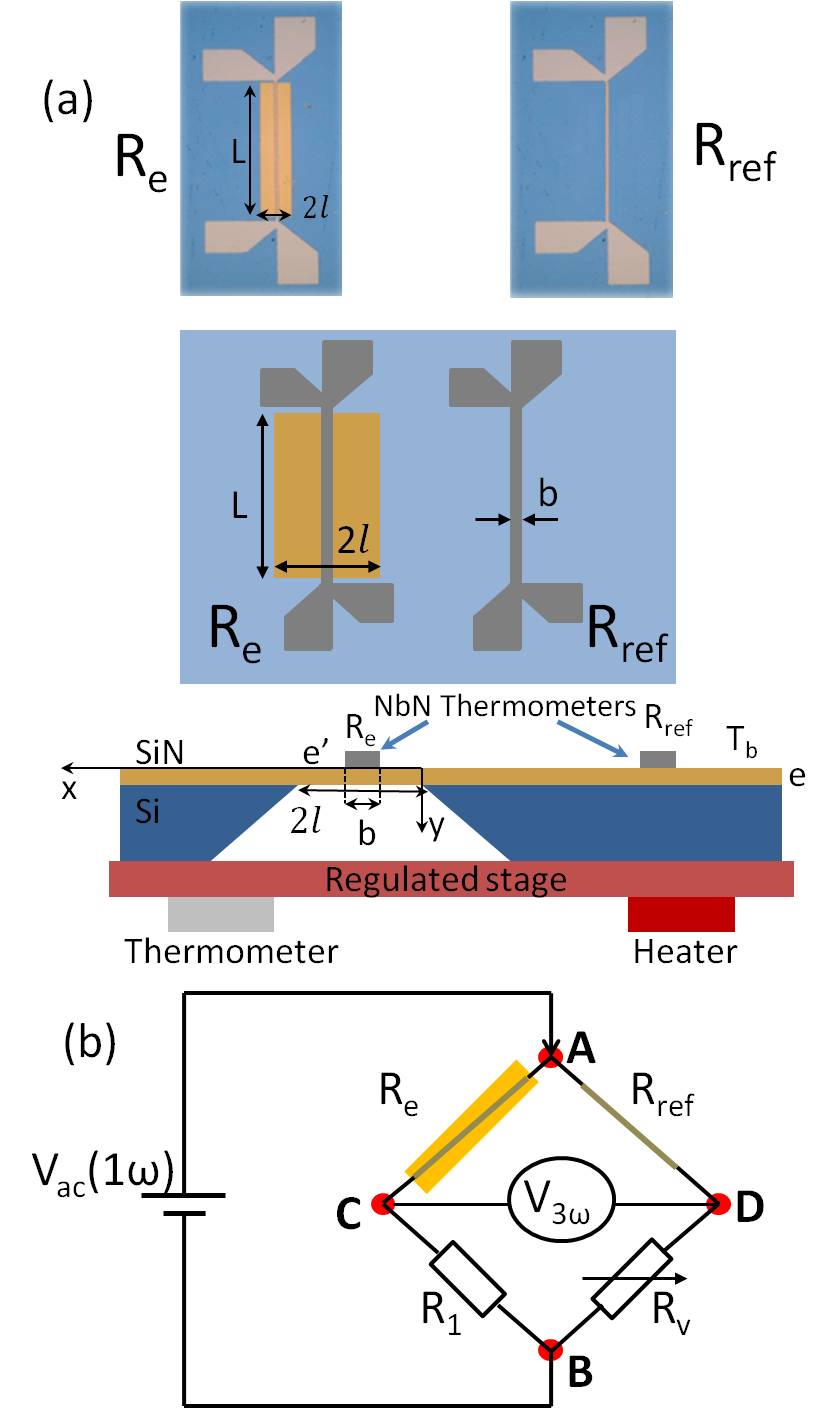
However, the measured voltage across the transducer include the ohmic component which is usually larger than the thermal component by a factor of 103.
By using a specific Wheatstone bridge Birge1987 we strongly reduce the component of the measured voltage at angular frequency 1. The bridge consists of the measured sample with its respective resistor , which is the niobium nitride (NbN) thermometer on the SiN membrane, the reference thermometer deposited on the bulk region of the chip which has the same geometry and deposited in the same run as the transducer on the membrane (see Fig. 1), an adjustable resistor , and an equivalent nonadjustable resistor = 50 kOhm. The two resistors and are positioned outside the cryogenic system. (see more details about the electrical set-up in the reference Sikora2012 , Sikora2013 ). Since the reference thermometer is not on the membrane, its temperature remains at the bath temperature and therefore, its resistance does not change. The elevation of temperature due to self-heating of the reference transducer is neglected thanks to the thermal contact to the quasi-infinite reservoir of the bulk silicon.
In that geometry, the voltage at 1 has been reduced by a factor of 103. Thus, it is possible to measure the signal with a high sensitivity on the Wheatstone bridge output without the 1 component saturating the dynamic reserve of the lock-in amplifier.
The two NbN thermometers (Nb1N1.7) have practically the same temperature behavior as they have been deposited simultaneously on the SiN substrate. However, due to the presence of inhomogeneity in the deposition process, there is a slight difference of resistance. Thus, the resistor is used to balance the bridge. Thanks to the Wheatstone bridge, the signal is larger than the signal.
The geometry of the membrane measured in this study is the following: 300m wide and 1.5 mm long; the transducers that are patterned using regular clean room processes are centered along the main axis and have various widths: 5, 20, 30 and 40m. They are made of NbN thin film that are grown using a dc-pulsed magnetron sputtering from a high purity niobium target in a gas mixture of argon and nitrogen. This type of high sensitivity thermometer is described in detail in Ref. Bourgeois2006 Its temperature coefficient of resistance (TCR) can be tailored over a wide temperature range, from low temperature Heron2009a to high temperature Lopeandia2010 . Hence, depending on the stoichiometry, the electrical properties of the NbN can vary a lot. For the SiN measurement, the thermometer has been designed for the 10 K to 320 K temperature range. Typically, the resistance of the thermometer is about 100 kOhm at room temperature with a TCR of 10-2 K-1 and 1 MOhm at 70 K with a TCR of 0.1 K-1. The resistance of the thermometer on the membrane is calibrated using a standard four probe technique between 4 K and 330 K in a 4He cryostat. The devices in the cryogenic vacuum are protected by a thermal copper shield maintained at the temperature to reduce the heat radiation and installed on a temperature regulated stage as schematized in the Fig. 1. The stage temperature is regulated with a stability of the order of few milliKelvin. The stage temperature may be varied from 4 K to more than 330 K.
III General solution of heat flow
The NbN thermometer is calibrated in a four-probe configuration (see Fig. 1). The two outside contacts are used to apply an ac current while the voltage is measured by the two inside contacts. As the membrane is suspended, its temperature is free to fluctuate. The specimen is maintained in a high vacuum and the whole setup is heat shielded to the substrate temperature to minimize heat losses through gas convection and radiation. Thus, in such configuration and with an ac electrical current of the form sin(t) passing through the specimen, the 1D partial differential equation of the heat flux across the membrane is given by:
| (1) |
with the initial and boundary conditions:
| (2) |
with the specific heat, the density, the diffusivity of the SiN membrane, and the thermal conductivity. The total dissipated power is used to heat both the thermometer and the part of the membrane under the thermometer, and the rest of the membrane:
The general solution of Eq. 1 is:
| (3) |
with , =, = and . We can also write Eq. 3 using exponential notation:
| (4) |
with the phase and the absolute value of the denominator of Eq. 3. After development in Taylor expansion to first order in , the expression of the absolute value of the temperature can be written as follows:
| (5) |
with =, = and the thermal diffusivity. The general form of the voltage across the thermometer, is given by :
with the current flowing through the thermometer. Then, the general expression of the voltage, between A and C, can be written as follows:
| (6) |
with the voltage put on the Wheatstone bridge (between A and B), the thermal phase.
The absolute value of is given by:
| (7) |
and the phase by:
| (8) |
Then the general expression of becomes:
| (9) |
The thermal conductivity can be extracted simultaneously using the same fit. The extracted specific heat values from the 1D and 2D models show very comparable results. A difference of 0.8 is observed. Thus, in the following the 1D model is used for the sake of simplicity.
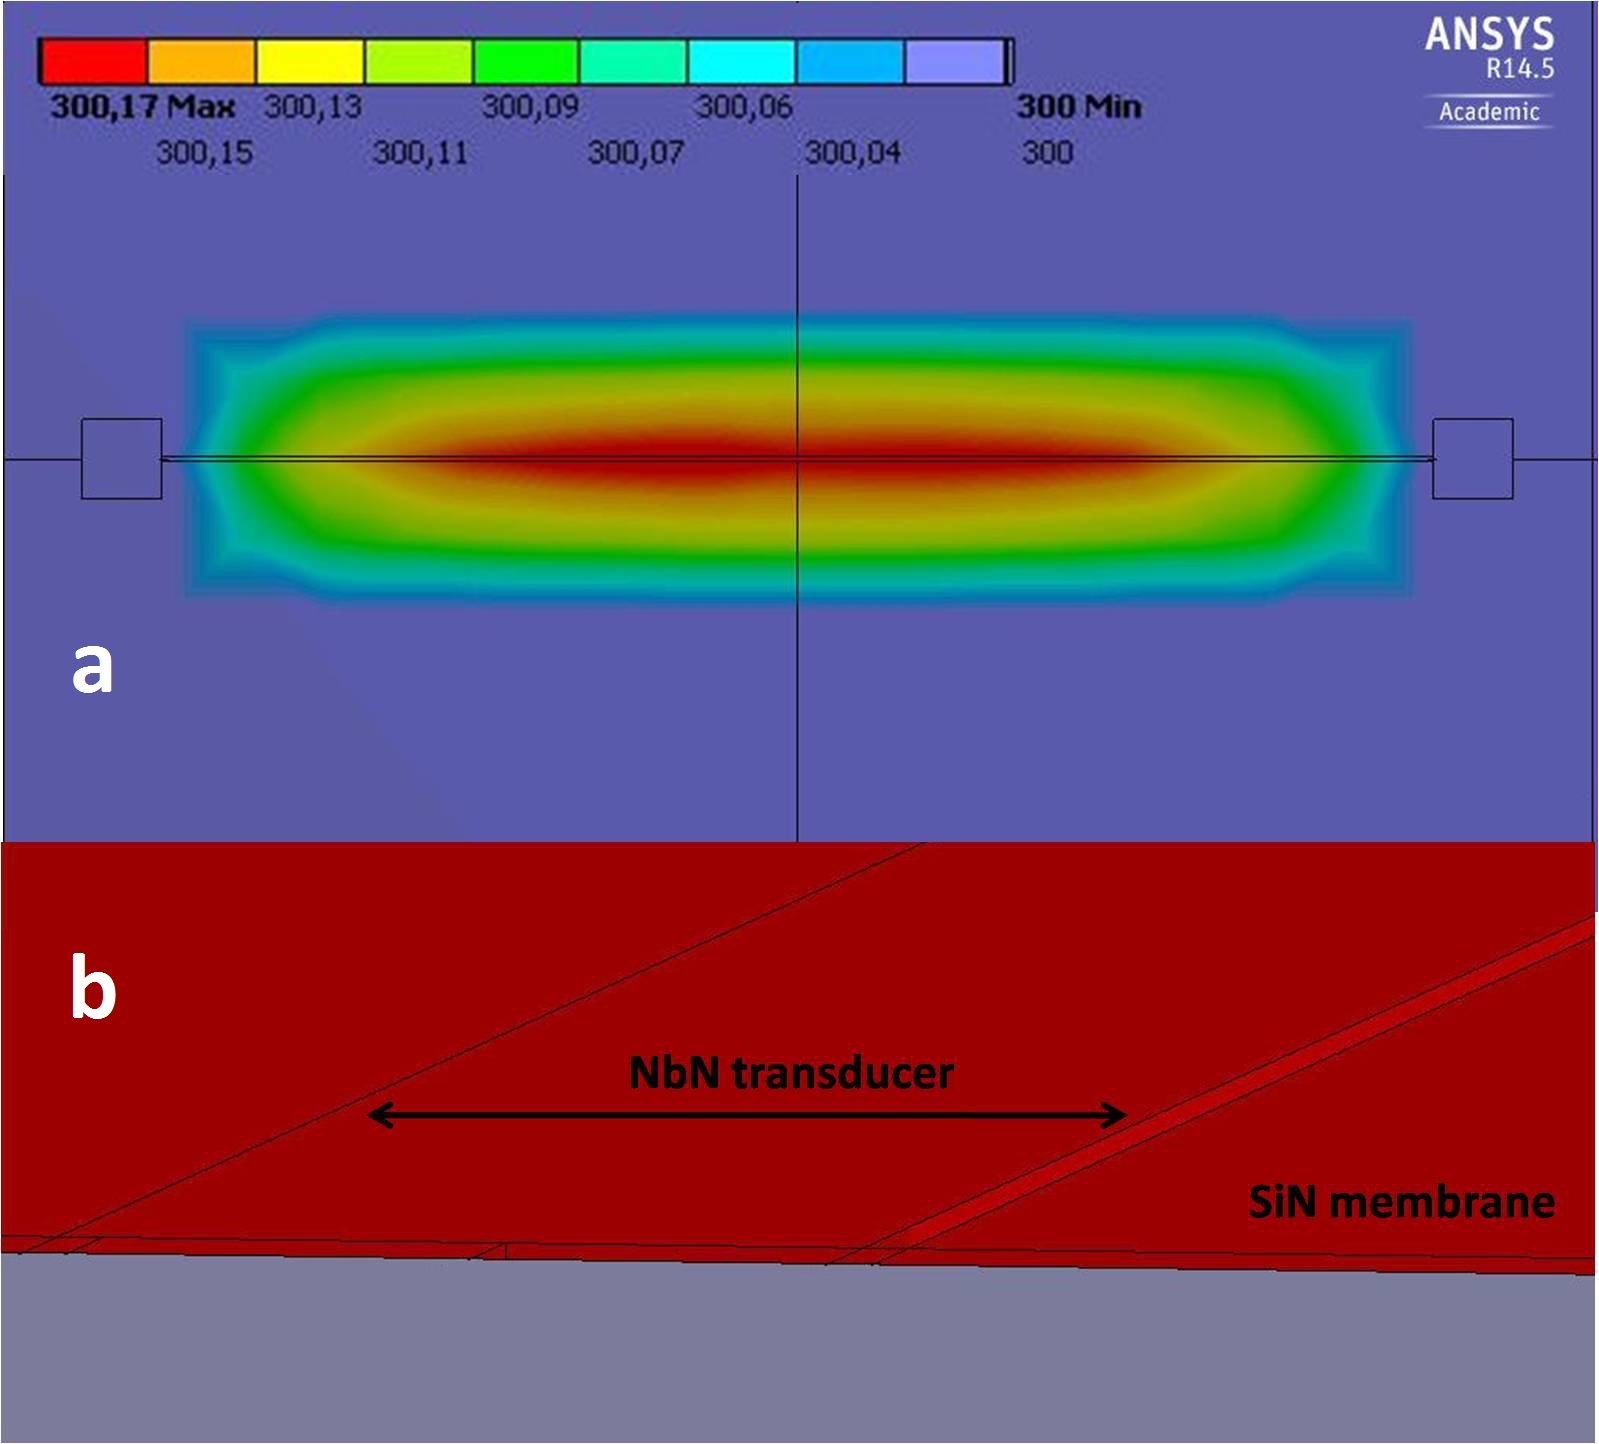
Finite element simulations have been performed to confirm this assumption unsing the ANSYS platform ansys . Results are displayed on Fig. 2. Heat flows from the transducer to the quasi-infinite reservoir of the bulk silicon. Except at the edges of the membrane the temperature along the heater is nearly the same. We can also verify on Fig. 2 that the temperature is uniform over the membrane thickness confirming the assumption made for analytical calculations.
IV Results and discussion
IV.1 Specific heat measurement
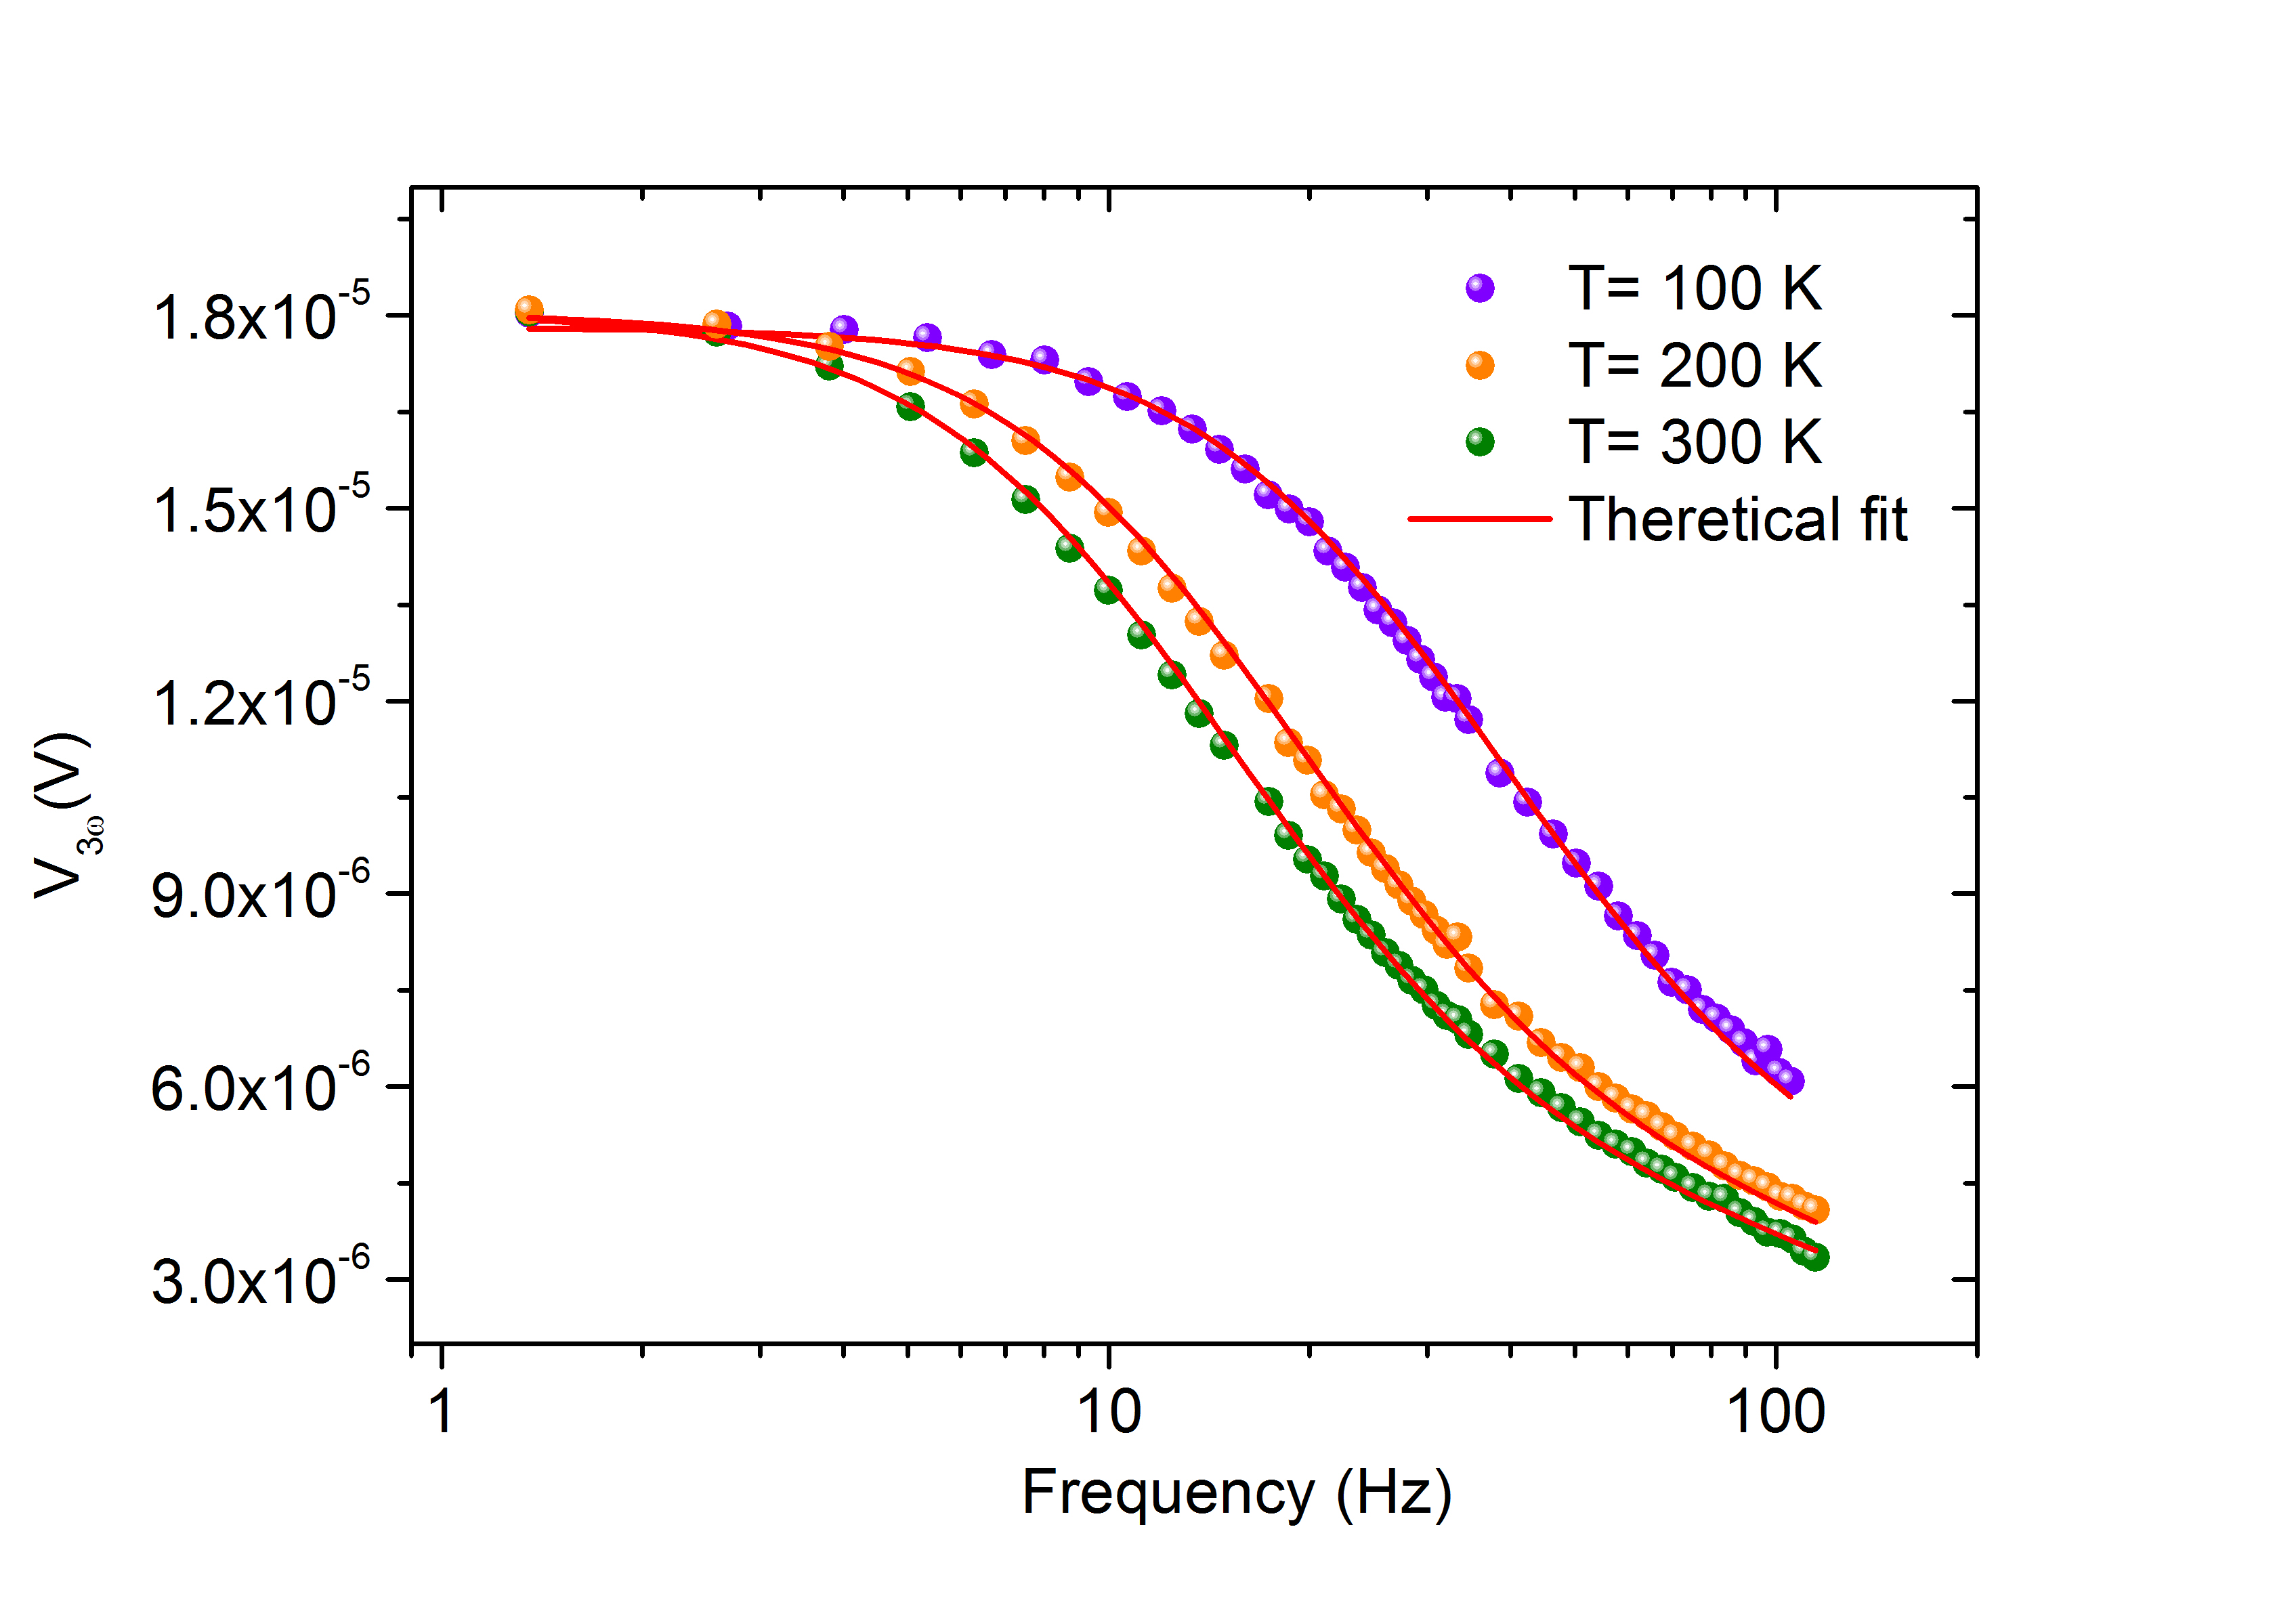
At fixed temperature, the specific heat of the membrane is extracted by fitting the 3 voltage data versus the frequency using Eq. 9. The thermal cut-off frequency increases when the temperature drops down as shown in Fig. 3. To assure that the frequency dependence of the 3 comes only from thermal origin and there are no electrical dependencies, we assume that the two thermometers present an electrical capacitance. By fitting the 1 Wheatstone output voltage using the electrical model explained in the previous publication Sikora2012 , Sikora2013 , we are able to estimate this capacitance to be around hundred picofarad and then can not affect the thermal frequency cut-off above 1 kHz, which is above the frequency measurement range (1 to 100 Hz). A geometrical effect of the thermometer width on the thermal frequency cut-off was observed, this effect is discussed in detail in the following section.
IV.2 Effect of a finite transducer width
The effect of a finite transducer width has been studied by the measurement of the 3 voltage at fixed temperature using different thermometer width. Different measurements have been performed at the same temperature on four distinct samples exhibiting a large difference in thermal frequency cut-off of the 3 voltage (see Fig. 4).

The thermal properties obtained from the theoretical fit are mentioned in Table. 1. The length of the thermometer is 1500 .
| Sample | b() | k(W/(m.K)) | C(J/(g.K)) |
|---|---|---|---|
| 1 | 5 | 3.190 | 0.698 |
| 2 | 20 | 2.980 | 0.710 |
| 3 | 30 | 3.230 | 0.786 |
| 4 | 40 | 3.470 | 1.155 |
The extracted thermal conductivity values present a small variation when the thermometer width increases. When the thermometer width is multiplied by a factor of eight, the extracted thermal conductivity varies at most by 10 , which is a weak effect. This effect can be explained by the fact that when the width of the thermometer becomes large as compared to the width of the membrane, a gradient of temperature between the centre and its extremity appears and thus cannot be considered like a finite line oscillating at the same temperature to solve the heat transfer equation.
On the other hand, a significant effect of the thermometer width change on the specific heat values was observed. An increase of 65 was observed when the thermometer width is multiplied by a factor of eight. This observation is discussed in terms of the thermal penetration depth dependence with the frequency. At low frequency, the entire membrane oscillates at the same temperature with the frequency 2 where the thermal penetration depth (with D the thermal diffusivity) is larger than the dimension of the membrane. When the frequency increases, begins to decrease affecting the overall temperature oscillation of the membrane. At sufficient high frequency, becomes comparable to thermometer width and then the 3 voltage becomes sensitive to the specific heat of the thermometer and the SiN membrane underneath (see Table. 1). At 100 Hz, the thermal penetration depth is estimated to be around 55 m. In the following, the measurements are performed with a thermometer of 5 m width; the extracted specific heat values are in perfect agreement with the ones extracted from the experiment done with a thermometer having a width of 20 m. As a conclusion for this part of the study, in order to do a safe experiment, a ratio of at least ten between the width of the membrane and the width of the thermometer has to be respected.
IV.3 Specific heat of the SiN membrane
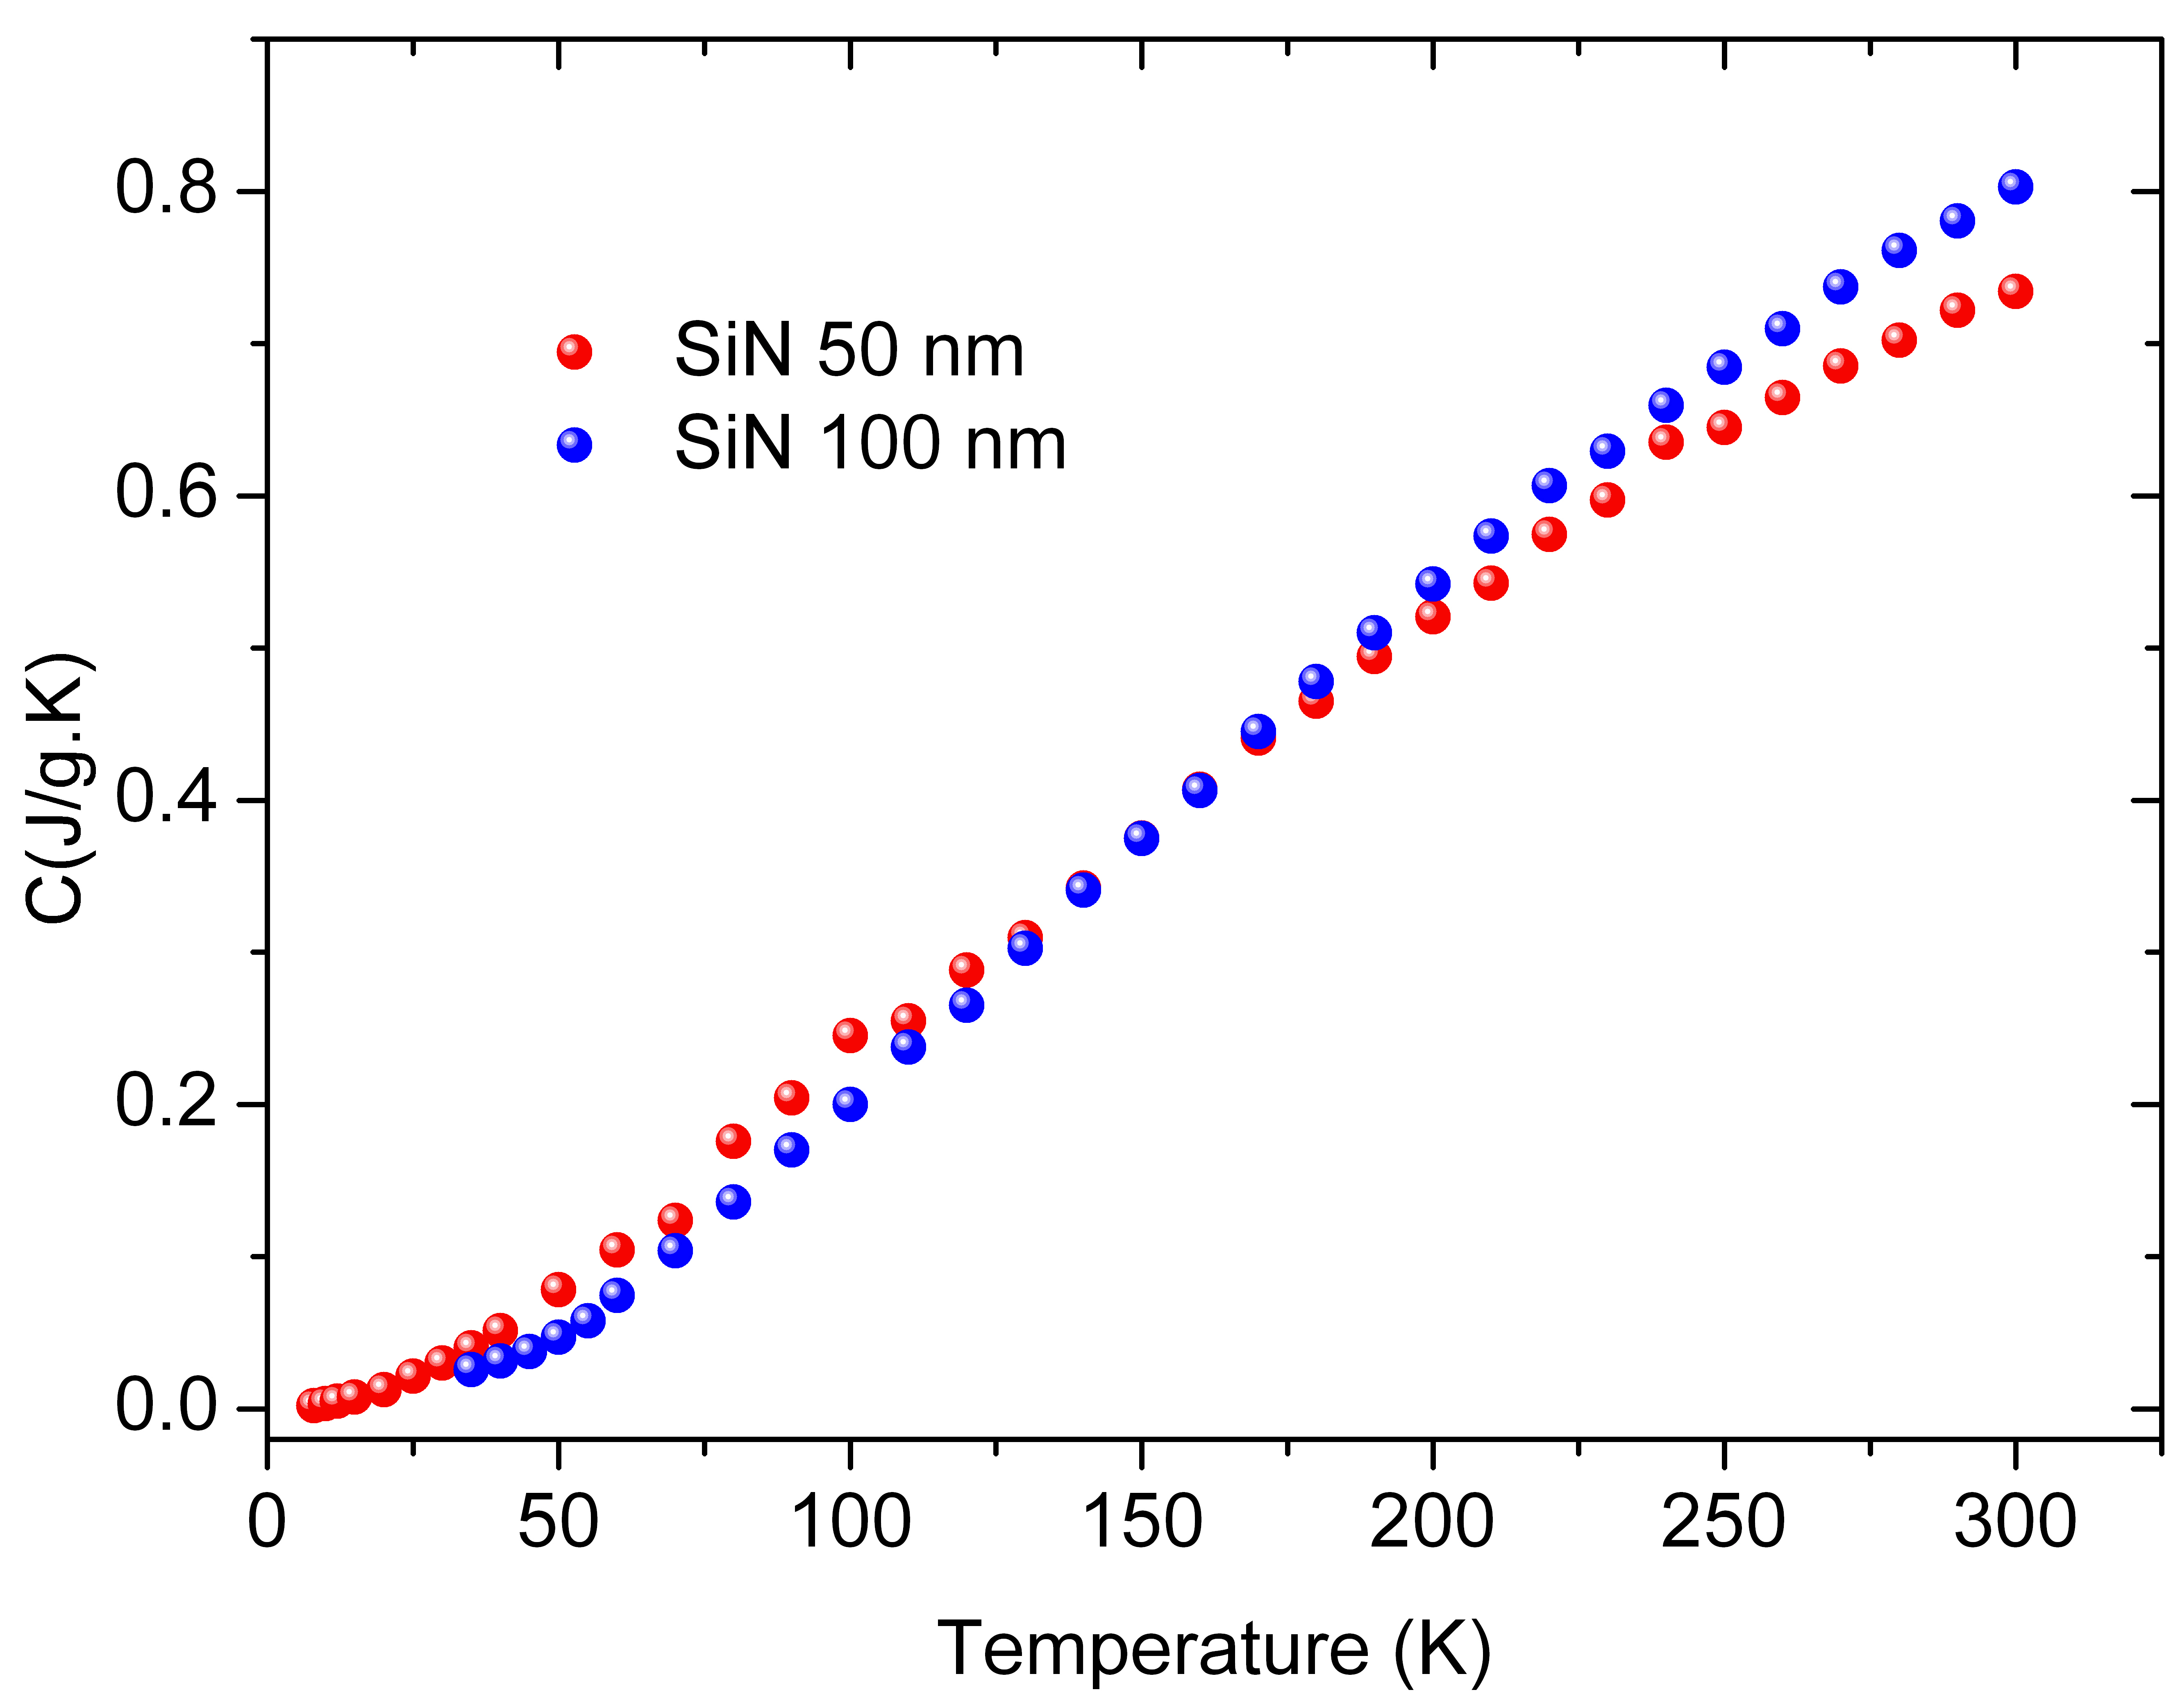
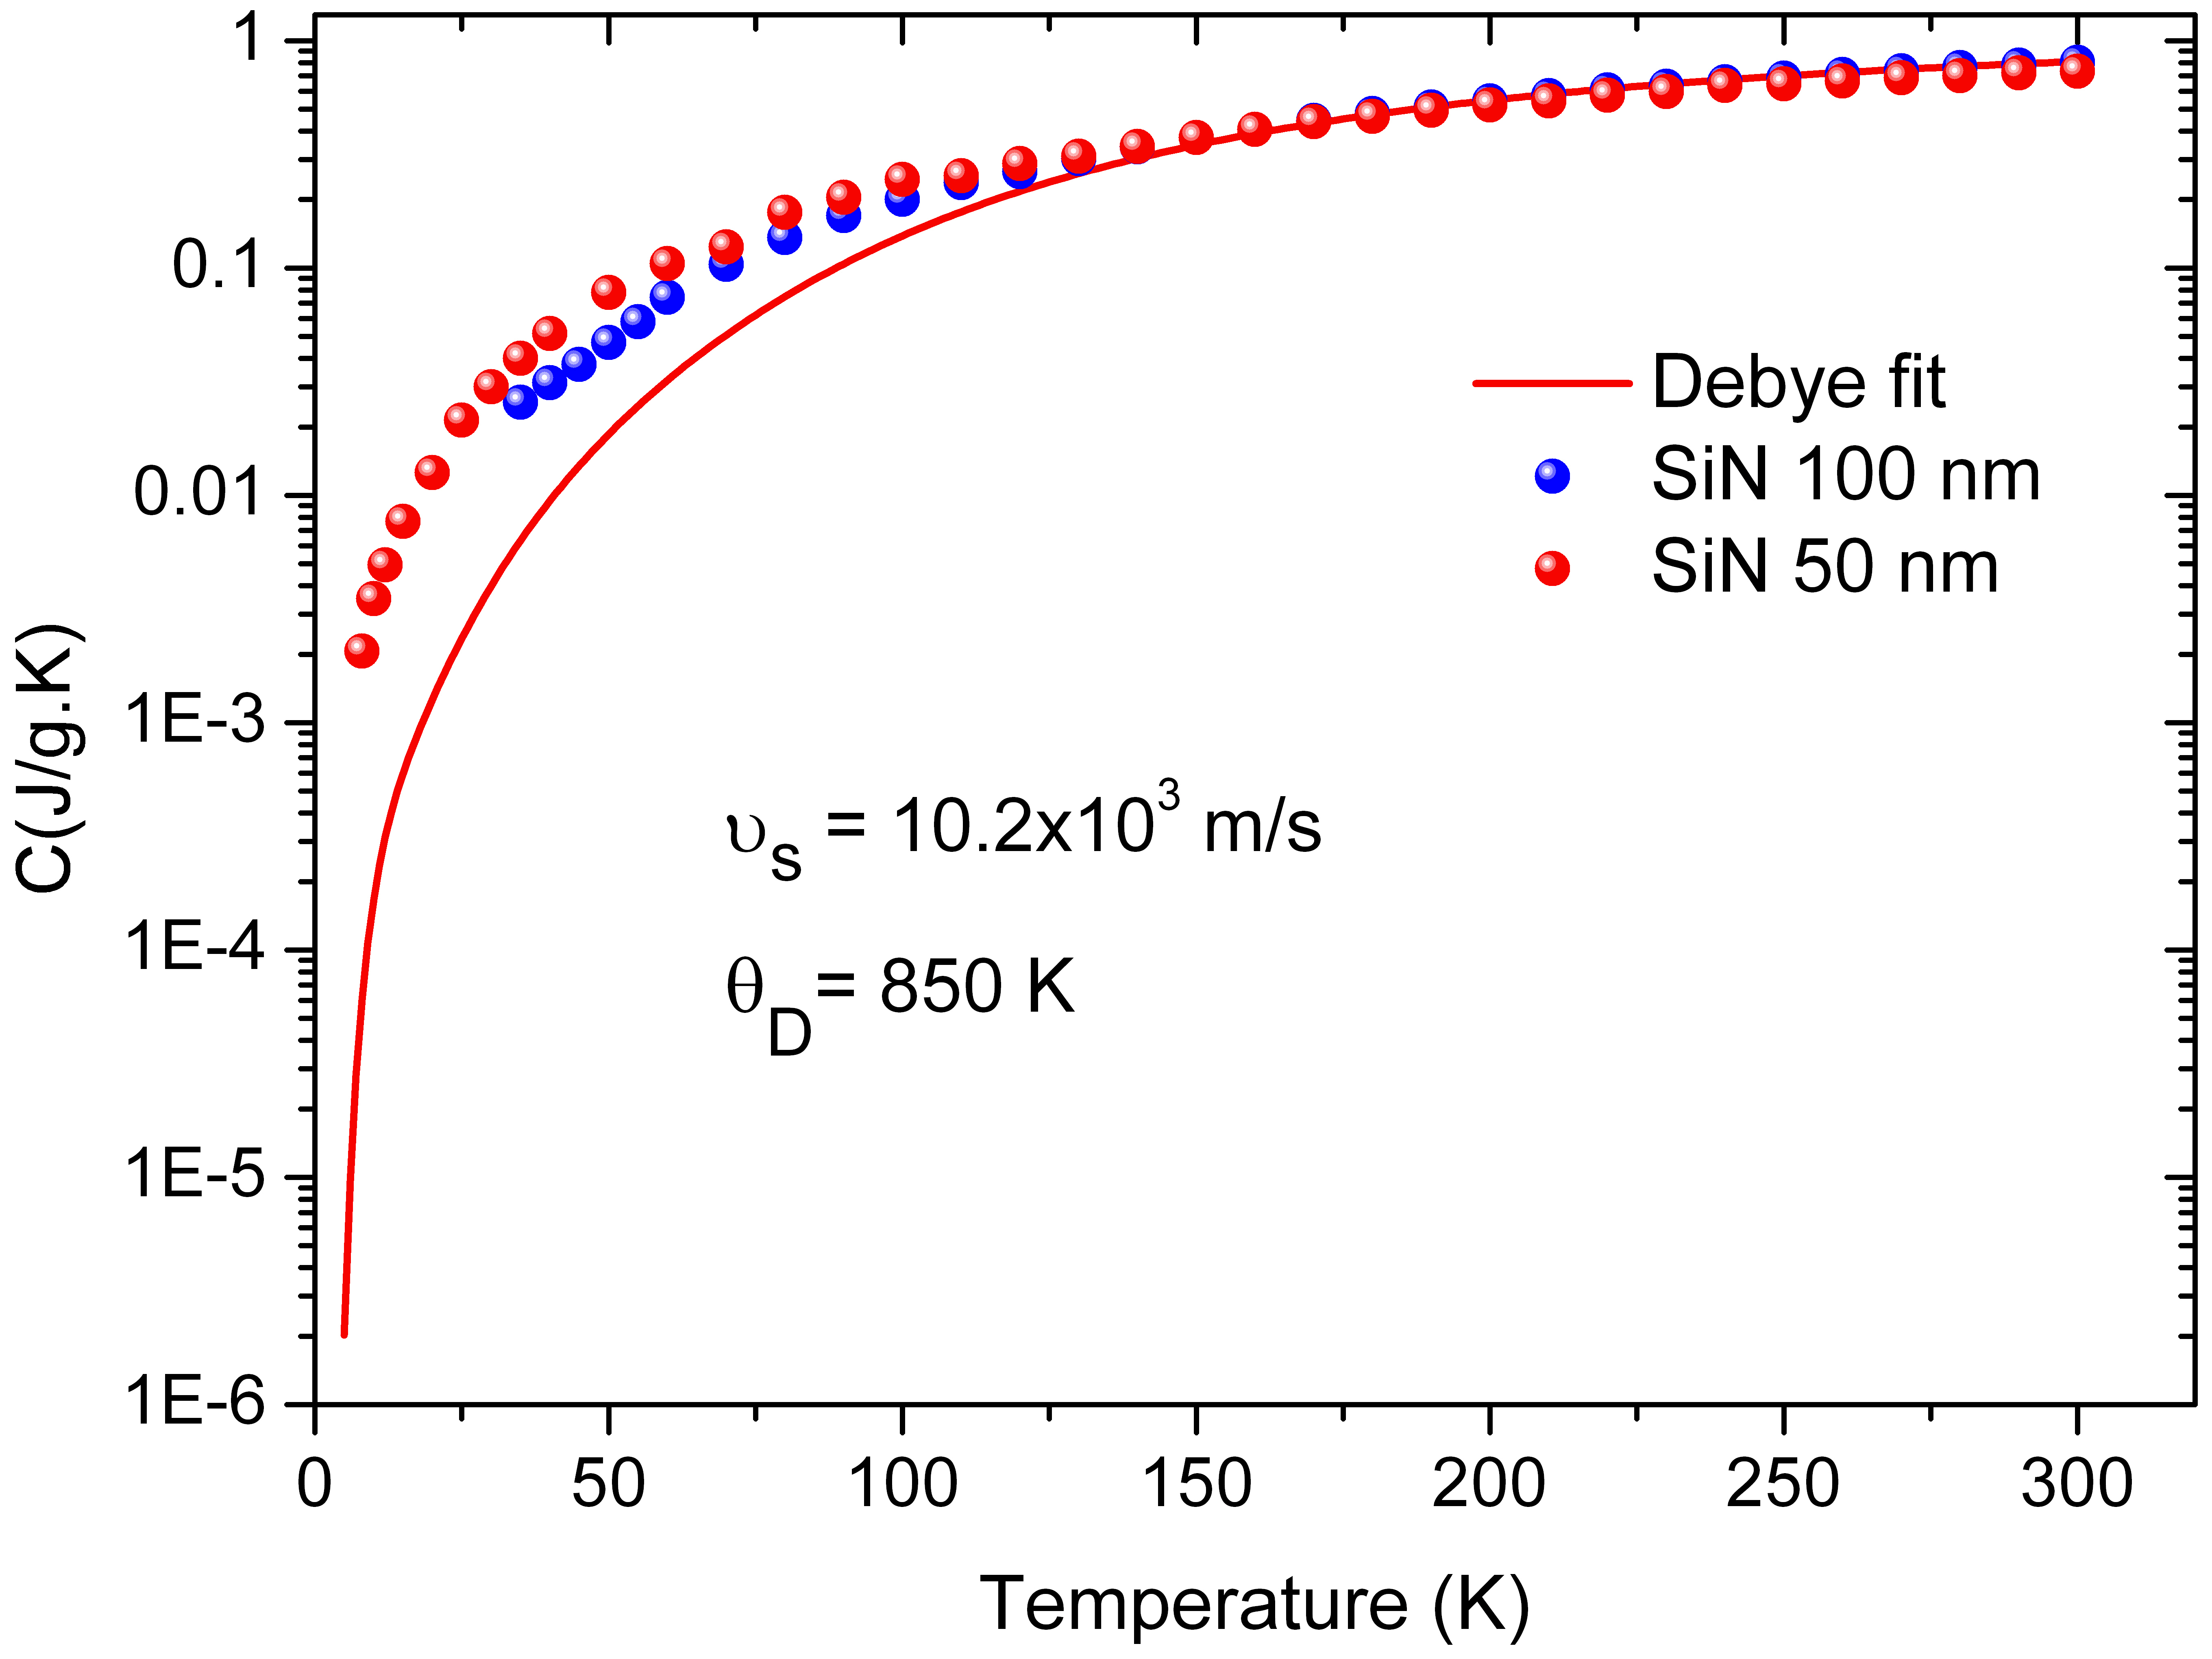
Fig. 5 and 6 show the specific heat data of a 50 nm and a 100 nm thick SiN membrane with the corresponding Debye fit plotted versus the temperature. Below 100 K, a deviation from Debye-like specific heat is seen, the specific heat rise is stronger than the Debye term as already mentioned for glassy materials but at lower temperature Gil1993 . From the Debye specific heat fit using a sound velocity estimated from a mechanical measurement, the Debye temperature is estimated to be =850 K, a value commonly accepted for amorphous SiN membranes Zink2004 ; GUZMAN1976 . As shown in Fig. 5, only a slight difference between the 50 nm and 100 nm membrane specific heat is observed, illustrating that the reduced dimensions do not affect significantly the specific heat in this temperature range.
V conclusions
We have presented measurements of the specific heat of suspended SiN membranes from 8 to 300 K by using the 3 method in a Vlklein geometry. By fitting the frequency-dependent 3 voltage data to Eq. 9, we have obtained the specific heat of the SiN membrane with a sensitivity of 4 nJ/g.K at room temperature. The configuration used for the specific heat measurements also allow the measurement of thermal conductivity of the same sample at low frequency with a very high resolution Sikora2012 ; Sikora2013 demonstrating the valuable advantage of this technique; even if the global sensitivity does not reach the performances of competing techniques like ac calorimetry bourg1 ; Lopeandia2010 ; rydh , fast scanning calorimetry viejo or relaxation calorimetry Revaz2005 .
The Debye temperature has been extracted from the specific heat variation of SiN as a function of temperature. A deviation from Debye law has been observed at low temperature as already reported by other authors Zink2004 . Further measurements down to very low temperature (T10K) are underway.
This new configuration of the 3 method could also be used as a sensor for the measurement of both the specific heat and the thermal conductivity of a given material deposited on the back side of the membrane. This technique provides a platform for the measurement of thermal properties of very thin films, especially for the characterization of transport along the plane.
acknowledgements
We acknowledge technical supports from Nanofab, the Cryogenic shop, the Electronic shop and Capthercal from the Institut Néel for these experiments. Funding for this project was provided by a grant from La Région Rhône-Alpes (CMIRA), by the Agence Nationale de la Recherche (ANR) through the project QNM and by european fundings through the MicroKelvin project and the MERGING project grant agreement No. 309150. We would like to thank P. Gandit, J-E. Lorenzo-Diaz, B. Fernandez, T. Crozes, T. Fournier, E. André and J.-L. Garden for help and fruitful scientific exchanges and M. Nunez-Regueiro for financially supporting the ANSYS project via ANR grant TetraFer ANR-09-BLAN-2011.
References
- (1) A.D. McConnell and K.E. Goodson, Annual Review of Heat Transfer, 14, 129, (2005).
- (2) D.G. Cahill, W.K. Ford, K.E. Goodson, G.D. Mahan, A. Majumdar, H.J. Maris, R. Merlin, and S.R. Phillpot, J. Appl. Phys., 93, 793, (2003).
- (3) W. Kim, J. Zide, A. Gossard, D. Klenov, S. Stemmer, A. Shakouri, and A. Majumdar, Phys. Rev. Lett, 96, 045901, (2006).
- (4) L.D. Hicks and M.S. Dresselhaus, Phys. Rev. B, 47, 12727, (1993).
- (5) A. Shakouri, Annual Review of Materials Research 41, 399, (2011).
- (6) J-S. Heron, C. Bera, T. Fournier, N. Mingo, and O. Bourgeois, Phys. Rev. B, 82, 155458, (2010).
- (7) C. Blanc, A. Rajabpour, S. Volz, T. Fournier, and O. Bourgeois, Cond-Mat, arXiv:1302.4422, 2013.
- (8) J. Cuffe, E. Chavez, A. Shchepetov, P-O. Chapuis, E-H. El Boudouti, F. Alzina, T. Kehoe, J. Gomis-Bresco, D. Dudek, Y. Pennec, B. Djafari-Rouhani, M. Prunnila, J. Ahopelto, and C.M. Sotomayor Torres, Nano Letters, 12, 3569, (2012).
- (9) B.L. Zink and F. Hellman, Solid State Commun., 129, 199, (2004).
- (10) B. Revaz, B.L. Zink, and F. Hellman, Thermochimica Acta, 432, 158, (2005).
- (11) R.O. Pohl, X. Liu, and E. Thompson, Rev. Mod. Phys., 74, 991, (2002).
- (12) R. Sultan, A.D. Avery, J.M. Underwood, S.J. Mason, D. Bassett, and B.L. Zink, Phys. Rev. B, 87, 214305, (2013).
- (13) F. Vlklein, Thin Solid Films, 188, 27, (1990).
- (14) N.O. Birge and S.R. Nagel, Rev. Sci. Instrum., 58, 1464, (1987).
- (15) D.G. Cahill, Rev. Sci. Instrum., 61, 802, (1990).
- (16) F. Vlklein, H. Reith, and A. Meier, Physica Status Solidi (a), 210, 106, (2013).
- (17) A. Jain and K.E. Goodson, Journal of Heat Transfer, 130, 102402, (2008).
- (18) A. Sikora, H. Ftouni, J. Richard, C. Hébert, D. Eon, F. Omnès, and O. Bourgeois, Rev. Sci. Instrum., 83, 054902, (2012).
- (19) A. Sikora, H. Ftouni, J. Richard, C. Hébert, D. Eon, F. Omnès, and O. Bourgeois, Rev. Sci. Instrum., 84, 029901, (2013).
- (20) F. Ong and O. Bourgeois, Europhys. Lett, 79, 67003, (2007).
- (21) A.F. Lopeandia, E. André, J.-L. Garden, D. Givord, and O. Bourgeois, Rev. Sci. Instrum., 81, 053901, (2010).
- (22) S. Tagliati, V. M. Krasnov, and A. Rydh, Rev. Sci. Instrum., 83, 055107, (2012).
- (23) A.F. Lopeandia, L. Cerdo, M. Clavaguera-Mora, L. Arana, K. Jensen, F. Muñoz, and J. Rodriguez-Viejo, Rev. Sci. Instrum., 76, 065104, (2005).
- (24) O. Bourgeois, E. André, C. Macovei, and J. Chaussy, Rev. Sci. Instrum., 77, 126108, (2006).
- (25) J-S. Heron, T. Fournier, N. Mingo, and O. Bourgeois, Nano Letters, 9, 1861, (2009).
- (26) ”ANSYS(TM) Multiphysics engineering calculation platform.”.
- (27) L. Gil, M.A. Ramos, A. Bringer, and U. Buchenau, Phys. Rev. Lett, 70, 182, (1993).
- (28) I. Guzman, A.F. Demidenko, V.I. Koshchenko, M.S. Fraifeld, and Y.V. Egner, Inorganic Materials, 12, 1546 (1976).