xxxx-xxx-xx
Direct Dark Matter Search with XMASS-I
Masaki Yamashita for the XMASS collaboration
Kamioka Observatory, Institute for Cosmic Ray Research, the University of Tokyo, Higashi-Mozumi, Kamioka, Hida, Gifu, 506-1205, Japan
Kavli Institute for the Physics and Mathematics of the Universe (WPI), the University of Tokyo, Kashiwa, Chiba, 277-8582, Japan
XMASS-I uses single phase liquid xenon technology for aiming at the direct detection of dark matter. The detector observes only scintillation light by 2 inch 642 PMTs which are placed in sphere shape around an active volume. With its large mass target and high photoelectron yield, we conducted a search for dark matter by annual modulation with 832 kg 359.2 days exposure of data. We find no modulation signal in the data so that we set an upper limit 4.3 at WIMP mass of 8 GeV/ which excluded an interpreted DAMA/LIBRA allowed region.
PRESENTED AT
The 12th Conference on the Intersections of Particle and Nuclear Physics in Vail, CO, U.S.A.
(CIPANP2015), May 19-24, 2015
1 Introduction
The XMASS project is a multi-purpose experiment for the underground physics and its targets are dark matter search, low energy solar neutrinos and neutrinoless double beta decay with ton scale fiducial volume of liquid xenon (LXe) [1]. The current phase of XMASS is using 832 kg liquid xenon detector mainly for the dark matter search prior to the second stage of 5 ton detector with 1ton fiducial volume (XMASS 1.5). Based on the results and experiences which will be obtained by those detectors, the final detector will be employed for the study of low energy solar neutrinos and the further investigation of dark matter.
Recently, XMASS carried out searches for dark matter as well as Axion by taking advantages of its high photoelectron (PE) yield (15 PE/keV) and low background [2, 3, 4, 5]. The detector looks for not only nuclear recoil from WIMP but also electrons via interactions with other candidates such as Axion like particles and Super-WIMPs. In addition to those searches, we have also explored dark matter by annual modulation in both model independent and dependent way [6]. In this paper, we report the model dependent annual modulation search, namely for WIMP via elastic scattering via nuclei, with high exposure data which is another feature of a large mass detector. DAMA/LIBRA observed a positive evidence of the annual modulation in the signal count rate and its statistical significance exceeds 9 in their 1.33 tonyear of data taken over the 14 annual cycles with the 100 kg to 250 kg of NaI(Tl) scintillator crystals [7]. As the rotation of the Earth around the Sun produces a modulation in the signal count rate of dark matter, it can be observed by the terrestrial detector [8]. The liquid noble gas detector has an advantage in its large mass and XENON100 recently conducted annual modulation search with two phase Xe detector in their 34 kg 224.6 days data [9]. The XMASS detector is able to catch up with the DAMA/LIBRA exposure in less than two years using 832 kg of liquid xenon (LXe) as a target material. It is particularly important because this is the first time exploration with a compatible exposure in the different environment and underground site. Moreover comparing to their energy threshold 2 keVee, the lower energy threshold of about 1 keVee achieved by XMASS. This translates directly into higher sensitivity for dark matter searches.
2 XMASS experiment
The XMASS detector is a large LXe scintillation detector and located at the Kamioka Observatory (overburden 2700 m water equivalent) in Japan. The detailed detector design, calibration system and performances are described in [10]. A water tank, 10 m in diameter and 10.5 m height, which is equipped with 72 Hamamatsu H3600 20-inch photomultiplier tubes (PMTs) acts as both an active muon veto and passive radiation shield against neutrons and gamma rays from the rock. The LXe is contained in a vacuum insulated Oxygen Free High Conductive (OFHC) copper vessel. The total amount of LXe in the active volume is 832 kg and the total mass of liquid in the detector is 1050 kg. Hexagonal 642 Hamamatsu R10789 PMTs are mounted in an approximate sphere OFHC holder with a radius of about 40 cm. The PMT’s photo-cathode highly cover the inner surface of the detector with 62.4. The gains of PMTs is continuously monitored by a blue LED embedded in the inner surface of the detector. Energy calibrations are carried out by regularly inserting a 57Co micro source [11] into the working detector and occasionally also 55Fe, 109Cd, 241Am sources.
3 Data taking and event selection
The data accumulated between November-2013 and March-2015 were used for this analysis . Temperature and pressure of LXe were stable in the range of 172.6-173.0 and 0.162 - 0.164 MPa absolute for the data. After removing periods of operation with excessive PMT noise, unstable power supply on data acquisition system, or abnormal trigger rate, the total live time becomes 359.2 days.
In this paper, three different energy scales were used: 1) keV denotes an energy scale obtained by dividing the observed photoelectron (PE) by the PE/keV at 122 keV. Therefore keV is proportional to total PE. 2) keVee represents, an electron equivalent energy incorporating all the gamma-ray calibrations and 3) keVnr denotes the nuclear recoil energy using a factor converting the energy scale from keV to keVnr which was taken from [19]. The ’PE-scaled’ energy keV was used throughout the analysis and the final results were translated into keVee and keVnr. The energy threshold for this analysis is 0.5 keV (8 PE) which corresponds to 1.1 keVee and 4.8 keVnr.
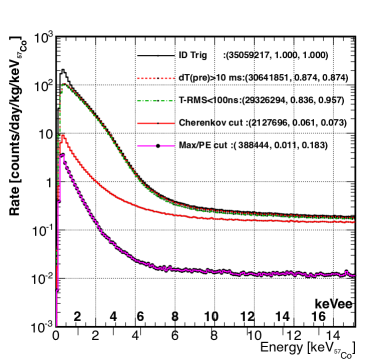

Simple data selections were applied for the data analysis and they are described in [2] except ’Max/Total PE’ cut. Figure 1 (left) shows the energy spectrum after each data selection. ’ID Trig’ requires events with 4 PMT hits in a 200 ns coincidence timing window without a muon veto. In order to remove events caused by after pulses of bright events, for example, induced by high energy gamma-rays or alpha particles, events occurring within 10 ms from the previous event (dT(pre)) or having a variance in their hit timings of greater than 100 ns are removed(T-RMS). A ’Cherenkov cut’ removes events which produce light predominantly through Cherenkov emission, in particular the beta decays of 40K in the PMT photocathode. Events for which more than 60 % of their PMT hits arrive in the first 20 ns were classified as Cherenkov-like events [2]. Finally, a ’Max/Total PE’ cut removes the events that occurred in front of PMTs near the inner surface of the detector. Events with a large ratio of the PE in the PMT with the largest PE count to the total PE observed by all PMTs in the event were removed. After applying Cherenkov cut, this last cut, as a function of PE, was designed to keep 50% of an uniformly distributed 20 GeV WIMP MC signal, therefore the efficiencies are different for other WIMP masses. The cut value varied about 0.2 at 8 PE and about 0.07 at 50 PE and the total efficiencies for each WIMP masse are shown in Fig. 1 (right).
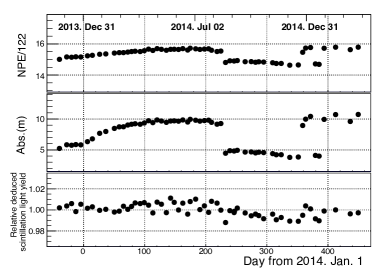
As described in [6], the 57Co calibration data were monitored to track PE yield and optical properties of the LXe and they are shown in Fig. 2 (left). The central panel in Fig. 2 (left) traces the absolute absorption length from about 4 m to 11 m and its bottom panel shows the relative change in the intrinsic light yield with its variation staying within over the entire data taking period.
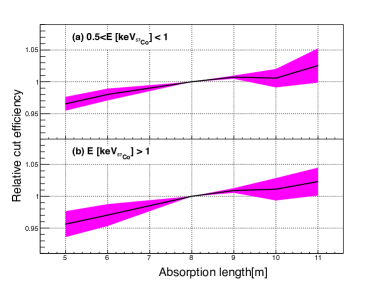
The time dependence of the PE yield affects the efficiency of the cuts. Therefore we evaluate the absorption length dependence of the relative cut efficiencies through MC simulation as shown in Fig. 2. The relative cut efficiencies were evaluated for two different energy range to take into account the energy dependency. We normalize the overall efficiency at an absorption length of 8 m for different energy range with correlated uncertainty due to the position dependence which are described as width of these bands and this is the dominant systematic uncertainty in this analysis. The second largest contribution comes from a gain instability of the FADCs (CAEN V1751) between April 2014 and September 2014 due to a different initialization method used in that period. It contributes 0.3% uncertainty to energy scale. Other effects from LED calibration, trigger threshold stability, timing calibration were negligible.
To retrieve the annual modulation amplitude from the data, the least squares method for the time-binned data was used. The dataset was divided into 40 time bins () with roughly 10 days of live time each, and each of these time bins were then further divided into energy bins () with a width of 0.1 keV. Two independent fits were performed, differing in their treatment of the systematic uncertainties. Both of them fit all the energy and time bins simultaneously. Method 1 introduced a ’pull term’ , and its was defined as:
| (1) |
where , and are the data, expected event rate and the statistical error in the -th energy and -th time bin which is relative to January 1, 2014, respectively. represents the 1 systematic error on the expected event rate in that bin. Method 2 introduces a covariance matrix to propagate the effects of the systematic error and its was defined as
| (2) |
where is the total number of bins, are the data (expected) event rate for the . The matrix contains the statistical uncertainties of the bins, and is the covariance Matrix of the systematic uncertainties as derived from MC simulation. As the WIMP mass determines the recoil energy spectrum, the expected modulation amplitudes of the energy bins become a function of the WIMP mass: . The expected rate in a bin then becomes:
| (3) |
where is the WIMP-nucleon cross section. In these fitting procedure the modulation period was fixed to one year and phase to the expected value of and 152.5 days (2nd of June), the time for maximizing the Earth velocity relative to the WIMP distribution.
4 Results
To obtain the WIMP-nucleon cross section the data was fitted in the energy range of 0.5-15 keV. We assume a standard spherical isothermal galactic halo model with the most probable speed of =220 km/s, the Earth’s velocity relative to the dark matter distribution of km/s, and a galactic escape velocity of = 650 km/s, a local dark matter density of 0.3 GeV/cm3, following [18].
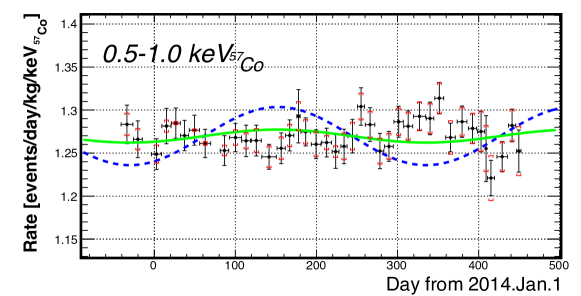
The observed count rate after cuts as a function of time in the energy region of 0.5-1.0 keV is shown in Fig. 3. The size of systematic error caused by the relative cut efficiencies are also shown. The expected count rate for WIMP masses of 7 and 8 GeV/ with a cross section of 2 cm2 for the spin independent case are also shown as a function of time after all cuts. The systematic error of the efficiencies comes from the uncertainty of LXe scintillation decay time of 251 ns [2] and is estimated as about 5% in this analysis.
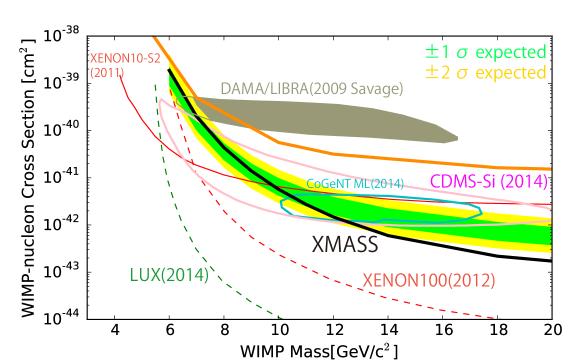
As both methods found no significant signal, the 90% C.L. upper limit by method 1 on the WIMP-nucleon cross section is shown in Fig. 4. The scintillation efficiency of [19] was used to obtain a conservative limit. To evaluate the sensitivity, 10,000 dummy samples with the same statistical and systematic errors as data but without modulation were prepared. The and bands in Fig. 4 outline the expected 90% C.L. upper limit band for the no-modulation hypothesis using these dummy samples. The result excludes the DAMA/LIBRA allowed region as interpreted in [20] for WIMP masses higher than 8 GeV/. This limit is robust against the difference of analysis methods (less than 10% for the cross section) and astrophysical assumptions (upper limit of 5.4 in the case of = 544 km/s [24]). The best fit parameters in a wider mass range is a cross section of 3.2 for a WIMP mass of 140 GeV/. This yields a statistical significance of 2.7, however, in this case, the expected unmodulated event rate exceeds the total observed event rate by a factor of 2, therefore these parameters were deemed unphysical.
5 Summary and Conclusion
XMASS carried out the annual modulation analysis with large exposure of 832kg 359.2 days with high PE yield LXe detector. For the model dependent case, the exclusion upper limit 4.3 at 8 GeV/ was obtained and the result excluded DAMA/LIBRA allowed region in the higher than that WIMP mass.
ACKNOWLEDGEMENTS
We gratefully acknowledge the cooperation of Kamioka Mining and Smelting Company. This work was supported by the Japanese Ministry of Education, Culture, Sports, Science and Technology, Grant-in-Aid for Scientific Research, JSPS KAKENHI Grant Number, 19GS0204, 26104004, and partially by the National Research Foundation of Korea Grant funded by the Korean Government (NRF-2011-220-C00006).
References
- [1] Y. Suzuki, arXiv:hep-ph/0008296.
- [2] K. Abe et al. (XMASS collaboration), Phys. Lett B 719, 78 (2013).
- [3] K. Abe et al. (XMASS collaboration), Phys. Lett B 724, 46 (2013).
- [4] K. Abe et al. (XMASS collaboration), Phys. Rev. Lett. 113, 121301 (2014).
- [5] H. Uchida et al. (XMASS collaboration), Phys. Theor. Exp. Phys., 063C01 (2014).
- [6] K. Abe et al. (XMASS collaboration) , arXiv:1511.04807.
- [7] R. Bernabei et al., Eur. Phys. J. C 73, (2013) 2648.
- [8] A. K. Drukier, K. Freese and D. N. Spergel, Phys. Rev. D 33, 3495 (1986).
- [9] E. Aprile et al. (XENON100 collaboration) Phys. Rev. Lett. 115, 091302 (2015) , E. Aprile et al. (XENON100 collaboration) Science (2015) 349 6250 851
- [10] K. Abe et al. (XMASS collaboration), Nucl. Instr. Meth. A 716, 78 (2013).
- [11] N. Y. Kim et al., Nucl. Instr. Meth. A 784, 499 (2015).
- [12] D.S. Akerib et al. (LUX collaboration), Phys. Rev. Lett. 112, 091303 (2014).
- [13] E. Aprile et al. (XENON100 collaboration), Phys. Rev. Lett. 109, 181301 (2012).
- [14] R. Agnese et al. (SuperCDMS collaboration), Phys. Rev. Lett. 112, 241302 (2014).
- [15] C. Savage et al. JCAP 04, 010 (2009).
- [16] C. E. Aalseth et al. (CoGeNT collaboration), arXiv:1401.6234v1.
- [17] R. Agnese et al. (CDMS collaboration), Phys. Rev. Lett. 111, 251301 (2013).
- [18] J.D. Lewin and P.F. Smith, Astroparticle Phys. 6, (1996) 87.
- [19] E. Aprile et al., Phys. Rev. Lett. 107 131302 (2011).
- [20] C. Savage et al. JCAP 04, (2009) 010.
- [21] C. E. Aalseth et al. (CoGeNT collaboration), arXiv:1401.6234v1.
- [22] J. Angle et al. (XENON10 collaboration), Phys. Rev. Lett. 110, 249901 (2013).
- [23] R. Agnese et al. (CDMS collaboration), Phys. Rev. Lett. 111, 251301 (2013).
- [24] M.C. Smith et al., Mon. Not. R. Astron. Soc. 379, 755-772 (2007).