South Galactic Cap -band Sky Survey (SCUSS): Data Release
Abstract
The South Galactic Cap -band Sky Survey (SCUSS) is a deep -band imaging survey in the south Galactic cap using the 2.3m Bok telescope. The survey observations were completed at the end of 2013, covering an area of about 5000 square degrees. We release the data in the region with an area of about 4000 deg2 that is mostly covered by the Sloan digital sky survey. The data products contain calibrated single-epoch images, stacked images, photometric catalogs, and a catalog of star proper motions derived by Peng et al. (2015). The median seeing and magnitude limit () are about 2″.0 and 23.2 mag, respectively. There are about 8 million objects having measurements of absolute proper motions. All the data and related documentations can be accessed through the SCUSS data release website http://batc.bao.ac.cn/Uband/data.html.
1 Introduction
The South Galactic Cap -band Sky Survey (SCUSS) is an international cooperative project between the National Astronomical Observatories of Chinese Academy of Sciences (NAOC) and the Steward Observatory of the University of Arizona (X. Zhou et al. 2015, in preparation). The survey was originally planned to perform a sky survey of about 3700 deg2 in the south Galactic cap by using the 2.3m Bok telescope. The project was initiated in fall 2009 and its first run started in 2010 September. The survey ended its observation in 2013 December. The final survey area is about 5000 deg2, far beyond the planned area.
The main goal of the survey is to supply a -band catalog for the spectroscopic target selection of the Large Sky Area Multi-Object Fiber Spectroscopy Telescope (Cui et al., 2012). Besides, combined with the , and -band data of the Sloan Digital Sky Survey (SDSS; York et al., 2000), the deep SCUSS -band data can be used to study the Milk Way and galaxies. A series of papers based on the SCUSS data have been published, including investigating the halo structure of the Galaxy (Nie et al., 2015), calculating star proper motions (Peng et al., 2015), estimating the Galactic photometric metallicity and model parameters (Jia et al., 2014; Gu et al., 2015), and selecting spectroscopic targets, such as quasars and emission line galaxies (Comparat et al., 2015; Raichoor et al., 2015; Zou et al., 2015b).
This paper describes the data set of the SCUSS data release that is made publicly available. The paper is organized as follows: Section 2 summarizes the survey and data reduction; Section 3 presents the data products including the calibrated images and photometric catalogs; Section 4 gives an analysis of the data quality. Section 5 describes the catalog of star proper motions derived by Peng et al. (2015); Section 6 is the conclusion.
2 The Survey and Data Reduction
The SCUSS is a wide and deep -band sky survey in the south Galactic cap. The survey uses the 90 inch (2.3m) Bok telescope that belongs to the Steward Observatory. It operates every night of the year except Christmas Eve and the maintenance period in August. The camera, named 90Prime, is installed at the prime focus (correct focal ratio /2.98). It contains four 4k4k backside-illuminated CCDs that are assembled in a 22 array with gaps along both vertical and horizontal directions. The CCDs are optimized for the -band response, giving a quantum efficiency close to 80%. The edge-to-edge FOV is about 1°.081°.03. The adopted filter is similar to the SDSS band. The SCUSS filter is somewhat bluer and narrower. The central wavelength and FWHM are 3538 and 520 Å, respectively (Zou et al., 2015a).
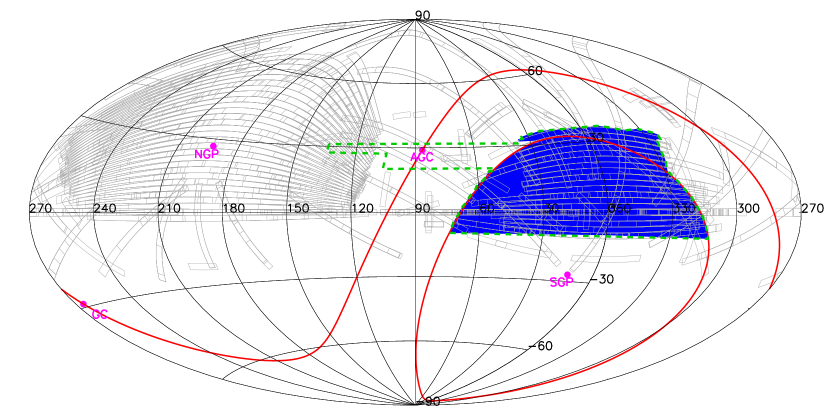
The originally designed survey footprint is located within the region of and Galactic latitude . The observation started in 2010 September and ended in 2013 December. The final area is about 5000 deg2 (dashed green line in Figure 1), including the planned area, an extra area in the northwest corner, and the region extending to the anti-Galactic center. In this paper, we only release the data shown in the blue area of Figure 1. The area is about 4000 deg2, 92% of which is covered by the SDSS. Each field has two continuous exposures, giving a total exposure time of 5 minutes. These two exposures are dithered by 1/2 of the CCD size, which benefits the internal photometric calibration and gap filling. In this way, most of the field is covered by two exposures. Some gap areas are covered by one exposure. The exposure time of 5 minutes generates an expected depth of 23.0 mag.
The following is a summary of the data reduction. More details can be found in Zou et al. (2015a).
(1) Detrending: a dedicate image processing pipeline was compiled, which performs some standard calibrations (overscan subtraction, bias correction, and flat-fielding, etc.) and special handling (crosstalk, CCD artefacts, abnormal overscan, and sky gradient etc.)
(2) Astrometry: the UCAC4 catalogs are used to derive the astrometric solutions. The global external position error is about 0″.13. The average internal astrometric error, from sources on overlapping exposures is about 0″.09.
(3) Magnitude calibrations: the SDSS catalogs are used to make external photometric calibrations. We calculate the photometric zeropoints (ZPs) separately for the four amplifiers to reduce the effect of gain and photometric response variations. For images out of the SDSS coverage, we interactively derive their ZPs internally by using the common stars in the overlapped area.
(4) Image stacking: single-epoch images with specified qualities are stacked. More than 91% of stacked images are assembled by using single-epoch images with consistent qualities.
(5) Photometry: SExtractor photometry (Bertin & Arnouts, 1996) with automatic elliptical apertures is performed on stacked images. Aperture, point spread function (PSF) and model magnitudes are measured from both stacked images and co-added flux measurements on single-epoch images. The model photometry uses the SDSS -band shape parameters. Due to improper flat-fielding, scattered light, and focal plane distortion, the photometric ZP would vary with the position in the CCD plane so that there are photometric residuals across the CCD. We derive such residual maps for all CCDs and use them to correct the magnitudes.
3 Data Products
3.1 Calibrated images
Single-epoch images are calibrated by the dedicated image processing pipeline. There are a total of 44,937 images. The coordinate system adopts the ARC celestial projection, mostly used in Schmidt plate astrometry, with a 2nd-order radial distortion. The coordinate transformation between the focal plane and the celestial coordinates can be made by using our IDL/Python programs111http://batc.bao.ac.cn/BASS/lib/exe/fetch.php?media=scuss:single-epoch_image_calibration:a8_convert.tar.gz with the 8 coefficients in the FITS header (keywords of A81, A82, …, and A88) and a 2nd-order coefficient, which is implemented as inline functions in the programs. The usages of these programs can be found in the webpage222http://batc.bao.ac.cn/BASS/doku.php?id=scuss:single-epoch_image_calibration:idl_python_programs. The WCS parameters in the header are incorrect. The photometric ZPs of four amplifiers are presented in keywords of CALIA731, CALIA732, CALIA733, and CALIA734, which are corresponding to the northeast, southeast, northwest, and southwest quadrants of the image. Thus, the magnitude can be calculated as , where is the measured flux in DN. To ensure homogeneity of the imaging depth and coverage completeness of the stacked images, we flag single-epoch images according to their qualities. The images with seeing 3″.0, sky ADU 500, and ZP 3.5 are flagged with “1.” If a sky region has not enough images flagged with “1.” the corresponding images in this region with seeing 3″.0 are flagged with “2.” If the region still has not enough images to meet the depth requirement, the rest of the images located in this region are flagged with “3.”. For the remaining images, we flag the ones with seeing 3″.0 with “4” or otherwise with “5.” Table 1 presents main keywords in the FITS header of the single-epoch images.
| Keyword | Data Type | Meaning |
|---|---|---|
| RA-OBS | string | R.A. of the field center in J2000 |
| DEC-OBS | string | Decl. of the field center in J2000 |
| CCD_NO | int | CCD number |
| DATE-OBS | string | UTC date when the shutter was opened |
| TIME-OBS | string | UTC time when the exposure was started |
| EXPTIME | float | Exposure time (seconds) |
| RA | string | Right ascension in the specified epoch |
| DEC | string | Decl. in the specified epoch |
| HA | string | Hour angle |
| EPOCH | float | Equinox for R.A. and Decl. |
| FILTER | string | Filter name |
| OBJECT | string | Field name |
| RDNOCAL | string | Calculated readout noises for four CCDs |
| GAINCAL | string | Calculated gains for four CCDs |
| SKYADU | float | Sky background in DN |
| SEEING | float | Seeing in arcsec |
| A81 | double | Coefficients for coordinate transformation |
| A82 | double | Coefficients for coordinate transformation |
| A83 | double | Coefficients for coordinate transformation |
| A84 | double | Coefficients for coordinate transformation |
| A85 | double | Coefficients for coordinate transformation |
| A86 | double | Coefficients for coordinate transformation |
| A87 | double | Coefficients for coordinate transformation |
| A88 | double | Coefficients for coordinate transformation |
| AIRMASS | float | Airmass when the exposure was taken |
| MAZIMUTH | float | Moon azimuth in degrees from south through west |
| MALITIUD | float | Moon altitude in degrees |
| MANGLE | float | Position angle of Moon relative to the camera center |
| CALIA73 | float | Zeropoint for the whole CCD image |
| CALIA731 | float | Zeropoint for the Amp. #1. of the CCD image |
| CALIA732 | float | Zeropoint for the Amp. #2. of the CCD image |
| CALIA733 | float | Zeropoint for the Amp. #3. of the CCD image |
| CALIA734 | float | Zeropoint for the Amp. #4. of the CCD image |
There are a total of 3700 stacked images, each of which has an area of 1°.081°.04 and about 1′ overlaps with adjacent images. These stacked images are assembled by the single-epoch images flagged as “1,” “2,” and “3.” The coordinate system is a purely linear transformation in the ARC celestial projection. The ZP is stored in the keyword of CALIA73. The other header keywords are similar to those in the single-epoch images, but the WCS parameters are accurate enough. In addition, there is a weight map corresponding to each stacked image, giving the number of exposures.
3.2 Photometric Catalogs
The catalogs contain both magnitudes measured on stacked images and co-added magnitudes from measurements on single-epoch images. The objects come from the SCUSS detections and SDSS catalogs with any of the magnitudes in DR9 brighter than 23.5 mag. The matching error between the SCUSS and SDSS is 2″.0. In the catalogs, SDSS objects can be recognized by the NUMBER column, where NUMBER 49,000 or 50,000 NUMBER 60,000. The SCUSS unique objects have NUMBER 60,000. Extra matched fainter SDSS objects within 2″ have 49,000 NUMBER 50,000.
The SExtractor photometry is performed only on stacked images, providing the automatic magnitude, Kron radius, shape parameters, object classification, etc. Aperture, PSF, model magnitudes are measured on both stacked images and single-epoch images. Co-added magnitudes are derived from these measurements on single-epoch images. Flags for the PSF magnitude (column PSFFLAG) are coded in decimal and expressed as a sum of powers of 2: 1 for CCD artefacts; 2 for bad pixels; 4 for saturated pixels; 8 for contamination from neighbors; 16 for edges of the image. The co-added flag (PSFADDFLAG) is the combination of corresponding flags of the same object measured on multiple single-epoch images.
If stack images are combined with single images of similar qualities, the magnitudes measured on stacked images are better than the co-added ones, since the object number is 20% higher. Conversely, the co-added magnitudes should be better. We can refer to Zou et al. (2015a) for the general guidelines to use the magnitudes. Table 2 and 3 show both the SCUSS and SDSS photometric information included in the catalogs. All magnitudes are corrected to the aperture magnitudes (7″.26 in radius), which is also used for photometric calibrations.
| Field | Data type | Meaning |
|---|---|---|
| NUMBER | LONG | ID of objects in stacked images |
| RA2000 | STRING | R.A. in J2000 |
| DEC2000 | STRING | Decl. in J2000 |
| X | FLOAT | Image X of SDSS objects |
| Y | FLOAT | Image Y of SDSS objects |
| BER_X | FLOAT | SExtractor X of objects detected on stacked images |
| BER_Y | FLOAT | SExtractor Y of objects detected on stacked images |
| MAG_AUTO | FLOAT | Automatic magnitude derived by SExtractor |
| MAGERR_AUTO | FLOAT | Automatic magnitude error derived by SExtractor |
| KRON_RADIUS | FLOAT | Kron radius in pixels derived by SExtractor |
| MAG_PETRO | FLOAT | Petrosian magnitude derived by SExtractor |
| MAGERR_PETRO | FLOAT | Petrosian magnitude error derived by SExtractor |
| PETRO_RADIUS | FLOAT | Petrosian radius in pixels derived by SExtractor |
| FLUX_RADIUS | FLOAT | Half-light radius in pixels derived by SExtractor |
| FWHM_IMAGE | FLOAT | FWHM of objects in pixels derived by SExtractor |
| BERTIN_G_S | FLOAT | Stellarity (0 galaxy; 1 star) derived by SExtractor |
| A_AXIS | FLOAT | Length of the major axis in pixels derived by SExtractor |
| ELLIPTICITY | FLOAT | Ellipticity derived by SExtractor |
| THETA | FLOAT | Position angle in degrees derived by SExtractor |
| BERTIN_CLASS | INT | SExtractor Flags |
| COMBINE_NUMB | INT | Exposure number in the stacked image |
| PSFMAG | FLOAT | PSF magnitudes on the stacked image |
| PSFERR | FLOAT | PSF magnitude error on the stacked image |
| PSFFLAG | INT | Flags of the PSF magnitude on the stacked image |
| APMAG | DOUBLE | Aperture magnitude on the stacked image (12 apertures) |
| APMAGERR | DOUBLE | Aperture magnitude error on the stacked image |
| MODELMAG | FLOAT | Model magnitude on the stacked image |
| MODELMAGERR | FLOAT | Model magnitude error on the stacked image |
| PSFADD | DOUBLE | Co-added PSF magnitude from single-epoch images |
| PSFADDERR | DOUBLE | Co-added PSF magnitude error from single-epoch image |
| PSFADDSTD | DOUBLE | Standard deviation of the co-added PSF magnitude |
| PSFADDFLAG | LONG | Flags of the co-added PSF magnitude |
| PSFADDNUM | INT | Exposure number for the co-added PSF magnitude |
| APADD | DOUBLE | Co-added aperture magnitudes (12 apertures) |
| APADDERR | DOUBLE | Co-added aperture magnitude errors |
| APADDSTD | DOUBLE | Standard deviations of the co-added aperture magnitudes |
| APADDNUM | LONG | Exposure numbers for the co-added aperture magnitudes |
| MODELADD | FLOAT | Co-added model magnitude |
| MODELADDERR | FLOAT | Co-added model magnitude error. |
| MODELADDSTD | FLOAT | Standard deviation of the co-added model magnitude |
| MODELADDNUM | INT | Exposure number for the co-added model magnitude |
| JDMEAN | DOUBLE | Average Julian day for each object |
| MATCH_ERR | FLOAT | Match error in arcsec between SCUSS detected objects and SDSS objects |
| Field | Data type | Meaning |
|---|---|---|
| SDSSOBJID | STRING | SDSS OBJID in SDSS DR9 |
| SDSSTYPE | STRING | SDSS object type (s: star; g: galaxy) |
| PSFMAG_U | FLOAT | SDSS -band PSF magnitude |
| PSFMAG_G | FLOAT | SDSS -band PSF magnitude |
| PSFMAG_R | FLOAT | SDSS -band PSF magnitude |
| PSFMAG_I | FLOAT | SDSS -band PSF magnitude |
| PSFMAG_Z | FLOAT | SDSS -band PSF magnitude |
| PSFMAGERR_U | FLOAT | SDSS -band PSF magnitude error |
| PSFMAGERR_G | FLOAT | SDSS -band PSF magnitude error |
| PSFMAGERR_R | FLOAT | SDSS -band PSF magnitude error |
| PSFMAGERR_I | FLOAT | SDSS -band PSF magnitude error |
| PSFMAGERR_Z | FLOAT | SDSS -band PSF magnitude error |
| PETROMAG_U | FLOAT | SDSS -band Petrosian magnitude |
| PETROMAG_G | FLOAT | SDSS -band Petrosian magnitude |
| PETROMAG_R | FLOAT | SDSS -band Petrosian magnitude |
| PETROMAG_I | FLOAT | SDSS -band Petrosian magnitude |
| PETROMAG_Z | FLOAT | SDSS -band Petrosian magnitude |
| PETROMAGERR_U | FLOAT | SDSS -band Petrosian magnitude error |
| PETROMAGERR_G | FLOAT | SDSS -band Petrosian magnitude error |
| PETROMAGERR_R | FLOAT | SDSS -band Petrosian magnitude error |
| PETROMAGERR_I | FLOAT | SDSS -band Petrosian magnitude error |
| PETROMAGERR_Z | FLOAT | SDSS -band Petrosian magnitude error |
| MODELMAG_U | FLOAT | SDSS -band model magnitude |
| MODELMAG_G | FLOAT | SDSS -band model magnitude |
| MODELMAG_R | FLOAT | SDSS -band model magnitude |
| MODELMAG_I | FLOAT | SDSS -band model magnitude |
| MODELMAG_Z | FLOAT | SDSS -band model magnitude |
| MODELMAGERR_U | FLOAT | SDSS -band model magnitude error |
| MODELMAGERR_G | FLOAT | SDSS -band model magnitude error |
| MODELMAGERR_R | FLOAT | SDSS -band model magnitude error |
| MODELMAGERR_I | FLOAT | SDSS -band model magnitude error |
| MODELMAGERR_Z | FLOAT | SDSS -band model magnitude error |
| CMODELMAG_U | FLOAT | SDSS -band Cmodel magnitude |
| CMODELMAG_G | FLOAT | SDSS -band Cmodel magnitude |
| CMODELMAG_R | FLOAT | SDSS -band Cmodel magnitude |
| CMODELMAG_I | FLOAT | SDSS -band Cmodel magnitude |
| CMODELMAG_Z | FLOAT | SDSS -band Cmodel magnitude |
| CMODELMAGERR_U | FLOAT | SDSS -band Cmodel magnitude error |
| CMODELMAGERR_G | FLOAT | SDSS -band Cmodel magnitude error |
| CMODELMAGERR_R | FLOAT | SDSS -band Cmodel magnitude error |
| CMODELMAGERR_I | FLOAT | SDSS -band Cmodel magnitude error |
| CMODELMAGERR_Z | FLOAT | SDSS -band Cmodel magnitude error |
| EXTINCTION_U | FLOAT | SDSS -band extinction |
| EXTINCTION_G | FLOAT | SDSS -band extinction |
| EXTINCTION_R | FLOAT | SDSS -band extinction |
| EXTINCTION_I | FLOAT | SDSS -band extinction |
| EXTINCTION_Z | FLOAT | SDSS -band extinction |
4 Data Quality and Depth
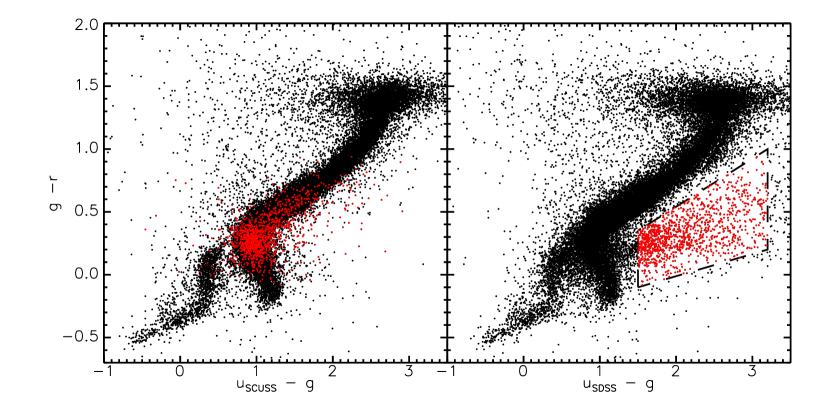
The color-color diagram is an excellent tool to compare the photometry of the SCUSS and SDSS. Figure 2 shows the scatters of stars in the plane of vs. . These stars are spectroscopically identified by the SDSS. The SCUSS co-added PSF magnitude and SDSS PSF magnitudes are used for comparison. In this figure, the star sequence using the SCUSS band is tighter. We select two color intervals of (mostly M type stars) and (mostly A type stars) to show the distributions, which is presented in Figure 3. The dispersion of the color is smaller than that of the . Moreover, objects located in the lower right (enclosed by a polygon in Figure 2) are identified as stars but initially selected as quasar candidates with redshift larger than 3.0. These stars were faint and mistakenly selected as quasars due to the bad SDSS -band photometry. But they are still located in the star sequence when the SCUSS band is used.

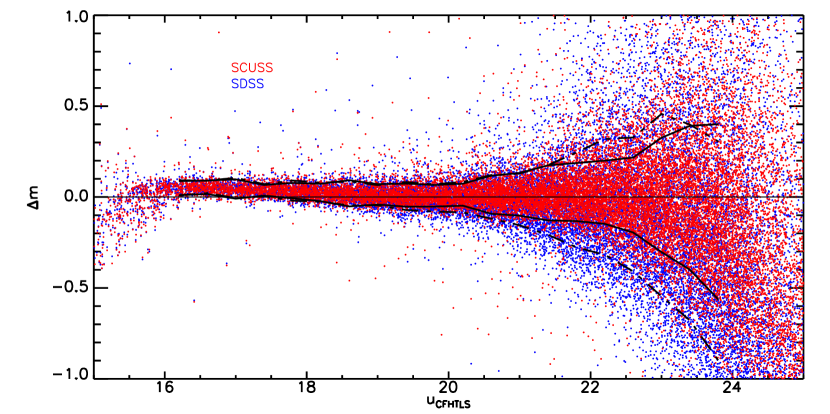
The SCUSS and SDSS -band photometry is also compared by using the catalogs from the Canada-France-Hawaii Telescope Legacy Survey (CFHTLS), whose wide-field -band depth reaches about 25.2 mag (80% completeness limit). We select the CFHTLS W4 field () that is fully covered by the SCUSS. Figure 4 shows the photometric comparison of point sources that are classified by the SDSS. The SCUSS and SDSS -band PSF magnitudes are converted to the CHFTLS photometric system 333http://cfht.hawaii.edu/Instruments/Imaging/MegaPrime/generalinformation.html. The solid and dashed lines in this figure show the photometric RMS around the average offset as a function of the magnitude. The SDSS has a much larger offset when the magnitude is fainter. The magnitude offset between the SDSS and the CFHTLS at is about 0.2 mag, while the one between the SCUSS and the CFHTLS is about -0.03 mag. In addition, for the same RMS of 0.2, the SCUSS and SDSS magnitude limits are about 22.6 and 21.4 mag, respectively. The SCUSS band is 1.2 mag deeper.
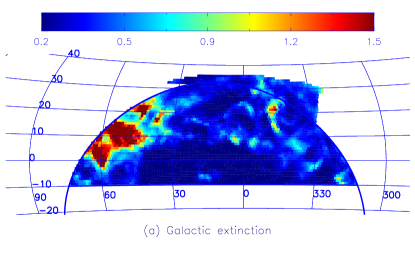
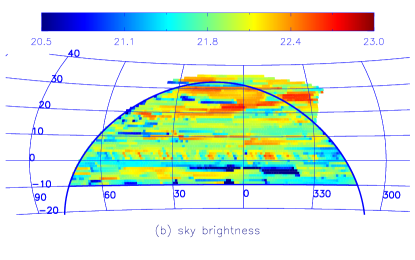
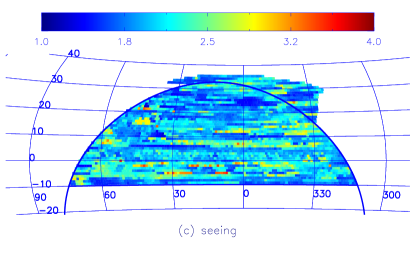
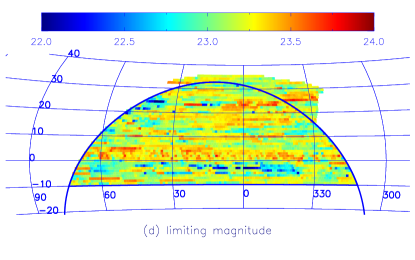
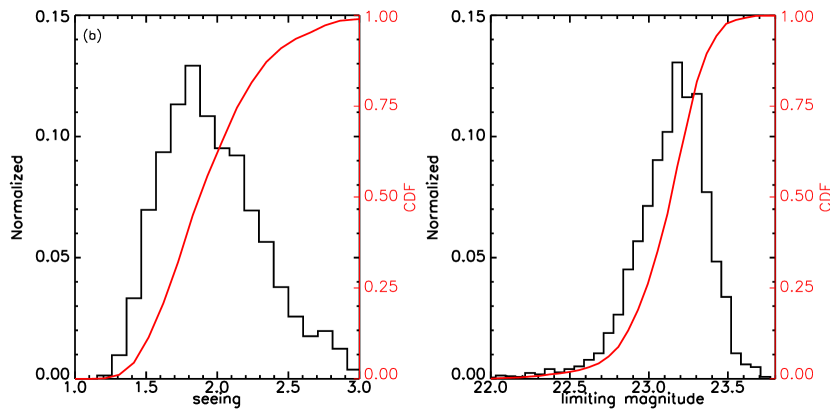
The overall distributions of the -band Galactic extinction, sky brightness, seeing, and limiting magnitude are presented in Figure 5. The median band Galactic extinction is about 0.096 mag, where the extinction map comes from Schlegel et al. (1998) using the reddening law of Cardelli et al. (1989). Some regions with very high extinctions are not included in the SDSS footprint. Most observations were taken on dark nights, while a few of them were taken at gray time as seen in Figure 5b. The median seeing is about 2″.0. About 90% of the footprint has seeing better than 2″.5. The -band seeing is usually larger than that in redder bands. The typical -band seeing on Kitt Peak is about 1″.7. The limiting magnitude shown in Figure 5d is estimated by using the SExtractor automatic magnitude measurements of 5 point sources. The median limiting magnitude is about 23.2 mag. About 98.3% of the footprint has a depth fainter than 22.5 mag. The histograms of the seeing and limiting magnitudes and their cumulative distributions are also shown in Figure 6.
5 Catalog of Star Proper Motions
Peng et al. (2015) used a novel method from Qi et al. (2015) to determine the absolute proper motions of detected objects in SCUSS single-epoch images. Based on data from the SCUSS (2010–2013) and the Guide Star Catalog II (Lasker et al., 2008) (1950–2000), the absolute proper motions of 8 million objects were derived. A great deal of effort was put into correcting the position-, magnitude-, and color-dependent systematic errors.
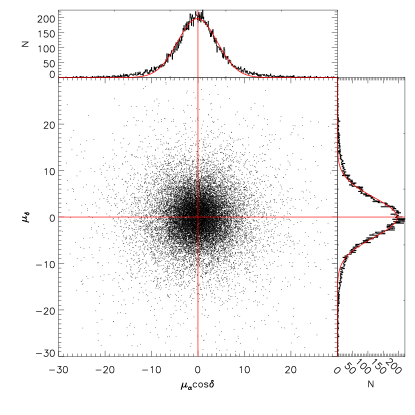
Quasars are distant and regarded to have no proper motion. The accuracy of our proper motions is estimated by using the spectroscopically confirmed quasars identified by the SDSS. Figure 7 displays the distributions of the calculated proper motions of these quasars in R.A. () and decl. (). The systematic errors (or the average) are about and , and the corresponding random errors (or the standard deviation) are about 4.90 and 4.93 for cos and , respectively. The gaussian fitted random errors are 4.27 and 4.35 . The random error increases with the magnitude from about 3 at mag to about 7 at mag. The SCUSS proper motions are compared with those in the SDSS catalog, which shows a high consistency. The typical dispersion of the proper motion between the SCUSS and SDSS is about 5 . Table 4 shows the columns in our proper motion catalog.
| Field | Data type | Meaning |
|---|---|---|
| ID | LONG | Object ID |
| RA | FLOAT | R.A. in J2000 (degree) |
| DEC | FLOAT | Decl. in J2000 (degree) |
| sigRA | FLOAT | Error of RA (mas) |
| sigDEC | FLOAT | Error of DEC (mas) |
| PMRA | FLOAT | Proper motion in right ascension multiplied by cos() () |
| PMDEC | FLOAT | Proper motion in declination () |
| sigPMRA | FLOAT | Error of proper motion in R.A. |
| sigPMDEC | FLOAT | Error of proper motion in decl. |
| MAG | FLOAT | SCUSS automatic magnitude |
| TYPE | INTEGER | Star/galaxy classification (0 for star; others for galaxy) |
| OBSNUM | INTEGER | Number of epoches |
| MeanEpoch | FLOAT | Mean epoch |
| MinEpoch | FLOAT | Minimum epoch |
| MaxEpoch | FLOAT | Maximal epoch |
6 Conclusions
The SCUSS survey was a collaborative program between the National Astronomical Observatories of China and the Steward Observatory. It used the 2.3m Bok telescope and wide-field 90Prime camera to survey the north part of the south Galactic cap in SDSS band. The observations were completed in 2013 and covered about 5000 deg2. This paper presents the data release of about 4000 deg2, 92% of which is covered by the SDSS.
We have summarized the survey and data reduction in this paper which can be referred to Zou et al. (2015a) and X. Zhou et al. (2015, in preparation) for more details. The data products include calibrated single-epoch images, stacked images, photometric catalogs. The catalogs contain the photometry of both SCUSS detected sources and objects in SDSS catalogs and provide magnitude measurements on stacked images and co-added magnitudes from measurements on single-epoch images. The SDSS information are also included in the catalogs with a 2″matching error. We have analyzed the data quality, such as the sky brightness, seeing, and magnitude limit. The median limiting magnitude (5) is about 23.2 mag, which is 1.2 mag deeper than the SDSS band. We also release a catalog of star proper motions of about 8 million objects derived by Peng et al. (2015). The data and documentations can be accessed through the SCUSS data release website 444http://batc.bao.ac.cn/Uband/data.html. In this website, the images and catalogs can be retrieved either by using query forms (developed by the Chinese astronomical data center) or directly through the data directory trees.
References
- Bertin & Arnouts (1996) Bertin, E., & Arnouts, S. 1996, A&AS, 117, 393 Data Analysis Software and Systems XX, 442, 435
- Cardelli et al. (1989) Cardelli, J. A., Clayton, G. C., & Mathis, J. S. 1989, ApJ, 345, 245
- Comparat et al. (2015) Comparat, J., Delubac, T., Jouvel, S., et al. 2015, arXiv:1509.05045
- Cui et al. (2012) Cui, X.-Q., Zhao, Y.-H., Chu, Y.-Q., et al. 2012, Research in Astronomy and Astrophysics, 12, 1197
- Gu et al. (2015) Gu, J., Du, C., Jia, Y., et al. 2015, MNRAS, 452, 3092
- Jia et al. (2014) Jia, Y., Du, C., Wu, Z., et al. 2014, MNRAS, 441, 503
- Lasker et al. (2008) Lasker, B. M., Lattanzi, M. G., McLean, B. J., et al. 2008, AJ, 136, 735
- Nie et al. (2015) Nie, J. D., Smith, M. C., Belokurov, V., et al. 2015, ApJ, 810, 153
- Peng et al. (2015) Peng, X., Qi, Z., Wu, Z., et al. 2015, PASP, 127, 250
- Qi et al. (2015) Qi, Z., Yu, Y., Bucciarelli, B., et al. 2015, AJ, 150, 137
- Raichoor et al. (2015) Raichoor, A., Comparat, J., Delubac, T., et al. 2015, arXiv:1505.01797
- Schlegel et al. (1998) Schlegel, D. J., Finkbeiner, D. P., & Davis, M. 1998, ApJ, 500, 525
- York et al. (2000) York, D. G., Adelman, J., Anderson, J. E., Jr., et al. 2000, AJ, 120, 1579
- Zou et al. (2015a) Zou, H., Jiang, Z.-J., Zhou, X., et al. 2015a, AJ, 150, 104
- Zou et al. (2015b) Zou, H., Wu, X.-b., Zhou, X., et al. 2015b, PASP, 127, 94