Fast and Accurate Deep Network Learning by Exponential Linear Units (ELUs)
Abstract
We introduce the “exponential linear unit” (ELU) which speeds up learning in deep neural networks and leads to higher classification accuracies. Like rectified linear units (ReLUs), leaky ReLUs (LReLUs) and parametrized ReLUs (PReLUs), ELUs alleviate the vanishing gradient problem via the identity for positive values. However ELUs have improved learning characteristics compared to the units with other activation functions. In contrast to ReLUs, ELUs have negative values which allows them to push mean unit activations closer to zero like batch normalization but with lower computational complexity. Mean shifts toward zero speed up learning by bringing the normal gradient closer to the unit natural gradient because of a reduced bias shift effect. While LReLUs and PReLUs have negative values, too, they do not ensure a noise-robust deactivation state. ELUs saturate to a negative value with smaller inputs and thereby decrease the forward propagated variation and information. Therefore ELUs code the degree of presence of particular phenomena in the input, while they do not quantitatively model the degree of their absence.
In experiments, ELUs lead not only to faster learning, but also to significantly better generalization performance than ReLUs and LReLUs on networks with more than 5 layers. On CIFAR-100 ELUs networks significantly outperform ReLU networks with batch normalization while batch normalization does not improve ELU networks. ELU networks are among the top 10 reported CIFAR-10 results and yield the best published result on CIFAR-100, without resorting to multi-view evaluation or model averaging. On ImageNet, ELU networks considerably speed up learning compared to a ReLU network with the same architecture, obtaining less than 10% classification error for a single crop, single model network.
1 Introduction
Currently the most popular activation function for neural networks is the rectified linear unit (ReLU), which was first proposed for restricted Boltzmann machines (Nair & Hinton, 2010) and then successfully used for neural networks (Glorot et al., 2011). The ReLU activation function is the identity for positive arguments and zero otherwise. Besides producing sparse codes, the main advantage of ReLUs is that they alleviate the vanishing gradient problem (Hochreiter, 1998; Hochreiter et al., 2001) since the derivative of 1 for positive values is not contractive (Glorot et al., 2011). However ReLUs are non-negative and, therefore, have a mean activation larger than zero.
Units that have a non-zero mean activation act as bias for the next layer. If such units do not cancel each other out, learning causes a bias shift for units in next layer. The more the units are correlated, the higher their bias shift. We will see that Fisher optimal learning, i.e., the natural gradient (Amari, 1998), would correct for the bias shift by adjusting the weight updates. Thus, less bias shift brings the standard gradient closer to the natural gradient and speeds up learning. We aim at activation functions that push activation means closer to zero to decrease the bias shift effect.
Centering the activations at zero has been proposed in order to keep the off-diagonal entries of the Fisher information matrix small (Raiko et al., 2012). For neural network it is known that centering the activations speeds up learning (LeCun et al., 1991; 1998; Schraudolph, 1998). “Batch normalization” also centers activations with the goal to counter the internal covariate shift (Ioffe & Szegedy, 2015). Also the Projected Natural Gradient Descent algorithm (PRONG) centers the activations by implicitly whitening them (Desjardins et al., 2015).
An alternative to centering is to push the mean activation toward zero by an appropriate activation function. Therefore has been preferred over logistic functions (LeCun et al., 1991; 1998). Recently “Leaky ReLUs” (LReLUs) that replace the negative part of the ReLU with a linear function have been shown to be superior to ReLUs (Maas et al., 2013). Parametric Rectified Linear Units (PReLUs) generalize LReLUs by learning the slope of the negative part which yielded improved learning behavior on large image benchmark data sets (He et al., 2015). Another variant are Randomized Leaky Rectified Linear Units (RReLUs) which randomly sample the slope of the negative part which raised the performance on image benchmark datasets and convolutional networks (Xu et al., 2015).
In contrast to ReLUs, activation functions like LReLUs, PReLUs, and RReLUs do not ensure a noise-robust deactivation state. We propose an activation function that has negative values to allow for mean activations close to zero, but which saturates to a negative value with smaller arguments. The saturation decreases the variation of the units if deactivated, so the precise deactivation argument is less relevant. Such an activation function can code the degree of presence of particular phenomena in the input, but does not quantitatively model the degree of their absence. Therefore, such an activation function is more robust to noise. Consequently, dependencies between coding units are much easier to model and much easier to interpret since only activated code units carry much information. Furthermore, distinct concepts are much less likely to interfere with such activation functions since the deactivation state is non-informative, i.e. variance decreasing.
2 Bias Shift Correction Speeds Up Learning
To derive and analyze the bias shift effect mentioned in the introduction, we utilize the natural gradient. The natural gradient corrects the gradient direction with the inverse Fisher information matrix and, thereby, enables Fisher optimal learning, which ensures the steepest descent in the Riemannian parameter manifold and Fisher efficiency for online learning (Amari, 1998). The recently introduced Hessian-Free Optimization technique (Martens, 2010) and the Krylov Subspace Descent methods (Vinyals & Povey, 2012) use an extended Gauss-Newton approximation of the Hessian, therefore they can be interpreted as versions of natural gradient descent (Pascanu & Bengio, 2014).
Since for neural networks the Fisher information matrix is typically too expensive to compute, different approximations of the natural gradient have been proposed. Topmoumoute Online natural Gradient Algorithm (TONGA) (LeRoux et al., 2008) uses a low-rank approximation of natural gradient descent. FActorized Natural Gradient (FANG) (Grosse & Salakhudinov, 2015) estimates the natural gradient via an approximation of the Fisher information matrix by a Gaussian graphical model. The Fisher information matrix can be approximated by a block-diagonal matrix, where unit or quasi-diagonal natural gradients are used (Olivier, 2013). Unit natural gradients or “Unitwise Fisher’s scoring” (Kurita, 1993) are based on natural gradients for perceptrons (Amari, 1998; Yang & Amari, 1998). We will base our analysis on the unit natural gradient.
We assume a parameterized probabilistic model with parameter vector and data . The training data are with , where is the input for example and is its label. is the loss of example using model . The average loss on the training data is the empirical risk . Gradient descent updates the weight vector by where is the learning rate. The natural gradient is the inverse Fisher information matrix multiplied by the gradient of the empirical risk: . For a multi-layer perceptron is the unit activation vector and is the bias unit activation. We consider the ingoing weights to unit , therefore we drop the index : for the weight from unit to unit , for the activation, and for the bias weight of unit . The activation function maps the net input of unit to its activation . For computing the Fisher information matrix, the derivative of the log-output probability is required. Therefore we define the at unit as , which can be computed via backpropagation, but using the log-output probability instead of the conventional loss function. The derivative is .
We restrict the Fisher information matrix to weights leading to unit which is the unit Fisher information matrix . captures only the interactions of weights to unit . Consequently, the unit natural gradient only corrects the interactions of weights to unit , i.e. considers the Riemannian parameter manifold only in a subspace. The unit Fisher information matrix is
| (1) |
Weighting the activations by is equivalent to adjusting the probability of drawing inputs . Inputs with large are drawn with higher probability. Since , we can define a distribution :
| (2) |
Using , the entries of can be expressed as second moments:
| (3) |
If the bias unit is with weight then the weight vector can be divided into a bias part and the rest : . For the row that corresponds to the bias weight, we have:
| (4) |
The next Theorem 1 gives the correction of the standard gradient by the unit natural gradient where the bias weight is treated separately (see also Yang & Amari (1998)).
Theorem 1.
The unit natural gradient corrects the weight update to a unit by following affine transformation of the gradient :
| (5) |
where is the unit Fisher information matrix without row 0 and column 0 corresponding to the bias weight. The vector is the zeroth column of corresponding to the bias weight, and the positive scalar is
| (6) |
where is the vector of activations of units with weights to unit and .
Proof.
Multiplying the inverse Fisher matrix with the separated gradient gives the weight update :
| (7) |
where
| (8) |
The bias shift (mean shift) of unit is the change of unit ’s mean value due to the weight update. Bias shifts of unit lead to oscillations and impede learning. See Section 4.4 in LeCun et al. (1998) for demonstrating this effect at the inputs and in LeCun et al. (1991) for explaining this effect using the input covariance matrix. Such bias shifts are mitigated or even prevented by the unit natural gradient. The bias shift correction of the unit natural gradient is the effect on the bias shift due to which captures the interaction between the bias unit and the incoming units. Without bias shift correction, i.e., and , the weight updates are and . As only the activations depend on the input, the bias shift can be computed by multiplying the weight update by the mean of the activation vector . Thus we obtain the bias shift . The bias shift strongly depends on the correlation of the incoming units which is captured by .
Next, Theorem 2 states that the bias shift correction by the unit natural gradient can be considered to correct the incoming mean proportional to toward zero.
Theorem 2.
The bias shift correction by the unit natural gradient is equivalent to an additive correction of the incoming mean by and a multiplicative correction of the bias unit by , where
| (11) |
Proof.
Using , the bias shift is:
| (12) | |||
In Theorem 2 we can reformulate . Therefore increases with the length of for given variances and covariances. Consequently the bias shift correction through the unit natural gradient is governed by the length of . The bias shift correction is zero for since does not correct the bias unit multiplicatively. Using Eq. (4), is split into an offset and an information containing term:
| (14) |
In general, smaller positive lead to smaller positive , therefore to smaller corrections. The reason is that in general the largest absolute components of are positive, since activated inputs will activate the unit which in turn will have large impact on the output.
To summarize, the unit natural gradient corrects the bias shift of unit via the interactions of incoming units with the bias unit to ensure efficient learning. This correction is equivalent to shifting the mean activations of the incoming units toward zero and scaling up the bias unit. To reduce the undesired bias shift effect without the natural gradient, either the (i) activation of incoming units can be centered at zero or (ii) activation functions with negative values can be used. We introduce a new activation function with negative values while keeping the identity for positive arguments where it is not contradicting.
3 Exponential Linear Units (ELUs)
The exponential linear unit (ELU) with is
| (15) |
The ELU hyperparameter controls the value to which an ELU saturates for negative net inputs (see Fig. 1). ELUs diminish the vanishing gradient effect as rectified linear units (ReLUs) and leaky ReLUs (LReLUs) do. The vanishing gradient problem is alleviated because the positive part of these functions is the identity, therefore their derivative is one and not contractive. In contrast, and sigmoid activation functions are contractive almost everywhere.
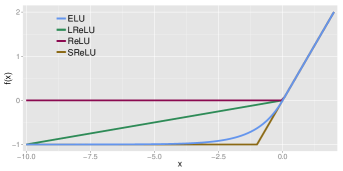
In contrast to ReLUs, ELUs have negative values which pushes the mean of the activations closer to zero. Mean activations that are closer to zero enable faster learning as they bring the gradient closer to the natural gradient (see Theorem 2 and text thereafter). ELUs saturate to a negative value when the argument gets smaller. Saturation means a small derivative which decreases the variation and the information that is propagated to the next layer. Therefore the representation is both noise-robust and low-complex (Hochreiter & Schmidhuber, 1999). ELUs code the degree of presence of input concepts, while they neither quantify the degree of their absence nor distinguish the causes of their absence. This property of non-informative deactivation states is also present at ReLUs and allowed to detect biclusters corresponding to biological modules in gene expression datasets (Clevert et al., 2015) and to identify toxicophores in toxicity prediction (Unterthiner et al., 2015; Mayr et al., 2015). The enabling features for these interpretations is that activation can be clearly distinguished from deactivation and that only active units carry relevant information and can crosstalk.
4 Experiments Using ELUs
In this section, we assess the performance of exponential linear units (ELUs) if used for unsupervised and supervised learning of deep autoencoders and deep convolutional networks. ELUs with are compared to (i) Rectified Linear Units (ReLUs) with activation , (ii) Leaky ReLUs (LReLUs) with activation (), and (iii) Shifted ReLUs (SReLUs) with activation . Comparisons are done with and without batch normalization. The following benchmark datasets are used: (i) MNIST (gray images in 10 classes, 60k train and 10k test), (ii) CIFAR-10 (color images in 10 classes, 50k train and 10k test), (iii) CIFAR-100 (color images in 100 classes, 50k train and 10k test), and (iv) ImageNet (color images in 1,000 classes, 1.3M train and 100k tests).
4.1 MNIST
4.1.1 Learning Behavior
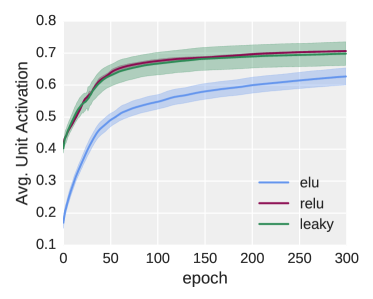
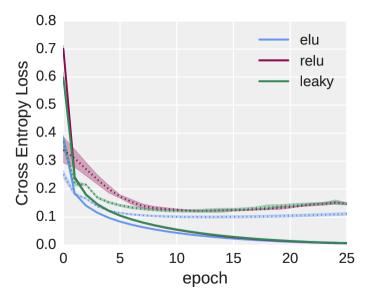
We first want to verify that ELUs keep the mean activations closer to zero than other units. Fully connected deep neural networks with ELUs (), ReLUs, and LReLUs () were trained on the MNIST digit classification dataset while each hidden unit’s activation was tracked. Each network had eight hidden layers of 128 units each, and was trained for 300 epochs by stochastic gradient descent with learning rate and mini-batches of size 64. The weights have been initialized according to (He et al., 2015). After each epoch we calculated the units’ average activations on a fixed subset of the training data. Fig. 2 shows the median over all units along learning. ELUs stay have smaller median throughout the training process. The training error of ELU networks decreases much more rapidly than for the other networks.
Section C in the appendix compares the variance of median activation in ReLU and ELU networks. The median varies much more in ReLU networks. This indicates that ReLU networks continuously try to correct the bias shift introduced by previous weight updates while this effect is much less prominent in ELU networks.
4.1.2 Autoencoder Learning
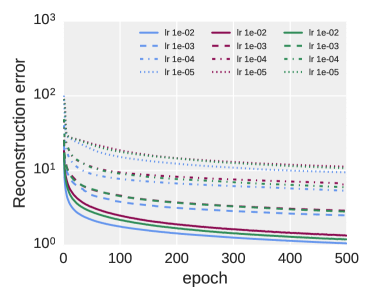
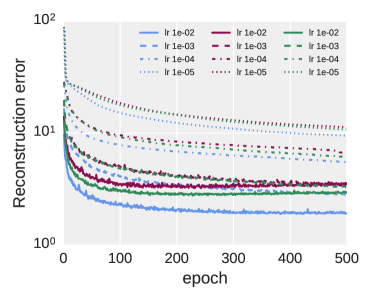
To evaluate ELU networks at unsupervised settings, we followed Martens (2010) and Desjardins et al. (2015) and trained a deep autoencoder on the MNIST dataset. The encoder part consisted of four fully connected hidden layers with sizes 1000, 500, 250 and 30, respectively. The decoder part was symmetrical to the encoder. For learning we applied stochastic gradient descent with mini-batches of 64 samples for 500 epochs using the fixed learning rates (). Fig. 3 shows, that ELUs outperform the competing activation functions in terms of training / test set reconstruction error for all learning rates. As already noted by Desjardins et al. (2015), higher learning rates seem to perform better.
4.2 Comparison of Activation Functions
In this subsection we show that ELUs indeed possess a superior learning behavior compared to other activation functions as postulated in Section 3. Furthermore we show that ELU networks perform better than ReLU networks with batch normalization. We use as benchmark dataset CIFAR-100 and use a relatively simple convolutional neural network (CNN) architecture to keep the computational complexity reasonable for comparisons.
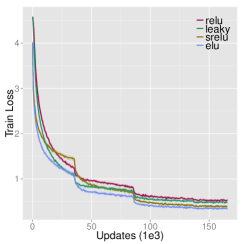
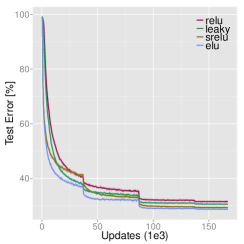
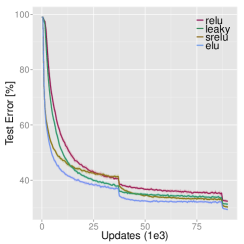
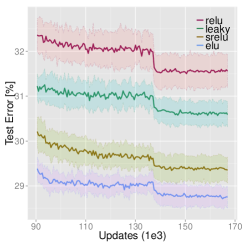
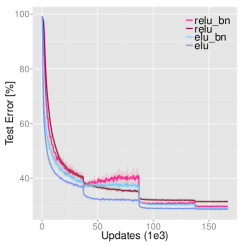
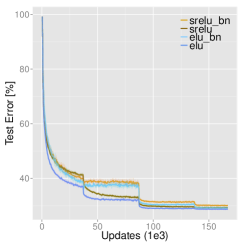
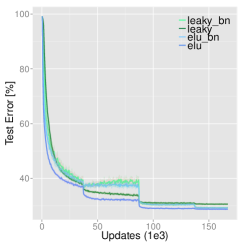
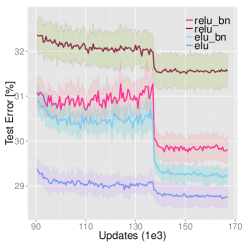
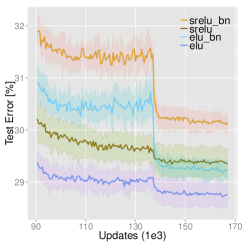
The CNN for these CIFAR-100 experiments consists of 11 convolutional layers arranged in stacks of () layers units receptive fields. 22 max-pooling with a stride of 2 was applied after each stack. For network regularization we used the following drop-out rate for the last layer of each stack (). The -weight decay regularization term was set to . The following learning rate schedule was applied () (iterations [learning rate]). For fair comparisons, we used this learning rate schedule for all networks. During previous experiments, this schedule was optimized for ReLU networks, however as ELUs converge faster they would benefit from an adjusted schedule. The momentum term learning rate was fixed to 0.9. The dataset was preprocessed as described in Goodfellow et al. (2013) with global contrast normalization and ZCA whitening. Additionally, the images were padded with four zero pixels at all borders. The model was trained on random crops with random horizontal flipping. Besides that, we no further augmented the dataset during training. Each network was run 10 times with different weight initialization. Across networks with different activation functions the same run number had the same initial weights.
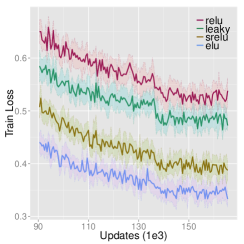
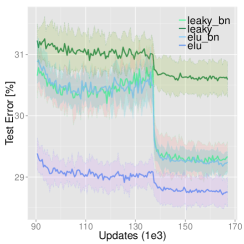
Mean test error results of networks with different activation functions are compared in Fig. 4, which also shows the standard deviation. ELUs yield on average a test error of 28.75(0.24)%, while SReLUs, ReLUs and LReLUs yield 29.35(0.29)%, 31.56(0.37)% and 30.59(0.29)%, respectively. ELUs achieve both lower training loss and lower test error than ReLUs, LReLUs, and SReLUs. Both the ELU training and test performance is significantly better than for other activation functions (Wilcoxon signed-rank test with -value0.001). Batch normalization improved ReLU and LReLU networks, but did not improve ELU and SReLU networks (see Fig. 5). ELU networks significantly outperform ReLU networks with batch normalization (Wilcoxon signed-rank test with -value0.001).
4.3 Classification Performance on CIFAR-100 and CIFAR-10
The following experiments should highlight the generalization capabilities of ELU networks. The CNN architecture is more sophisticated than in the previous subsection and consists of 18 convolutional layers arranged in stacks of (). Initial drop-out rate, Max-pooling after each stack, -weight decay, momentum term, data preprocessing, padding, and cropping were as in previous section. The initial learning rate was set to 0.01 and decreased by a factor of 10 after 35k iterations. The mini-batch size was 100. For the final 50k iterations fine-tuning we increased the drop-out rate for all layers in a stack to (), thereafter increased the drop-out rate by a factor of 1.5 for 40k additional iterations.
| Network | CIFAR-10 (test error %) | CIFAR-100 (test error %) | augmented |
|---|---|---|---|
| AlexNet | 18.04 | 45.80 | |
| DSN | 7.97 | 34.57 | |
| NiN | 8.81 | 35.68 | |
| Maxout | 9.38 | 38.57 | |
| All-CNN | 7.25 | 33.71 | |
| Highway Network | 7.60 | 32.24 | |
| Fract. Max-Pooling | 4.50 | 27.62 | |
| ELU-Network | 6.55 | 24.28 |
ELU networks are compared to following recent successful CNN architectures: AlexNet (Krizhevsky et al., 2012), DSN (Lee et al., 2015), NiN (Lin et al., 2013), Maxout (Goodfellow et al., 2013), All-CNN (Springenberg et al., 2014), Highway Network (Srivastava et al., 2015) and Fractional Max-Pooling (Graham, 2014). The test error in percent misclassification are given in Tab. 1. ELU-networks are the second best on CIFAR-10 with a test error of 6.55% but still they are among the top 10 best results reported for CIFAR-10. ELU networks performed best on CIFAR-100 with a test error of 24.28%. This is the best published result on CIFAR-100, without even resorting to multi-view evaluation or model averaging.
4.4 ImageNet Challenge Dataset
Finally, we evaluated ELU-networks on the 1000-class ImageNet dataset. It contains about 1.3M training color images as well as additional 50k images and 100k images for validation and testing, respectively. For this task, we designed a 15 layer CNN, which was arranged in stacks of () layers units receptive fields or fully-connected (FC). 22 max-pooling with a stride of 2 was applied after each stack and spatial pyramid pooling (SPP) with 3 levels before the first FC layer (He et al., 2015). For network regularization we set the -weight decay term to and used 50% drop-out in the two penultimate FC layers. Images were re-sized to 256256 pixels and per-pixel mean subtracted. Trained was on random crops with random horizontal flipping. Besides that, we did not augment the dataset during training.

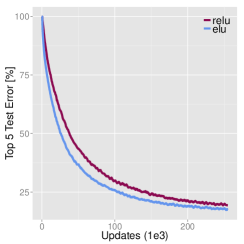
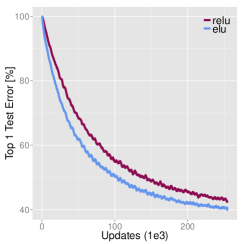
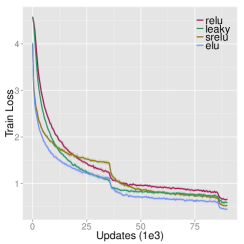
Fig. 6 shows the learning behavior of ELU vs. ReLU networks. Panel (b) shows that ELUs start reducing the error earlier. The ELU-network already reaches the 20% top-5 error after 160k iterations, while the ReLU network needs 200k iterations to reach the same error rate. The single-model performance was evaluated on the single center crop with no further augmentation and yielded a top-5 validation error below 10%.
Currently ELU nets are 5% slower on ImageNet than ReLU nets. The difference is small because activation functions generally have only minor influence on the overall training time (Jia, 2014). In terms of wall clock time, ELUs require 12.15h vs. ReLUs with 11.48h for 10k iterations. We expect that ELU implementations can be improved, e.g. by faster exponential functions (Schraudolph, 1999).
5 Conclusion
We have introduced the exponential linear units (ELUs) for faster and more precise learning in deep neural networks. ELUs have negative values, which allows the network to push the mean activations closer to zero. Therefore ELUs decrease the gap between the normal gradient and the unit natural gradient and, thereby speed up learning. We believe that this property is also the reason for the success of activation functions like LReLUs and PReLUs and of batch normalization. In contrast to LReLUs and PReLUs, ELUs have a clear saturation plateau in its negative regime, allowing them to learn a more robust and stable representation. Experimental results show that ELUs significantly outperform other activation functions on different vision datasets. Further ELU networks perform significantly better than ReLU networks trained with batch normalization. ELU networks achieved one of the top 10 best reported results on CIFAR-10 and set a new state of the art in CIFAR-100 without the need for multi-view test evaluation or model averaging. Furthermore, ELU networks produced competitive results on the ImageNet in much fewer epochs than a corresponding ReLU network. Given their outstanding performance, we expect ELU networks to become a real time saver in convolutional networks, which are notably time-intensive to train from scratch otherwise.
Acknowledgment.
We thank the NVIDIA Corporation for supporting this research with several Titan X GPUs and Roland Vollgraf and Martin Heusel for helpful discussions and comments on this work.
References
- Amari (1998) Amari, S.-I. Natural gradient works efficiently in learning. Neural Computation, 10(2):251–276, 1998.
- Clevert et al. (2015) Clevert, D.-A., Unterthiner, T., Mayr, A., and Hochreiter, S. Rectified factor networks. In Cortes, C., Lawrence, N. D., Lee, D. D., Sugiyama, M., and Garnett, R. (eds.), Advances in Neural Information Processing Systems 28. Curran Associates, Inc., 2015.
- Desjardins et al. (2015) Desjardins, G., Simonyan, K., Pascanu, R., and Kavukcuoglu, K. Natural neural networks. CoRR, abs/1507.00210, 2015. URL http://arxiv.org/abs/1507.00210.
- Glorot et al. (2011) Glorot, X., Bordes, A., and Bengio, Y. Deep sparse rectifier neural networks. In Gordon, G., Dunson, D., and Dud k, M. (eds.), JMLR W&CP: Proceedings of the Fourteenth International Conference on Artificial Intelligence and Statistics (AISTATS 2011), volume 15, pp. 315–323, 2011.
- Goodfellow et al. (2013) Goodfellow, I. J., Warde-Farley, D., Mirza, M., Courville, A., and Bengio, Y. Maxout networks. ArXiv e-prints, 2013.
- Graham (2014) Graham, Benjamin. Fractional max-pooling. CoRR, abs/1412.6071, 2014. URL http://arxiv.org/abs/1412.6071.
- Grosse & Salakhudinov (2015) Grosse, R. and Salakhudinov, R. Scaling up natural gradient by sparsely factorizing the inverse Fisher matrix. Journal of Machine Learning Research, 37:2304–2313, 2015. URL http://jmlr.org/proceedings/papers/v37/grosse15.pdf. Proceedings of the 32nd International Conference on Machine Learning (ICML15).
- He et al. (2015) He, K., Zhang, X., Ren, S., and Sun, J. Delving deep into rectifiers: Surpassing human-level performance on imagenet classification. In IEEE International Conference on Computer Vision (ICCV), 2015.
- Hochreiter (1998) Hochreiter, S. The vanishing gradient problem during learning recurrent neural nets and problem solutions. International Journal of Uncertainty, Fuzziness and Knowledge-Based Systems, 6(2):107–116, 1998.
- Hochreiter & Schmidhuber (1999) Hochreiter, S. and Schmidhuber, J. Feature extraction through LOCOCODE. Neural Computation, 11(3):679–714, 1999.
- Hochreiter et al. (2001) Hochreiter, S., Bengio, Y., Frasconi, P., and Schmidhuber, J. Gradient flow in recurrent nets: the difficulty of learning long-term dependencies. In Kremer and Kolen (eds.), A Field Guide to Dynamical Recurrent Neural Networks. IEEE Press, 2001.
- Ioffe & Szegedy (2015) Ioffe, S. and Szegedy, C. Batch normalization: Accelerating deep network training by reducing internal covariate shift. Journal of Machine Learning Research, 37:448–456, 2015. URL http://jmlr.org/proceedings/papers/v37/ioffe15.pdf. Proceedings of the 32nd International Conference on Machine Learning (ICML15).
- Jia (2014) Jia, Yangqing. Learning Semantic Image Representations at a Large Scale. PhD thesis, EECS Department, University of California, Berkeley, May 2014. URL http://www.eecs.berkeley.edu/Pubs/TechRpts/2014/EECS-2014-93.html.
- Krizhevsky et al. (2012) Krizhevsky, A., Sutskever, I., and Hinton, G. E. ImageNet classification with deep convolutional neural networks. In Pereira, F., Burges, C. J. C., Bottou, L., and Weinberger, K. Q. (eds.), Advances in Neural Information Processing Systems 25, pp. 1097–1105. Curran Associates, Inc., 2012.
- Kurita (1993) Kurita, T. Iterative weighted least squares algorithms for neural networks classifiers. In Proceedings of the Third Workshop on Algorithmic Learning Theory (ALT92), volume 743 of Lecture Notes in Computer Science, pp. 77–86. Springer, 1993.
- LeCun et al. (1991) LeCun, Y., Kanter, I., and Solla, S. A. Eigenvalues of covariance matrices: Application to neural-network learning. Physical Review Letters, 66(18):2396–2399, 1991.
- LeCun et al. (1998) LeCun, Y., Bottou, L., Orr, G. B., and Müller, K.-R. Efficient backprop. In Orr, G. B. and Müller, K.-R. (eds.), Neural Networks: Tricks of the Trade, volume 1524 of Lecture Notes in Computer Science, pp. 9–50. Springer, 1998.
- Lee et al. (2015) Lee, Chen-Yu, Xie, Saining, Gallagher, Patrick W., Zhang, Zhengyou, and Tu, Zhuowen. Deeply-supervised nets. In AISTATS, 2015.
- LeRoux et al. (2008) LeRoux, N., Manzagol, P.-A., and Bengio, Y. Topmoumoute online natural gradient algorithm. In Platt, J. C., Koller, D., Singer, Y., and Roweis, S. T. (eds.), Advances in Neural Information Processing Systems 20 (NIPS), pp. 849–856, 2008.
- Lin et al. (2013) Lin, Min, Chen, Qiang, and Yan, Shuicheng. Network in network. CoRR, abs/1312.4400, 2013. URL http://arxiv.org/abs/1312.4400.
- Maas et al. (2013) Maas, A. L., Hannun, A. Y., and Ng, A. Y. Rectifier nonlinearities improve neural network acoustic models. In Proceedings of the 30th International Conference on Machine Learning (ICML13), 2013.
- Martens (2010) Martens, J. Deep learning via Hessian-free optimization. In Fürnkranz, J. and Joachims, T. (eds.), Proceedings of the 27th International Conference on Machine Learning (ICML10), pp. 735–742, 2010.
- Mayr et al. (2015) Mayr, A., Klambauer, G., Unterthiner, T., and Hochreiter, S. DeepTox: Toxicity prediction using deep learning. Front. Environ. Sci., 3(80), 2015. doi: 10.3389/fenvs.2015.00080. URL http://journal.frontiersin.org/article/10.3389/fenvs.2015.00080.
- Nair & Hinton (2010) Nair, V. and Hinton, G. E. Rectified linear units improve restricted Boltzmann machines. In Fürnkranz, J. and Joachims, T. (eds.), Proceedings of the 27th International Conference on Machine Learning (ICML10), pp. 807–814, 2010.
- Olivier (2013) Olivier, Y. Riemannian metrics for neural networks i: feedforward networks. CoRR, abs/1303.0818, 2013. URL http://arxiv.org/abs/1303.0818.
- Pascanu & Bengio (2014) Pascanu, R. and Bengio, Y. Revisiting natural gradient for deep networks. In International Conference on Learning Representations 2014, 2014. URL http://arxiv.org/abs/1301.3584. arXiv:1301.3584.
- Raiko et al. (2012) Raiko, T., Valpola, H., and LeCun, Y. Deep learning made easier by linear transformations in perceptrons. In Lawrence, N. D. and Girolami, M. A. (eds.), Proceedings of the 15th International Conference on Artificial Intelligence and Statistics (AISTATS12), volume 22, pp. 924–932, 2012.
- Schraudolph (1998) Schraudolph, N. N. Centering neural network gradient factor. In Orr, G. B. and Müller, K.-R. (eds.), Neural Networks: Tricks of the Trade, volume 1524 of Lecture Notes in Computer Science, pp. 207–226. Springer, 1998.
- Schraudolph (1999) Schraudolph, Nicol N. A Fast, Compact Approximation of the Exponential Function. Neural Computation, 11:853–862, 1999.
- Springenberg et al. (2014) Springenberg, Jost Tobias, Dosovitskiy, Alexey, Brox, Thomas, and Riedmiller, Martin A. Striving for simplicity: The all convolutional net. CoRR, abs/1412.6806, 2014. URL http://arxiv.org/abs/1412.6806.
- Srivastava et al. (2015) Srivastava, Rupesh Kumar, Greff, Klaus, and Schmidhuber, Jürgen. Training very deep networks. CoRR, abs/1507.06228, 2015. URL http://arxiv.org/abs/1507.06228.
- Unterthiner et al. (2015) Unterthiner, T., Mayr, A., Klambauer, G., and Hochreiter, S. Toxicity prediction using deep learning. CoRR, abs/1503.01445, 2015. URL http://arxiv.org/abs/1503.01445.
- Vinyals & Povey (2012) Vinyals, O. and Povey, D. Krylov subspace descent for deep learning. In AISTATS, 2012. URL http://arxiv.org/pdf/1111.4259v1. arXiv:1111.4259.
- Xu et al. (2015) Xu, B., Wang, N., Chen, T., and Li, M. Empirical evaluation of rectified activations in convolutional network. CoRR, abs/1505.00853, 2015. URL http://arxiv.org/abs/1505.00853.
- Yang & Amari (1998) Yang, H. H. and Amari, S.-I. Complexity issues in natural gradient descent method for training multilayer perceptrons. Neural Computation, 10(8), 1998.
Appendix A Inverse of Block Matrices
Lemma 1.
The positive definite matrix is in block format with matrix , vector , and scalar . The inverse of is
| (16) |
where
| (17) | ||||
| (18) | ||||
| (19) |
Proof.
For block matrices the inverse is
| (20) |
where the matrices on the right hand side are:
| (21) | ||||
| (22) | ||||
| (23) | ||||
| (24) |
Further if follows that
| (25) |
We now use this formula for being a vector and a scalar. We obtain
| (26) |
where the right hand side matrices, vectors, and the scalar are:
| (27) | ||||
| (28) | ||||
| (29) | ||||
| (30) |
Again it follows that
| (31) |
A reformulation using gives
| (32) | ||||
| (33) | ||||
| (34) | ||||
| (35) |
∎
Appendix B Quadratic Form of Mean and Inverse Second Moment
Lemma 2.
For a random variable holds
| (36) |
and
| (37) |
Furthermore holds
| (38) | |||
Proof.
The Sherman-Morrison Theorem states
| (39) |
Therefore we have
| (40) | ||||
Using the identity
| (41) |
for the second moment and Eq. (40), we get
| (42) | |||
The last inequality follows from the fact that is positive definite. From last equation, we obtain further
| (43) |
Therefore we get
| (46) | |||
∎
Appendix C Variance of Mean Activations in ELU and ReLU Networks
To compare the variance of median activation in ReLU and ELU networks, we trained a neural network with 5 hidden layers of 256 hidden units for 200 epochs using a learning rate of 0.01, once using ReLU and once using ELU activation functions on the MNIST dataset. After each epoch, we calculated the median activation of each hidden unit on the whole training set. We then calculated the variance of these changes, which is depicted in Figure 7 . The median varies much more in ReLU networks. This indicates that ReLU networks continuously try to correct the bias shift introduced by previous weight updates while this effect is much less prominent in ELU networks.

