Sensitivity Study of Searching for at HIEPA
Abstract
The charged lepton flavor violation process is a clean and sensitive probe of new physics beyond the Standard Model. A sensitivity study is performed to the process based on a 3 fb-1 inclusive Monte Carlo sample of collisions at a center-of-mass energy of 4.26 or 4.6 GeV, in the framework of the BESIII software system. The 90% confidence level upper limits on are estimated assuming no signal is produced. We also obtain the sensitivity on as a function of the integrated luminosity, to serve as a reference for the HIEPA being proposed in China. It is found that 6.34 ab-1 are needed to reach the current best upper limit of and about 2510 ab-1 are needed to reach a sensitivity of if the detector design is similar to that of BESIII.
pacs:
13.35.Dx, 11.30.Fs, 14.60.FgI Introduction
Lepton flavor violation (LFV) in charged lepton decays is forbidden in the Standard Model (SM) and is highly suppressed even if mixing between neutrino flavors is taken into account SM since the rates of LFV processes are suppressed by the fourth power of , where and are the masses of neutrino and boson PDG , respectively. On the other hand, the rates of LFV may be enhanced to observable level in various new physics scenarios beyond the SM, such as the Minimal Supersymmetric extension of the SM (MSSM) SSM , Grand Unified Theories grand , and seesaw mechanisms SEESAW .
In these models, decay is an ideal probe to new physics because it is the heaviest charged lepton with many possible LFV decay modes. The branching fractions from the model predictions are in a range of review , which are as high as the experimental sensitivity in current B-factory experiments, and the radiative decays and are regarded as golden channels footnote . LFV process can also be searched for in conversion. SINDRUM II Collaboration studied conversion in a muonic atom, giving 10-13 at a 90% confidence level (C.L.) mue1 . Future Mu2e experiment is expected to reduce the upper limit of to 6 10-17 mue2 .
Observation of LFV will be a clear signal of new physics, it directly addresses the physics of flavor and of generations. The searches for LFV have been a long history (for a review, see Ref. review ), however, no evidence has ever been observed. The best upper limits at a 90% confidence level are and , obtained by the BaBar experiment using 963 million decays babar .
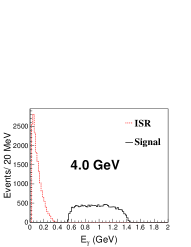
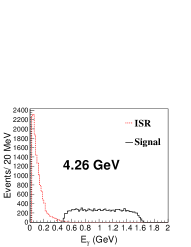
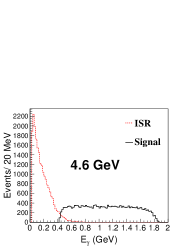
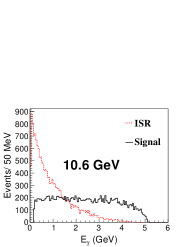
For a search at the B-factories, the dominant background originates from with initial state radiation (ISR), i.e., , where one of the s decays semi-leptonically and the final state lepton and the ISR photon compose signal candidates babar . Such a background can be avoided at the lower center-of-mass (CM) energy () at a -charm factory. Figure 1 shows the photon energy distributions for , 4.26, 4.6 and 10.6 GeV, from Monte Carlo (MC) simulated , , kkmc1 ; kkmc2 . We can see that the background of , where the ISR photon is misidentified as arising from decays, can be removed easily by accepting as signal candidates only those photons whose energy lies above a certain threshold at 4.0 and 4.26 GeV without efficiency loss. Thus the expected background level is much lower at around 4 GeV than at higher energies.
A super -charm factory, called High Intensity Electron Positron Accelerator (HIEPA) HIEPA , is being proposed in China. The design peak luminosity is at GeV with an energy range of 2 to 7 GeV. The HIEPA detector is designed to be consists of a small-cell main drift chamber (MDC) with 48 layers, an electro-magnetic calorimeter (EMC), a ring imaging cherenkov counter (RICH) for particle identification, and a muon detector using muon telescope detector (MTD) method. For the expected performance of each subdetector, see Ref. HIEPA .
The events will be produced copiously above the threshold. This will make a search for the LFV process possible. As has been shown in Fig. 1, the background level is expected to be much lower at a -charm factory than at B-factories, and therefore it is of great interest to know what sensitivity HIEPA can reach in searching for and other LFV processes.
In this article, we present a MC study for searching for the LFV process using a 3 fb-1 inclusive MC sample and estimate the sensitivity of measuring at and 4.6 GeV. We also extrapolate our study to obtain a sensitivity on versus integrated luminosity at 4.26 GeV. Finally we estimate the integrated luminosity needed at HIEPA to reach the current best upper limit of and to compete with the sensitivity of that the Belle-II experiment is expected to achieve in the near future.
We have undertaken these studies assuming that the general performance of the detector constructed for HIEPA will be similar to that of the BESIII detector BESdetector . We do the MC simulations in the framework of BESIII offline software system (boss) boss . In the next section, we first briefly introduce the BESIII detector and boss, and then present the inclusive MC samples we used for the background study for .
II BESIII Detector and Inclusive MC Samples
The BESIII detector is a magnetic spectrometer operating at the BEPCII Collider. The cylindrical core of the BESIII detector consists of a helium-based main drift chamber, a plastic scintillator time-of-flight system (TOF), and a CsI (Tl) electromagnetic calorimeter, which are all enclosed in a super-conducting solenoid magnet providing a 1.0 T magnetic field. The solenoid is supported by an octagonal flux-return yoke with modules of resistive plate muon counters (MUC) interleaved with steel. A detailed description of the BESIII detector is provided in Ref. BESdetector .
The optimization of the event selection and the estimation of physics backgrounds are performed through MC simulations. The geant4-based simulation software boost BOOST includes the geometric and material description of the BESIII detector and the detector response and digitization models, as well as the tracking of the detector running conditions and performance. The analysis is performed in the framework of boss boss which takes care of the detector calibration, event reconstruction and data storage.
The production of the charmonium resonance is simulated by the MC event generator kkmc kkmc1 ; kkmc2 , while the decays are generated by EvtGen evtgen for known decay modes with branching fractions being set to the PDG PDG world average values, and by lundcharm lundcharm for the remaining unknown decays. The processes and () are also simulated using kkmc based on precise predictions of the electroweak SM. The generator babayaga is used to generate , , , and processes BABAYAGA . BesTwogam is an inclusive generator developed from the generator Twogam based on the equivalent photon approximation approach and using full quantum electrodynamics differential cross section for the process , BES2GAMMA . For more information on the generators used at BESIII, see Ref. evtgen .
Signal MC samples of , , are generated at and 4.6 GeV, to determine the detection efficiencies. Tables 1 and 2 summarize the generated MC samples for background studies at and 4.6 GeV, respectively. Except for , , and , the sizes of the generated MC samples for the other processes are less than 3 fb-1 since they can be removed completely after applying some initial event selection criteria (discussed below) due to small production cross section or low detection efficiency.
| Process | Generator | |||
|---|---|---|---|---|
| 3.0 | Babayaga | |||
| 3.0 | KKMC | |||
| 3.0 | KKMC | |||
| 2.5 | Babayaga | |||
| 2.5 | Babayaga | |||
|
|
2.5 | KKMC | ||
|
2.5 | KKMC | ||
| 2.5 | BesTwogam | |||
| 2.5 | BesTwogam |
| Process | Generator | |||
|---|---|---|---|---|
| 3.0 | Babayaga | |||
| 3.0 | KKMC | |||
| 3.0 | KKMC | |||
| 0.5 | Babayaga | |||
| 0.5 | Babayaga | |||
|
0.5 | KKMC | ||
| 0.5 | BesTwogam | |||
| 0.5 | BesTwogam |
III Event Selection and background analysis
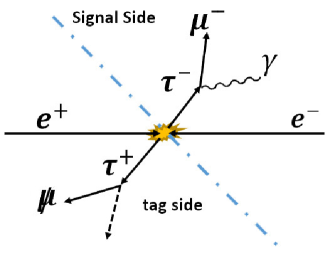
We search for events using a tagged method, as depicted in Fig. 2, to suppress backgrounds. The signal side is while the tag side should contain a charged particle that is not a (denoted as ), neutrino(s) and any number of photons.
We select events that have exactly two good oppositely charged tracks and at least one good photon.
Good charged tracks are reconstructed from MDC hits. To optimize the momentum measurement, we select tracks in the polar angle range and require that they pass within 10 cm of the interaction point in the beam direction and within 1 cm of the beam line in the transverse direction. Electromagnetic showers are reconstructed using energy deposited in clusters of EMC crystals. The efficiency and shower energy resolution are improved by including energy deposits in nearby TOF counters. Showers identified as photon candidates must satisfy fiducial and shower-quality requirements. The minimum energy is 25 MeV for barrel showers () and 50 MeV for endcap showers (). To exclude showers from charged particles, a photon must be separated by at least from any charged track. EMC cluster timing requirements suppress electronic noise and energy deposits unrelated to the event.
We do a kinematic fit imposing energy and momentum conservation on the for the signal side and the (, 1, 2) for the tag side hypotheses based on the total number of selected good photons (), i.e., for ; for ; and for other cases. Here the reconstructed momenta of two photons have been constrained to the mass. Then we require from the kinematic fit. We require the recoil mass of to lie within the nominal mass region ().
For each charged track, the muon in the signal side or the non-muon () in the tag side, the information from the MUC and MDC is used for particle identification. Tracks with positive penetration depth in MUC are identified as muons since the penetrability of muon is much larger than the other charged tracks. For the candidate, the penetration depth in MUC is required to be less or equal zero.
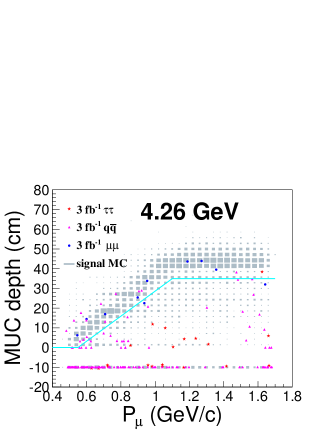
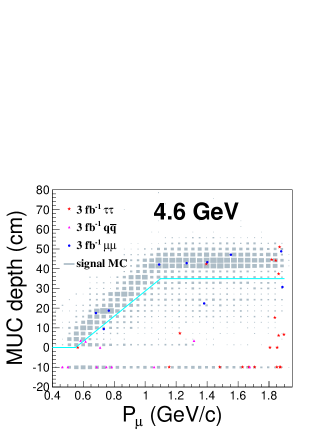
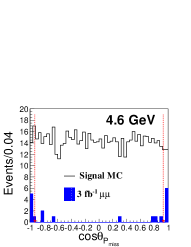
Considering the penetration depth in MUC of the muon (Depμ) varies with its momentum (), a two-dimensional (2D) requirement is added to further suppress the backgrounds due to the particle misidentification (mainly from and , ): Dep cm for and Dep cm for . Figure 3 shows the scatter plots of the Depμ versus in the signal side at 4.26 and 4.6 GeV, where the upper region of the solid line is the required signal region.
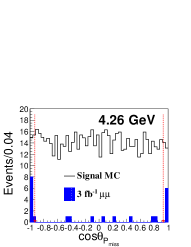
The backgrounds from -pair final states are with the ISR photon(s) misidentified as the signal photon. To suppress such background events, we require , where is calculated by subtracting the sum of momenta of all charged tracks and the signal photon from the initial momentum of the system and is the polar angle of . Figure 4 shows the distributions at 4.26 and 4.6 GeV, from which it is evident that backgrounds are very different from the signal events in polar angle distribution.
Under zero signal events assumption, we optimize the above selection criteria to obtain the most stringent upper limits. We maximize the figure of merit, , where is the efficiency for detecting decays obtained from the signal MC simulation and is the Poisson average Feldman-Cousins 90% C.L. upper limits on the number of expected signal events that is obtained with the expected background and no produced signal UL . The average limits are calculated from the number of generic MC background events surviving the selection criteria and scaled to data size.
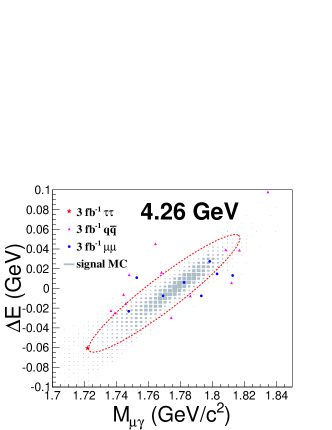
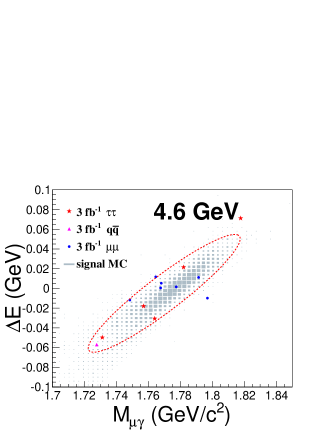
After applying all the above event selection, signal candidates are examined in the 2D space of the invariant mass () and the difference of their energy from the beam energy in the CM system (). For a signal, will center on the the -lepton mass and on zero. We define a elliptical signal region which contains 90% of signal events according to signal MC simulations. Figure 5 shows the scatter plots of versus at 4.26 and 4.6 GeV, where the shaded boxes are from the MC signal simulations and the dots are from the backgrounds shown in different colors from different sources. With the generated integrated luminosity of 3 fb-1, 5 and 11 background events survive in the signal ellipses at 4.26 and 4.6 GeV, respectively.
IV Results and Discussion
We determine upper limit on the branching fraction at 90% C.L. with the following formula:
where , , , , and are the Poisson average Feldman-Cousins 90% C.L. upper limit on the number of expected signal events mentioned above UL , the detection efficiency, the radiative correction factor obtained from the ratio of the cross sections with the ISR turned on and off in kkmc ISRF generator, the vacuum polarization factor, and the integrated luminosity, respectively.
The upper limits on the expected signal events are 7.50 and 10.6; the Born cross sections are 3.56 and 3.38 nb; the radiative correction factors are 0.96 and 0.98, the detection efficiencies are 5.92% and 5.90%, and the vacuum polarization factors are both 0.98 vp1 ; vp2 ; vp3 ; vp4 for and 4.6 GeV, respectively.
With the integrated luminosity of 3 fb-1 at 4.26 and 4.6 GeV, the upper limits on are determined to be less than , and for and 4.6 GeV, respectively.
In calculating the above upper limits, we count the number of expected background events in the 90% signal region. If we take the 68.3% signal region (1), 4 and 6 background events survive, and the detection efficiencies become 4.6% and 4.55%, respectively, at and 4.6 GeV. The upper limits on the expected signal events are 6.6 and 8.3, which correspond to and upper limits on at 4.26 GeV and 4.6 GeV, respectively. The signal region selection could be further optimized with much larger MC inclusive samples in the future.
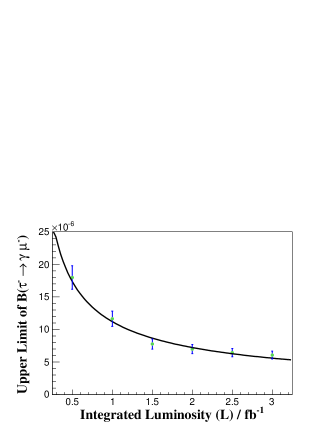
To estimate how large a data sample is needed for HIEPA to achieve the current best upper limit on , we calculate under the assumptions of the integrated luminosity of 0.5, 1, 1.5, 2 and 2.5 fb-1 using the same method. Since the sensitivity of at 4.26 GeV is better than that at 4.6 GeV with the same integrated luminosity, here we just study the sensitivity versus the integrated luminosity at 4.26 GeV. Figure 6 shows the estimated 90% C.L. upper limits versus the integrated luminosity at GeV. The solid line shows the fitted result with a function of , where and are free parameters. From the fit, we obtain . With the fitted results, HIEPA needs to take at least a 6.34 ab-1 data sample to obtain the current best upper limit of .
The Belle-II experiment is going to take data beginning in 2018 with a design luminosity of at the peak, and its integrated luminosity will reach 50 ab-1 by 2024. With this sample -pair events will be accumulated, and a sensitivity of is expected for if the Belle-II signal-to-background conditions are the same as that of Belle BELLE . To achieve a similar sensitivity, HIEPA needs to take at least ab-1 data sample. It means HIEPA can not compete with Belle-II without improving the detector performance over BESIII detector.
The remaining backgrounds are due to the and misidentification in the framework of BESIII offline software system. Fortunately, the expected separation power will increase a lot ( times) at HIEPA compared to BESIII HIEPA . Therefore, the particle misidentification backgrounds can be further suppressed at HIEPA significantly. Assuming negligible background level the 90% C.L. upper limit on is expected to be proportional to , to reach sensitivity HIEPA needs to take at least a ab-1 data sample for a design peak luminosity of at 4.26 GeV.
ACKNOWLEDGMENTS
Y. B. Li thanks Profs. Jing-Zhi Zhang, Rong-Gang Ping and Mr. Lian-Jin Wu for their helpful discussions and cross checks on MUC information and generator, also thanks Mr. Hong-Rong Qi for his help on the optimization of event selection. This work is supported in part by the National Natural Science Foundation of China Under Contract No. 11235011, National Key Basic Research Program of China under Contact No. 2015CB856701, and CAS center for Excellence in Particle Physics (CCEPP).
References
- (1) B. W. Lee and R. E. Shrock, Natural Suppression of Symmetry Violation in Gauge Theories: Muon - Lepton and Electron Lepton Number Nonconservation, Phys. Rev. D 16, 1444 (1977).
- (2) K. A. Olive, K. Agashe, C. Amsler et al. (Particle Data Group), Review of Particle Physics , Chin. Phys. C 38, 090001 (2014) and 2015 update.
- (3) A. Brignole and A. Rossi, Anatomy and phenomenology of mu-tau lepton flavor violation in the MSSM, Nucl. Phys. B 701, 3 (2004).
- (4) L. Calibbi, A. Faccia, A. Masiero and S.K. Vempati, Lepton flavour violation from SUSY-GUTs: Where do we stand for MEG, PRISM/PRIME and a super flavour factory, Phys. Rev. D 74, 116002 (2006).
- (5) J. R. Eillis, J. Hisano, M. Raidl and Y. Shimizu, A New parametrization of the seesaw mechanism and applications in supersymmetric models, Phys, Rev. D 66, 115013 (2002).
- (6) R. H. Bernstein and P. S. Cooper, Charged Lepton Flavor Violation: An Experimenter’s Guide, Phys. Rept. 532, 27 (2013).
- (7) Charge conjugate mode is included throughout this paper, the sensitivity in this paper is for combined and .
- (8) W. Bertl, R. Engfer, E. A. Hermes, et al. (SINDRUM II Collaboration), A Search for muon to electron conversion in muonic gold, Eur. Phys. J. C 47 337-346 (2006).
- (9) R. K. Kutschke, The Mu2e Experiment at Fermilab, arXiv:1112.0242.
- (10) B. Aubert, Y. Karyotakis, J.P. Lees, et al. (BaBar Collaboration), Searches for Lepton Flavor Violation in the Decays and , Phys. Rev. Lett. 104, 021802 (2010).
- (11) S. Jadach, B. F. L. Ward and Z. Was, The Precision Monte Carlo event generator K K for two fermion final states in e+ e- collisions, Comp. Phys. Commu. 130, 260 (2000)
- (12) S. Jadach, B. F. L. Ward and Z. Was, Coherent exclusive exponentiation for precision Monte Carlo calculations, Phys. Rev. D 63, 113009 (2001).
- (13) C. Li’s talk “Overview of the Detector at HIEPAF” given at “Workshop on Physics at Future High Intensity Collider at 2-7GeV in China, 13 - 16 January, 2015, Hefei, China”.
- (14) M. Ablikim, Z. H. An, J. Z. Bai, et al. (BESIII Collaboration), Design and Construction of the BESIII Detector, Nucl. Instrum. Meth. A 614, 345 (2010).
- (15) W. D. Li, H. Liu, Z. Deng, et al., The offline software for the BESIII experiment, Proc. CHEP 27 225 (2006)
- (16) Z. Y. Deng, G. F. Cao, C. D. Fu, et al., Object-Oriented BESIII Detector Simulation System, HEP NP 30(05), 371-377 (2006).
- (17) R. G. Ping, Event generators at BESIII, Chin. Phys. C 32, 599 (2008).
- (18) J. C. Chen, G. S. Huang, X. R. Qi, D. H. Zhang and Y. S. Zhu, Event generator for and decay, Phys. Rev. D 62, 034003 (2000).
- (19) G. Balossini, C. M. C. Calame and G. Montagna, Matching perturbative and parton shower corrections to Bhabha process at flavour factories, Nucl. Phys. B 758, 227 (2006).
- (20) S. Nova, A. Olchevski and T. Todorov, A Monte Carlo event generator for two photon physics, DELPHI Note 90-35 152 (1990).
- (21) G. J. Feldman and R. D. Cousin, A Unified approach to the classical statistical analysis of small signals, Phys. Rev. D 57, 3873 (1998).
- (22) E. A. Kuraev and V. S. Fadin, On Radiative Corrections to Single Photon Annihilation at High-Energy, Yad. Fiz. 41, 733 (1985).
- (23) F. Jegerlehner, Hadronic Contributions to Electroweak Parameter Shifts: A Detailed Analysis, Z. Phys. C 32, 195 (1986).
- (24) S. Eidelman and F. Jegerlehner, Hadronic contributions to g-2 of the leptons and to the effective fine structure constant alpha (M(z)2), Z. Phys. C 67, 585 (1995).
- (25) F. Jegerlehner, The Role of sigma() in precision tests of the standard model, Nucl. Phys. Proc. Suppl. 131, 213 (2004).
- (26) F. Jegerlehner, Precision measurements of sigma(hadronic) for (eff)(E) at ILC energies and (g-2)(), Nucl. Phys. Proc. Suppl. 162, 22 (2006).
- (27) T. Aushev, W. Bartel, A. Bondar, et al., Physics at Super-B Factory, arXiv:1002.5012.