Measuring the 229Th nuclear isomer transition with 233U-doped crystals
Abstract
We propose a simple approach to measure the energy of the few-eV isomeric state in 229Th. To this end, 233U nuclei are doped into VUV-transparent crystals, where they undergo alpha decay into 229Th, and, with a probability of 2 %, populate the isomeric state. These 229mTh nuclei may decay into the nuclear ground state under emission of the sought-after VUV gamma, whose wavelength can be determined with a spectrometer.
Based on measurements of the optical transmission of 238U:CaF2 crystals in the VUV range, we expect a signal at least 2 orders of magnitude larger compared to current schemes using surface-implantation of recoil nuclei. The signal background is dominated by Cherenkov radiation induced by beta decays of the thorium decay chain. We estimate that, even if the isomer undergoes radiative de-excitation with a probability of only 0.1%, the VUV gamma can be detected within a reasonable measurement time.
pacs:
06.30.Ft, 78.20.-eThe nucleus of 229Th is believed to possess an extremely low-lying excited nuclear state with an energy of only a few eV Kroger and Reich (1976); Reich and Helmer (1990); Burke et al. (1990); Helmer and Reich (1994); Beck et al. (2007). The notion of applying well-established techniques of optical laser spectroscopy to this nuclear system has encouraged a great number of proposals for possible applications Dykhne and Tkalya (1998a); Peik and Tamm (2003); Flambaum (2006); Rellergert et al. (2010); Tkalya (2011); Campbell et al. (2012); Das et al. (2013), among them the development of a nuclear optical clock Peik and Tamm (2003); Campbell et al. (2012); Kazakov et al. (2012).
Beginning in the 1970s, a series of gamma spectroscopy measurements with ever increasing performance used a differencing scheme to determine the energy of the isomeric state in an indirect way. The latest measurement places the energy at 7.8(5) eV above the ground state Beck et al. (2007); Beck et al. (2009), corresponding to a transition wavelength of 160(10) nm. Predictions of the lifetime of the unperturbed isomeric state range between a few minutes and a few hours Helmer and Reich (1994); Dykhne and Tkalya (1998b); Ruchowska et al. (2006), where a value of around 1000 s for a bare nucleus is the most commonly used estimate.
A logical next step in refining the transition wavelength, as well as demonstrating the optical addressibility of this nuclear two-level system, would be optical spectroscopy employing synchrotron radiation on 229Th nuclei doped into, or adsorbed onto Jeet et al. (2015); Yamaguchi et al. (2015), vacuum ultraviolet (VUV)-transparent crystals. Such crystals allow one to place nuclei into the excitation beam, compared to a maximum number of particles in an ion trap Campbell et al. (2011); Herrera-Sancho et al. (2013).
The approach of direct optical excitation faces a number of severe challenges: (1) The quantity of 229Th (half-life a Kikunaga et al. (2011)) available for research is very limited, and growing crystals with high Th doping concentrations is a challenge Jeet et al. (2015). (2) Both the lifetime and the energy of the isomeric state are known only with large uncertainties Beck et al. (2007); Sakharov (2010); Jeet et al. (2015), requiring an extensive two-dimensional search. (3) The choice of sufficiently tunable light sources in the VUV range is essentially limited to synchrotrons, where beam time is precious, yet the spectral power is some 11 orders of magnitude smaller compared to diode lasers in the visible range. (4) Photoluminescence in response to the excitation light can persist for long times, potentially masking the nuclear signal Stellmer et al. (2015). (5) De-excitation of the isomeric state may proceed on parasitic pathways such as internal conversion (IC) and coupling to electronic states and phonons of the crystal, potentially suppressing the optical de-excitation altogether Tkalya et al. (2000); Karpeshin and Trzhaskovskaya (2007); Jeet et al. (2015); Yamaguchi et al. (2015); Borisyuk et al. (2015).
The first four of these five challenges can be circumvented by an alternative approach to populate the isomeric state, namely through alpha decay . Following a cascade of gamma transitions, about 2% of the 229Th nuclei end up in the isomeric state Browne and Tuli (2008). In the absence of competing decay channels, these nuclei will eventually de-excite into the nuclear ground state under emission of the sought-after VUV gamma. The wavelength of this gamma can be measured with a spectrometer. Such a spectroscopy experiment could reduce the present uncertainty in the transition wavelength to a degree that would allow one to commence laser spectroscopy.
A number of experiments using 233U recoils have already been performed Richardson et al. (1998); Irwin and Kim (1997); Browne et al. (2001); Moore et al. (2004); Inamura and Haba (2009); Kikunaga et al. (2009); Burke et al. (2010), at least two are currently ongoing Zhao et al. (2012); Peik and Zimmermann (2013); Wense et al. (2013); v. d. Wense et al. (2015). These experiments are designed such that the detection is well-separated in both space and time from the population of the isomer, as the latter process is accompanied by radioactivity and the associated radioluminescence. Commonly, a thin sample of 233U is brought into the vicinity of a UV-transparent crystal (e.g. MgF2 or CaF2 ), such that 229Th recoil nuclei may leave the surface of the 233U source plate and deposit onto, or penetrate slightly into, the absorber plate.
In this Letter, we investigate an alternative approach, briefly mentioned already in Ref. Hehlen et al. (2013): 233U-doped crystals as a source of nuclear VUV gamma emission. The gamma flux of such crystals may be many hundred times larger compared to surface-implanted 229Th recoils, but the radioactive decay and the isomer gamma emission are separated in neither space nor time. This strategy seems futile at first sight, as an enormous radioluminescence background is introduced into the detection volume. We will show, however, that radioluminescence caused by 233U alpha decay does not overlap with the anticipated wavelength range around 160 nm. Working towards the interpretation of optical spectra, we find that contaminations of the crystal can generate spectrally narrow features in the UV range, easily misinterpreted as the nuclear isomer signal.
A bright source of 229mTh — A number of current experiments use thin foils of 233U, often in the form of UO2, as a source of 229Th nuclei. An energy of MeV is released upon the -decay of 233U nud , where the 229Th nucleus obtains a recoil energy of up to 84 keV. A Th ion of this kinetic energy has a penetration depth of about 15 nm in UO2, so if the event occurs close to the surface, and the direction of propagation leads towards the surface, then the Th ion might leave the substrate. The Th ion is caught on a large-bandgap absorber plate. After a certain time of accumulation, the absorber crystal is moved into a detector. This approach thus allows to separate the 233U alpha decay and the detection of the VUV gamma in both space and time.
This method, however, has two severe limitations: At first, the flux of 229Th nuclei that can be implanted into the absorber plate is intrinsically limited by the small range of 229Th recoils in the UO2 material, and the comparatively long half-life of the 233U isotope. The maximum flux of isomeric 229mTh recoil nuclei per unit surface is
| (1) |
where is the density of the UO2 and M its molar mass, a the half-life of 233U, nm the range of 84-keV recoil ions, and is Avogardro’s constant. The geometrical factor acounts for the fraction of nuclei up to a depth of that reach the absorber plate, and is the probability of radiative de-excitation. For and a branching ratio of , the maximum gamma emission rate is .
The second experimental limitation stems from the fact that the penetration of the 229Th ions into the absorber plate is also only a few 10 nm. Depending on the surface roughness and cleanliness, the recoil ions might be stopped before reaching the true crystal bulk structure. The band gap of the surface region of the crystal might be smaller than the energy of the isomeric state, allowing it to de-excite via electronic states Tkalya et al. (2000); Karpeshin and Trzhaskovskaya (2007).
To overcome these two limitations, we here follow a different approach: Doping the 233U directly into a suitable crystal will allow to increase the production rate of Th recoil ions, and the Th ions will be born directly into the bulk of the lattice. The flux of isomer gammas that can be extracted from the crystal is intrinsically limited by the optical absorption of uranium defect centers in the crystal. As we will show later, the optical absorption length is equal to , where is the uranium doping concentration (in terms of uranium nuclei per crystal unit cell) and is a wavelength-dependent material constant. The isomer gamma flux reads
| (2) |
where denotes the molar mass of a crystal unit cell. Assuming and the crystal thickness to exceed the absorption length, , we obtain for 233U:CaF2 SM . Note that this approach allows for continuous signal integration and does not require knowledge of the isomer lifetime.
To validate our approach, we will now quantify the optical transmission and measure the radioluminecence spectrum of our crystal of choice, which is U:CaF2.
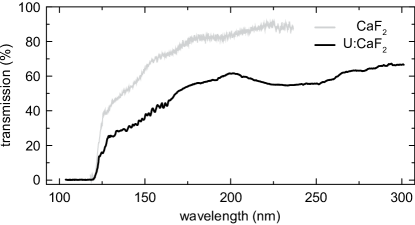
Transparency of U:CaF2 in the UV — Although U:CaF2 is widely used as a laser material, transmission curves in the UV spectral range have not been available so far Hargreaves (1991); Su et al. (2004). We use an in-house furnace to produce a set of U:CaF2 crystals with doping concentrations between and , corresponding to uranium densities of to , where we assume a crystal unit cell to be formed by one Ca and two F ions. Due to the radioactivity of 233U and its limited availability, we use depleted 238U as a chemically identical proxy of 233U for the studies presented here. The crystals have a ruby red color, indicating that the uranium atoms are in the trivalent state Su et al. (2004). The crystals are cut and polished into discs of a few mm thickness and 17 mm diameter.
Transmission measurements are performed with a VUV spectrometer held at a pressure of mbar, where a deuterium lamp is used for calibration and to generate the probe light. Figure 1 shows the transmission curve of a crystal with thickness and doping concentration .
We model the transmission as
| (3) |
where describes losses at the crystal surfaces, accounts for the absorption of an undoped crystal, and describes the additional absorption due to the uranium doping. We find that the wavelength-dependent absorption coefficient is independent of the doping concentration for values of : the absorption length scales inversely proportional with . For a wavelength of 160 nm, we measure . It is encouraging to find that this value is 40 times larger than its equivalent quantity in the approach of recoil implantation.
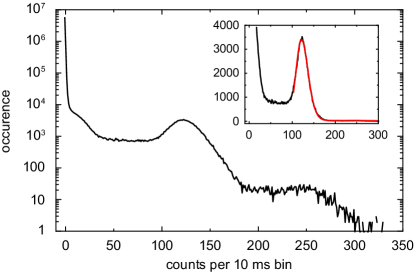
Radioluminescence of U:CaF2 — A 238U:CaF2 crystal with an alpha activity of 1.9 Bq is placed in front of a Cs-Te PMT (sensitivity range 115 to 320 nm). We record the emission of characteristic bursts of photons, where the rate of the bursts corresponds to the alpha activity of the 238U. Each burst lasts for a few µs and contains some photons Stellmer et al. (2015). We use a bin width of 10 ms and plot the number of counts per bin in a histogram, shown in Fig. 2. A prominent feature around 120 counts is observed; this feature is associated with the alpha decay of 238U into 234Th. This isotope quickly decays into 234U (half-life 245 000 a) via two beta decays; these beta decays are reflected in the hump at about 10 counts.
The radioluminescence emission rate is temperature-dependent Rodnyi (1997). We measure a near-linear dependence between 10 and C, and obtain a slope of for C. Mild heating from room temperature to C thus reduces the radioluminescence already by a factor of almost four. From this characteristic temperature-dependence Rodnyi (1997), as well as the signature histograms discussed above, we conclude that the radioluminescence properties of U:CaF2 are governed entirely by the general properties of CaF2 and are not determined by the uranium doping.
The half-life of 238U is too long, and the light throughput of optical spectrometers too small, to obtain a radioluminescence spectrum from 238U:CaF2 crystals. As 233U:CaF2 crystals are not yet available, we simulate such a crystal by bringing a thin layer of 233U (age 45(5) years, 232U contamination 12(1) ppm) in physical contact with a commercial CaF2 sample (diameter 25 mm, thickness 5 mm). The 233U had been deposited onto a steel backing using electro-deposition Kazakov et al. (2014), the layer has a diameter of 22 mm, a thickness of about 15 µm, and an activity of 7.5 MBq (1500-times larger compared to the 229Th:CaF2 crystals used in a related study Stellmer et al. (2015)). Note that only the top 15 nm of the uranium layer give a flux of Th recoil ions into the CaF2 sample, but the entire thickness contributes - and -particles.
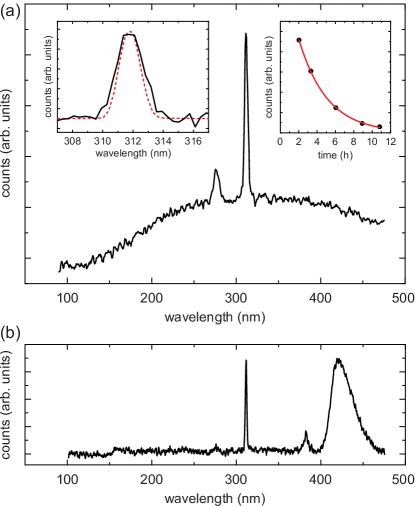
This stack is placed into the spectrometer. The luminescence spectrum, obtained after an integration time of 50 hours is shown in Fig. 3. The spectrum can be decomposed into two parts: the scintillation of CaF2 around 280 nm Stellmer et al. (2015), and Cherenkov radiation below 200 nm. The spectral shape and amplitude of the scintillation feature depend on the specific type of crystal SM . In CaF2, it extends down to 220 nm. This finding is very promising, as the scintillation is spectrally far away from the expected isomer wavelength at 160 nm. The scintillation is caused primarily by alpha particles penetrating the crystal up to a depth of about 15 µm.SM .

The broad spectral component between 120 and 200 nm is attributed to Cherenkov light, caused by beta decay of 228Th and 229Th daughters. The cut-off at low wavelengths coincides the lower transmission edge of the CaF2 crystal. The Cherenkov light is intrinsically broad and will constitute a locally flat background in the search for the spectrally very narrow isomer signal. Chemical purification of the 233U material prior to crystal fabrication can reduce the Cherenkov light substantially SM . Note that the amplitude of Cherenkov radiation is proportional to the ingrowth of 228Th and 229Th; this dependence is exactly the same for doped and surface-implanted ions. The signal-to-background ratio of these two approaches is thus identical and depends only on the degree of 232U contamination and on the time elapsed since the last chemical removal of thorium ingrowth from the 233U source material.
For a time of 100 days since chemical purification, and a 232U contamination of 10 ppm, we calculate an emission of Cherenkov photons within a 1.0-nm wavelength window around 160 nm for every 233U decay SM . This number needs to be compared to the probability of VUV gamma emission. Assuming , , and parameters of a standard VUV spectrometer, 1.5 days of measurement time are required for the isomer signal to exceed the noise of the background SM .
Spectrally narrow features — While Cherenkov radiation is intrinsically free of narrow features, crystal contaminations could potentially cause spectrally narrow luminescence. To probe for such disturbing signals, we subject various CaF2 samples to intense gamma radiation inside a shut-down nuclear reactor for 16 hours, and measure their luminescence spectra afterwards.
The emission of one specific commercial CaF2 specimen is shown in Fig. 4 (a). On top of a spectrally broad background, we observe two narrow features, the dominant one being located at 312 nm. We monitor the amplitude of this narrow feature over time, and find an exponential decay with a time constant of hours (right inset of Fig. 4 (a)). The decay of the broad background proceeds on a very similar timescale. The spectral width of this feature is measured to be 2.05 nm (left inset), largely limited by the instrumental resolution (red dashed line). Subtracting the signal width and the experimental resolution in quadratures, we obtain a natural linewidth of below 1.2 nm.
The appearence of narrow and long-lived features in the luminescence spectrum of crystals is striking, as typical crystal defects show broad features of typically 10 nm width, and a much faster, non-exponential decay. We attribute the observed feature to crystal contamination with Gd3+ ions, which show narrow emission at a wavelength of 312 nm Pei . We speculate that crystal defects induced by the gamma radiation slowly transfer their energy onto Gd3+ ions, which radiate on a narrow transition. The same narrow feature can be provoked by illumination with a deuterium lamp Stellmer et al. (2015); see Fig. 4 (b).
Many current experiments search for a spectrally narrow feature with a lifetime on the order of an hour, and use both the linewidth and lifetime to discriminate the isomer signal from the crystal luminescence background. As shown above, contaminations of the crystal can easily be mistaken for the sought-after signal. This pitfall can be circumvented by performing the experiment with different types of crystals. Experiments building on the approach could perform reference measurements with 234U, which is very similar to 233U in terms of half-life (245 000 a vs 160 000 a), (4.86 MeV vs 4.91 MeV), and half-life of the first daughter nuclei (75 000 a vs 7932 a).
To conclude, we proposed a new method to detect and measure the VUV isomer gamma of 229Th in consequence of 233U alpha decay in VUV-transparent crystals. We found that radioluminescence induced by the alpha decay is spectrally separated from the expected isomer wavelength region. This region, however, is covered by Cherenkov radiation, induced predominantly by the beta decay of 228Th and 229Th daughters. The flux of isomer gammas extracted from the crystal is so large that, even if the probability of radiative de-excitation of the isomer is only 1%, the signal can be discriminated from the broad Cherenkov radiation after a spectroscopy measurement time of only a few days.
We thank J. Schwestka, V. Schauer, and V. Rosecker for preparation of uranium samples. We greatly appreciate fruitful discussions with E. Peik, L. von der Wense, and P. G. Thirolf. This work has received funding from the ERC project 258604-NAC and from the European Union’s Horizon 2020 research and innovation programme under grant agreement No 664732 “nuClock”.
References
- Kroger and Reich (1976) L. A. Kroger and C. W. Reich, Nuclear Physics A 259, 29 (1976).
- Reich and Helmer (1990) C. W. Reich and R. G. Helmer, Phys. Rev. Lett. 64, 271 (1990).
- Burke et al. (1990) D. G. Burke, P. E. Garrett, T. Qu, and R. A. Naumann, Phys. Rev. C 42, R499 (1990).
- Helmer and Reich (1994) R. G. Helmer and C. W. Reich, Phys. Rev. C 49, 1845 (1994).
- Beck et al. (2007) B. R. Beck, J. A. Becker, P. Beiersdorfer, G. V. Brown, K. J. Moody, J. B. Wilhelmy, F. S. Porter, C. A. Kilbourne, and R. L. Kelley, Phys. Rev. Lett. 98, 142501 (2007).
- Dykhne and Tkalya (1998a) A. M. Dykhne and E. V. Tkalya, JETP 67, 549 (1998a).
- Peik and Tamm (2003) E. Peik and C. Tamm, Europhys. Lett. 61, 181 (2003).
- Flambaum (2006) V. V. Flambaum, Phys. Rev. Lett. 97, 092502 (2006).
- Rellergert et al. (2010) W. G. Rellergert, D. DeMille, R. R. Greco, M. P. Hehlen, J. R. Torgerson, and E. R. Hudson, Phys. Rev. Lett. 104, 200802 (2010).
- Tkalya (2011) E. V. Tkalya, Phys. Rev. Lett. 106, 162501 (2011).
- Campbell et al. (2012) C. J. Campbell, A. G. Radnaev, A. Kuzmich, V. A. Dzuba, V. V. Flambaum, and A. Derevianko, Phys. Rev. Lett. 108, 120802 (2012).
- Das et al. (2013) S. Das, A. Pálffy, and C. H. Keitel, Phys. Rev. C 88, 024601 (2013).
- Kazakov et al. (2012) G. A. Kazakov, A. N. Litvinov, V. I. Romanenko, L. P. Yatsenko, A. V. Romanenko, M. Schreitl, G. Winkler, and T. Schumm, New J. Phys. 14, 083019 (2012).
- Beck et al. (2009) B. R. Beck et al., LLNL-PROC-415170 (2009).
- Dykhne and Tkalya (1998b) A. M. Dykhne and E. V. Tkalya, JETP 67, 251 (1998b).
- Ruchowska et al. (2006) E. Ruchowska et al., Phys. Rev. C 73, 044326 (2006).
- Jeet et al. (2015) J. Jeet, C. Schneider, S. T. Sullivan, W. G. Rellergert, S. Mirzadeh, A. Cassanho, H. P. Jenssen, E. V. Tkalya, and E. R. Hudson, Phys. Rev. Lett. 114, 253001 (2015).
- Yamaguchi et al. (2015) A. Yamaguchi, M. Kolbe, H. Kaser, T. Reichel, A. Gottwald, and E. Peik, New J. Phys. 14, 053053 (2015).
- Campbell et al. (2011) C. J. Campbell, A. G. Radnaev, and A. Kuzmich, Phys. Rev. Lett. 106, 223001 (2011).
- Herrera-Sancho et al. (2013) O. A. Herrera-Sancho, N. Nemitz, M. V. Okhapkin, and E. Peik, Phys. Rev. A 88, 012512 (2013).
- Kikunaga et al. (2011) H. Kikunaga, T. Suzuki, M. Nomura, T. Mitsugashira, and A. Shinohara, Phys. Rev. C 84, 014316 (2011).
- Sakharov (2010) S. L. Sakharov, Physics of Atomic Nuclei 73, 1 (2010).
- Stellmer et al. (2015) S. Stellmer, M. Schreitl, and T. Schumm, Sci. Rep. 5, 15580 (2015).
- Tkalya et al. (2000) E. V. Tkalya, A. N. Zherikhin, and V. I. Zhudov, Phys. Rev. C 61, 064308 (2000).
- Karpeshin and Trzhaskovskaya (2007) F. F. Karpeshin and M. B. Trzhaskovskaya, Phys. Rev. C 76, 054313 (2007).
- Borisyuk et al. (2015) P. V. Borisyuk, O. S. Vasilyev, A. V. Krasavin, Y. Y. Lebedinskii, V. I. Troyan, and E. V. Tkalya, arXiv:1506.06236 (2015).
- Browne and Tuli (2008) E. Browne and J. K. Tuli, Nuclear Data Sheets 109, 2657 (2008).
- Richardson et al. (1998) D. S. Richardson, D. M. Benton, D. E. Evans, J. A. R. Griffith, and G. Tungate, Phys. Rev. Lett. 80, 3206 (1998).
- Irwin and Kim (1997) G. M. Irwin and K. H. Kim, Phys. Rev. Lett. 79, 990 (1997).
- Browne et al. (2001) E. Browne, E. B. Norman, R. D. Canaan, D. C. Glasgow, J. M. Keller, and J. P. Young, Phys. Rev. C 64, 014311 (2001).
- Moore et al. (2004) I. Moore, I. Ahmad, K. Bailey, D. L. Bowers, Z.-T. Lu, T. P. O’Connor, and Z. Yin, Argonne Physics Division Report PHY-10990-ME-2004 (2004).
- Inamura and Haba (2009) T. T. Inamura and H. Haba, Phys. Rev. C 79, 034313 (2009).
- Kikunaga et al. (2009) H. Kikunaga, Y. Kasamatsu, H. Haba, T. Mitsugashira, M. Hara, K. Takamiya, T. Ohtsuki, A. Yokoyama, T. Nakanishi, and A. Shinohara, Phys. Rev. C 80, 034315 (2009).
- Burke et al. (2010) J. T. Burke, E. L. Swanberg, R. J. Casperson, and D. Thomas, Report. No. LLNL-TR-463538 (2010).
- Zhao et al. (2012) X. Zhao, Y. N. Martinez de Escobar, R. Rundberg, E. M. Bond, A. Moody, and D. J. Vieira, Phys. Rev. Lett. 109, 160801 (2012).
- Peik and Zimmermann (2013) E. Peik and K. Zimmermann, Phys. Rev. Lett. 111, 018901 (2013).
- Wense et al. (2013) L. v. d. Wense, P. G. Thirolf, D. Kalb, and M. Laatiaoui, JINST 8, P03005 (2013).
- v. d. Wense et al. (2015) L. v. d. Wense, B. Seiferle, M. Laatiaoui, and P. G. Thirolf, EPJ A 51 (2015).
- Hehlen et al. (2013) M. P. Hehlen, R. R. Greco, W. G. Rellergert, S. T. Sullivan, D. DeMille, R. A. Jackson, E. R. Hudson, and J. R. Torgerson, Journal of Luminescence 133, 91 (2013).
- (40) NuDat 2.6 database, http://www.nndc.bnl.gov/nudat2/.
- (41) See the Supplemental Material.
- Hargreaves (1991) W. A. Hargreaves, Phys. Rev. B 44, 5293 (1991).
- Su et al. (2004) L. Su, W. Yanga, J. Xua, Y. Donga, and G. Zhou, Journal of Crystal Growth 273, 234 (2004).
- Rodnyi (1997) P. Rodnyi, Physical Processes in Inorganic Scintillators (CRC Press, 1997).
- Kazakov et al. (2014) G. Kazakov, V. Schauer, J. Schwestka, S. Stellmer, J. Sterba, A. Fleischmann, L. Gastaldo, A. Pabinger, C. Enss, and T. Schumm, Nucl. Instr. Meth. Phys. Res. A 735, 229 (2014).
- (46) E. Peik, private communication.
- Jelley (1953) J. V. Jelley, Progress in nuclear physics 3, 84 (1953).
- (48) ESTAR program provided by NIST, http:// physics.nist.gov/PhysRefData/Star/Text/ESTAR.html.
- Venkataramaiah et al. (1985) P. Venkataramaiah, K. Gopala, A. Basavaraju, S. S. Suryanarayana, and H. Sanjeeviah, J. Phys. G: Nuclear Phys. 11, 359 (1985).
- (50) NIST database, http://www.nist.gov/pml/data/ xraycoef/index.cfm.
- (51) Evaluated Nuclear Structure Data File (ENSDF), provided by the National Nuclear Data Center at Brookhaven National Laboratory. Retrieved from the Laboratoire National Henri Bequerel at http://www.nucleide.org.
- Srinivasan et al. (1985) B. Srinivasan, Z. Hasan, N. B. Manson, and W. A. Runciman, J. Phys. C: Solid State Phys. 18, 2381 (1985).
SUPPLEMENTAL MATERIAL
I Cherenkov radiation
I.1 Overview
The isomer transition is expected at a wavelength of 160(10) nm, where our approach of 233U-doped crystals is sensitive to the wavelength region between the UV transparency cutoff (125 nm for CaF2) and the onset of the dominant scintillation features (220 nm in CaF2, 380 nm in MgF2). This spectral region is covered by Cherenkov radiation; see Fig. 3. The spectral shape of Cherenkov emission is essentially a convolution of the crystal’s transmission, given by , and its refractive index , both of which change very smoothly with wavelength. Its amplitude is independent of the specific details of the crystal structure. Cherenkov radiation thus poses a locally homogeneous background rather than a sharp peak that could interfere with the sought-after isomeric signal.
Cherenkov radiation is caused by charged particles (in our case, electrons) travelling through the crystal at velocities larger than the speed of light in the medium, , where is the wavelength-dependent index of refraction. In CaF2, we find . The minimum threshold energy required for electrons to emit Cherenkov radiation is
| (S1) |
with the electron rest mass and the relativistic parameter . Here, , and we obtain a minimum energy of 158 keV. Very similar values are obtained for other types of crystals.
The spectrum of the Cherenkov radiation is well described by the Frank-Tamm formula Jelley (1953),
| (S2) |
where is the number of Cherenkov photons emitted in the wavelength range while the electron travels the elementary path in the medium. is the speed of the electron, and . To obtain the total number of photons emitted, it is necessary to integrate over the path of the electron. Expressing the path in terms of the instant kinetic energy , the integration reads
| (S3) |
where is the initial energy of an electron. This calculation is straigforward using tabulated values of electron ranges in CaF2 EST and the correspondence .
I.2 Origin of Cherenkov radiation and yield of various processes
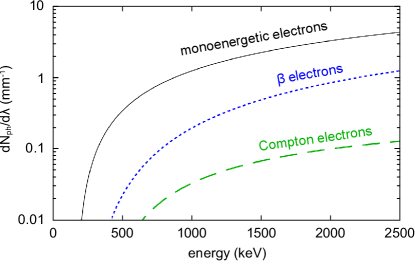
Electrons of large enough energy may originate from the following processes: (i) decay with sufficiently large energy released, (ii) highly energetic conversion electrons (CE) accompanying radioactive transformation of nuclei, and (iii) highly energetic gammas, which interact with the crystal via the photoelectric effect (predominantly below 100 keV), Compton scattering (100 keV to 10 MeV) and pair production (above 10 MeV). We will now look at these processes more closely and estimate the yield of Cherenkov radiation.
(i) -electrons are characterized by a continuous energy spectrum, which may be described by the Fermi law Venkataramaiah et al. (1985)
| (S4) |
where is a normalization constant and is the atomic number of the daughter nucleus. The Fermi function describes the Coulomb interaction between the emitted electron and the nucleus; see Ref. Venkataramaiah et al. (1985) for an explicit expression. The average Cherenkov yield of -electrons obtained in a decay with end-point energy is given by
| (S5) |
where is given by Eq. S3.
(ii) Conversion electrons are characterized by their discrete energy spectrum. Therefore, their yield may be calculated directly by formula S3.
(iii) High-energy gammas accompanying radioactive decay of nuclei may produce secondary high energetic electrons via Compton scattering, photoabsorbtion, and pair production. In the experiment considered here, the most energetic gammas are below 3 MeV in energy. On the other hand, gammas with energy below keV cannot produce electrons of sufficiently high energy to contribute to the Cherenkov radiation. The most efficient scattering process between a few 100 keV and a few MeV, and the only one considered here, is Compton scattering.
The energy of a scattered electron is connected with the energy of the incident gamma and the scattering angle as
| (S6) |
To find the minimum gamma energy required to generate an electron with energy keV (at the threshold to emit Cherenkov radiation), we set and obtain keV.
The differential cross section of Compton scattering into the elementary energy of the scattered electron may be given with help of the Klein-Nishina differential cross-section into the elementary solid angle and relation S6 between the scattering angle and the energy of the scattered electron. The cross section reads
| (S7) |
where is the classical electron radius, and is the energy of the scattered gamma.
The range of high-energy gammas in the crystal medium is much larger than the actual size of our crystals. For example, the probability of a keV gamma to interact with the CaF2 crystal over a path of 5 mm length is only about 15 %; this value is even smaller for gammas of higher energy NIS . This fact allows us to neglect the attenuation of gammas, as well as the interaction of scattered gammas with the medium. Assuming a path length of mm in the crystal, we estimate the average yield of a single gamma with energy born in the crystal as
| (S8) |
where is given by Eq. S6 at .
The Cherenkov yields of the three different processes discussed above are compared in Fig. S1.
I.3 Ingrowth of daughters and contamination with 232U
The Cherenkov radiation shown in Fig. 3 cannot be caused directly by the alpha decay of pure 233U, as this decay is not accompanied by a significant number of conversion electrons or gammas of sufficiently high energy. Instead, the Cherenkov radiation originates from activity in the sequence of short-lived 229Th daughters, namely (i) the beta decay of 225Ra, 213Bi, and 209Pb, (ii) conversion electrons, and (iii) the high-energy gammas of various daughters, e.g. 213Bi.
The 233U source used for the measurements was not purified, and daughters have been building up for the past 45 years (measured by inductively coupled plasma mass spectrometry, ICP-MS). Chemical purification of the 233U is expected to be capable of removing 99.5% of the thorium. Such a preparation would reduce the Cherenkov radiation initially by a factor of 200, with a very slow build-up over the 229Th lifetime.
The 233U material was obtained by neutron irradiation of 232Th through the steps . Depending on the details of the breeding process, the 233U contains non-negligible amounts of 232U as a by-product of the neutron irradiation. The short half-life of 232U (70.6 a) and its first daughter 228Th (1.9 a) lead to a high activity of the entire chain, which includes strong gamma emission. Unlike the 233U chain, which “pauses” at 229Th for nearly 8000 years, the 232U chain proceeds down to the stable 208Pb on timescales comparable to the duration of the experiment.
Using gamma spectroscopy, the content of 232U in the 233U plate source used here has been determined to 11.6(1.0) ppm. At this level, the gamma radiation of the 232U chain clearly dominates over the 233U chain, the same is true for beta decays. It is thus important that the spectroscopy experiment proposed in the main text be carried out with 233U material almost free of 232U.
II Realistic parameters for a spectroscopy experiment
We will now attempt to model a future spectroscopy experiment. We assume a 233U:CaF2 crystal of density g/cm3, thickness mm and 233U doping concentration ; such concentrations can easily be achieved. Note that here and in the main text, denotes the amount of uranium ions per crystal unit cell, where, for simplicity, we assume a unit cell to contain one Ca ion and two F ions, g/mol. The crystallographic unit cell would contain four Ca ions and eight F ions. Further, we assume the contamination of 232U to be ppm, and we assume that days have elapsed since the last removal of thorium (both 228Th and 229Th) from the source. The 228Th and 229Th chains are in secular equilibrium. Such a crystal of mm3 would have a 233U activity of 170 kBq (identical to the source used in Ref. Zhao et al. (2012)) plus 4 kBq from the 232U chain. The crystal absorption parameter is taken as cm.
Concerning the experimental set-up, we consider a standard VUV spectrometer, where the crystal is imaged onto the entrance slit of the spectrometer using 1:1 imaging optics with a solid angle coverage of 0.14% (e.g. mm, mirror diameter mm) and a mirror reflectivity in the UV of 80%. The entrance slit has a height of 8 mm and a width of 330 µm, and is imaged onto the detector with a concave grating. The grating is assumed to have a diffraction efficiency of 20%, and the quantum efficiency of the detector is 30%. The total detection efficiency as the product of solid angle, mirror reflectivity, and grating and detector efficiency, is . A CCD camera allows to continuously measure the entire spectral region of interest. A grating with 1200 grooves/mm translates the 330 µm slit width to 1.0 nm spectral width. The spectrum, captured by a standard CCD detector (8 mm height, 30 mm width), would cover 90 nm, conveniently matching the window between the CaF2 transparency cut-off at 130 nm and the onset of alpha-radiation induced radioluminescence at 220 nm.
II.1 Signal amplitude
The expression for the flux given in the main text (Eq. 2) relies on a number of simplifications. We will show now that these simplifications are justified for reasonable parameters. At first, the factor stems from an integration over all sources of isomer gammas,
| (S9) |
where we assume to be constant across the sample. For , the integration yields exactly . For the parameters chosen above, the integral is , and more generally, the approximation is justified for .
Secondly, the integral is only one-dimensional, assuming all VUV gammas to propagate perpendicular to the crystal surface. In correct terms, the expression of Eq. 2 in the main text would read
| (S10) |
which would give a maximum flux of . This geometric simplification is certainly justified, as we consider light collection optics placed far away from the crystal, capturing only photons within a small solid angle. For the parameters given above, the largest deviation from normal incidence is .
As a third simplification, we assume that light absorption is dominated by the uranium content and not by the absorption of the CaF2 crystal itself. In this way, the expression in Eq. 2 becomes independent of the doping concentration and crystal thickness .
By far the largest uncertainty in stems from the uncertainty in the probability to populate the isomer and the unknown magnitude of competing non-radiative decay channels. The possibility of non-radiative decay is captured in the quantity , which denotes the probability of radiative decay. Using a values of and , we obtain . The rate of isomer gammas at the detector is
| (S11) |
and we obtain for the experimetal specifications stated above.
In the following, we will compare this signal amplitude to various sources of background noise.
II.2 Cherenkov radiation from 233U gammas
| occurence | at 160 nm | ||
|---|---|---|---|
| [keV] | [keV] | per | per |
| disintegrations | disintegrations | ||
| 158-200 | 178 | 39.78 | 0.081 |
| 200-300 | 235 | 68.25 | 1.8 |
| 300-400 | 314 | 6.79 | 0.63 |
| 400 | 469 | 0.0194 | 0.006 |
The alpha decay of 233U is accompanied by only very few conversion electrons and gammas of sufficiently high energy to generate Cherenkov light; see Tabs. SI and SII. Using the models derived in Sec. I, we calculate that in total, there are on average only Cherenkov photons emitted into a 1-nm interval at nm per disintegration of 233U. Comparing the emission of Cherenkov photons and isomer gammas,
| (S12) |
we find that for values , the number of emitted isomer gammas exceeds the number of Cherenkov photons.
| occurence | at 160 nm | ||
|---|---|---|---|
| [keV] | [keV] | per | per |
| disintegrations | disintegrations | ||
| 295-350 | 319 | 118.6 | 0.0019 |
| 350-500 | 373 | 10.4 | 0.0037 |
| 500-750 | 560 | 0.6 | 0.033 |
II.3 Cherenkov radiation from beta decay in the 229Th chain
| at 160 nm | |||
| decay | [keV] | occurence [%] | per 100 decays |
| of 229Th | |||
| 1827 | 2.04 | 1.4 | |
| 1423 | 64.8 | 27.5 | |
| 983 | 30.2 | 5.5 | |
| 644 | 100 | 5.4 | |
| 356 | 31.2 | 0.13 | |
| 316 | 68.8 | 0.14 |
There are four beta decays in the decay chain of 233U, one of which constitutes only a weak decay channel. From the ENSDF database ENS , we extract the probability and released energy ; see Tab. SIII. All of the values of are above keV.
Next, we use the ESTAR values provided by NIST EST to calculate the path lengths of the electrons in CaF2. Employing the continuous slowing-down approximation (CSDA), we obtain exemplary path lengths of , , and . As a conservative simplification, we will assume that all electron paths are contained within the crystal.
We then employ Eq. S5 to calculate the average number of Cherenkov photons within a 1-nm spectral window around 160 nm, created along the entire chain of 229Th daughters. We find that 100 decays of 229Th are accompanied by the creation of 40 Cherenkov photons in the wavelength region of interest.
II.4 Cherenkov radiation from gammas and conversion electrons in the 229Th chain
As a next step, we go through the entire decay chain of 229Th down to 205Tl and, for each of the 10 decay steps, extract the gamma emission lines with energies above keV. Table SIV lists all such gamma lines that have a probability of more than 0.1% to appear in succession to a disintegration of 229Th. Only one gamma transition, located at 440.4 keV, has a probability of more than a few percent. While we listed only transitions with probabilities above 0.1% here, we checked that a summation over all the weaker transitions, as they appear e.g. in the decay of 225Ac, can safely be neglected.
An equivalent search is performed for conversion electrons (not listed here). We estimate the total contribution of conversion and Compton electrons to the Cherenkov radiation background to be at the level of 0.74 and 0.15 photons per nm per 100 229Th decays.
The Cherenkov photons are identical to the isomer gammas in wavelength, location of origin, and propagation to the detector. The ratio between the emission rates of Cherenkov photons vs isomer gammas for a decay of 233U reads
| (S13) |
Here, is the decay constant. For , , Cherenkov photons in the wavelength region of interest, and a time of days allowed for the ingrowth of 229Th, we obtain a value of .
| decay | [keV] | occurence [%] |
|---|---|---|
| 1566.9 | 2.08 | |
| 1100.2 | 0.27 | |
| 807.4 | 0.29 | |
| 465.1 | 2.02 | |
| 452.2 | 0.11 | |
| 440.4 | 25.5 | |
| 410.6 | 0.12 | |
| 323.7 | 0.16 |
II.5 Cherenkov radiation from 232U contamination
The production of 233U is plagued by the parasitic appearance of 232U. Even for contaminations at the ppm level, the activity of the material can be dominated by the 232U chain. The parent 232U undergoes alpha decay into 228Th (half-life 1.9 a) without significant emission of high-energy gammas.
| at 160 nm | |||
| decay | [keV] | occurence [%] | per 100 decays |
| of 229Th | |||
| 2252.1 | 55.3 | 57 | |
| 1801.3 | 17.7 | 12 | |
| 1524.8 | 4.50 | 2.19 | |
| 1523.9 | 7.96 | 3.92 | |
| 1290.5 | 8.71 | 3 | |
| 1038.0 | 1.14 | 0.23 | |
| 739.4 | 1.44 | 0.12 | |
| 631.4 | 1.90 | 0.09 | |
| 569.9 | 13.3 | 0.42 | |
| 331.3 | 81.7 | 0.22 |
A list of beta decays in the 228Th chain is given in Tab. SV. We find that the decay of 100 229Th nuclei is accompanied by 79 Cherenkov photons emitted by -electrons in a 1 nm interval near 160 nm.
| decay | [keV] | occurence [%] |
|---|---|---|
| 1620.7 | 1.51 | |
| 860.5 | 4.46 | |
| 785.4 | 1.11 | |
| 727.3 | 6.65 | |
| 583.2 | 30.6 | |
| 510.7 | 8.10 | |
| 300.1 | 3.18 |
We then take a look at the gammas emitted along the 228Th chain; see Tab. SVI. In analogy to the 229Th decay chain, we estimate the total contribution of conversion and Compton electrons to the Cherenkov background to be at the level of 0.75 and 5.4 photons per nm per 100 228Th decays. In total, we have Cherenkov photons emitted in a 1-nm interval near 160 nm for every decay of 228Th, produced by all its daughters.
Assuming to be much shorter then the half-life of 228Th, the ratio of Cherenkov photons emitted per isomer gamma reads
| (S14) |
and takes a value of 0.096 for , , an ingrowth time of days, and a contamination of ppm.
| origin | decay | CE | Compton | |
|---|---|---|---|---|
| decay | ||||
| chain | 0.40 | 0.41 | ||
| chain | 0.79 | 0.054 | 0.85 |
II.6 Detector noise
State-of-the-art CCD detectors can be cooled to C, which reduces the dark noise to a level that is entirely negligible in comparison to the read-out noise of typically less than one electron. Events related to the impact of highly energetic particles (e.g. of cosmic origin or from environmental radioactivity) are the dominant disturbance. A routine to remove such events from the data set is required.
We define a parameter , where is the exposure time of a single image and is the binning area of the CCD chip. The binning area can be matched to the average area of “cosmic” events. We find that for , about 5% of all data points are contaminated by “cosmic” events; this value has proven to be a good choice for the detection of small signals. Using this value of , a sub-area of the CCD chip corresponding to a spectral width of 1.0 nm could thus be integrated over 125 seconds. The isomer gamma signal integrated during this time (assuming and ) is comparable to the read-out noise.
II.7 Measurement time and non-radiative decay probability
Summing over all contributions, the ratio between Cherenkov photons emitted in the 1-nm window at 160 nm and the isomer gammas reads
| (S15) |
Only for entirely unrealistic times smaller than a few minutes does the decay of 233U dominate over the two thorium chains, and only for unrealistically low concentrations ppm does the 229Th chain dominate over the 228Th chain. We have thus identified the beta decays in the 232U contamination as the main source of Cherenkov radiation; refer to Tab. SVII for a summary.
We will now calculate the integration time it takes for the integrated isomer signal to become comparable to the noise of the Cherenkov background,
| (S16) |
or
| (S17) |
Taking the detected signal amplitude of from Eq. 2 and Eq. S11, from Eq. S15, and assuming days, ppm, , and a radiative decay probability of only , we obtain a characteristic integration timescale of days.
The comparatively short measurement time is very promising: the isomer emission can be detected within a few days of measurement time even if only 1% of the isomers undergo radiative de-excitation, or, equivalently, if was one order of magnitude smaller than expected.
To give a second example, even for , a reduced contamination of ppm, and a shorter ingrowth time of days, the isomer emission could be measured within a few weeks.
Note that, apart from the light throughput of the spectrometer, and are the only tunable parameters that have an effect on . Note also that is independent of the spectrometer slit width, as the values of scale approximately linear with the spectral window defined by the slit width. Importantly, scales as .
III Origin of the radioluminescence feature around 280 nm
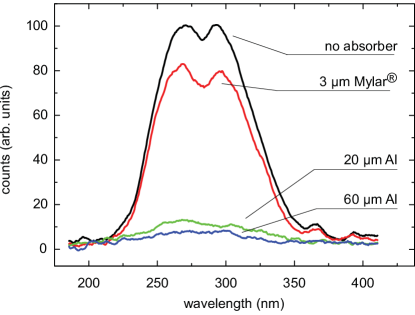
The major fraction of 233U-induced radioluminescence in CaF2 is radiated between 220 and 360 nm, as shown in Fig. 3. We will now attempt to identify the kind of radiation that causes this scintillation. There are a number of candidates: Th recoil ions implanted into the crystal, alpha and beta particles, gamma rays, as well as electrons and X-rays from secondary processes. To quantify the individual contributions, we place a commercial CaF2 crystal (5 mm thickness, 25 mm diameter) in close proximity to a 233U sample. We insert three different absorbers in between the radiation source and the crystal and record the emission spectrum.
A 3-µm Mylar® foil securely absorbs the Th recoil ions, but transmits nearly all of the 4.8-MeV alpha particles (27 µm range) and all of the beta electrons, gamma rays, and X-rays. With this foil in place, we observe a 20% drop in signal amplitude; see Fig. S2.
We then substitute the Mylar® foil by 20 µm of aluminum, which corresponds to the range of alpha particles. The foil transmits 99.4% of all gamma rays at an energy of 30 keV NIS and all of the beta particles in question. The signal drops to 10%, and it drops further to 5.5% as the Al layer thickness is increased to 60 µm.
The measurement suggests that the signal is caused predominantly by alpha particles, with much smaller contributions from recoil nuclei and gammas. This finding is consistent with the fact that more than 99% of the energy deposited into the crystal from radioactive decay of our 233U source is via alpha particles. Note that the presence of the 232U chain increases the overall activity, but the partition of the energy released into alpha, beta, and gamma particles is roughly equal to the 233U chain.
To further study the effect of high-energy gamma radiation, we employ a more powerful source: A commercial CaF2 sample is placed directly into the core of a shut-down TRIGA Mark II reactor, where it is subjected to a massive flux of gamma rays. Alpha and beta particles are shielded by the water surrounding the fuel rods. After 15 hours of exposure, the crystal is quickly transferred into the spectrometer, but no signal resembling the spectrum of Fig. S2 is observed. We conclude that, in absence of crystal contaminations, gamma radiation does not induce noticable long-lived defects.
To complete our studies, we subject the CaF2 sample to the radiation of a pure alpha emitter. We use a 241Am source with an activity of 5.5 MBq (kindly provided by M. Fugger, Atominstitut, Vienna), the sample is exposed to this radiation for 45 hours. The penetration depth of the 5.5-MeV alpha particles is estimated to be 15 µm. After an integrated bombardement of alpha particles per cm2, no damage or coloring of the crystal is observed, nor is the optical transmission reduced. A measurement of the luminescence spectrum begins 10 minutes after the end of exposure, but no signal of long-lived defects is observed between 120 and 500 nm. A similar experiment with MgF2 returns the same null result.
IV Evaluating MgF2 as a host crystal candidate

The radioluminescence of the 233U-doped crystal poses a considerable background for the detection of the isomer photon. The amplitude and spectrum of the radioluminescence emission depend on the specific crystal, and it might be worthwhile to consider several candidates.
The Cherenkov spectrum is expected to be very similar for different types of crystal, as it depends only on the index of refraction (at 160 nm, 1.55 for CaF2, 1.47 for MgF2). Only the scintillation induced by massive particles (alpha particles and recoiling ions) is expected to depend heavily on the specific crystal structure.
To assess the response of MgF2 to the alpha decay, we attach the 233U layer to a MgF2 specimen, just as we had done before with a CaF2 crystal. The radioluminescence spectrum is shown in Fig. S3, where the amplitude can be compared directly to the CaF2 spectrum of Fig. S2. The pronounced feature around 300 nm is missing, but instead, we observe a peak around 410 nm. The amplitude of this peak is only about 3% of the dominant peak in CaF2. This drastic reduction in luminescence, appearing only at higher wavelengths, might be tempting for experiments with insufficient spectral resolution, e.g. using photomultiplier tubes (PMTs).
Crystals made up of light atoms (e.g. LiF, MgF2) are the preferred choice when X-rays are involved, as the X-ray absorption increases drastically with mass number. As an example, the mass attenuation coefficient of MgF2 is 3.6-times smaller compared to CaF2 for X-rays of 29 keV energy NIS .
While uranium-doping of LiF has been reported Srinivasan et al. (1985), we are not aware of any attempts to grow U:MgF2 crystals. Measuring the doping efficiency of uranium into MgF2 is the next step in the assessment of such crystals.