1 \sameaddress1 \secondaddressEast Asian Observatory, 660 N. Aohoku Place, University Park, Hilo, Hawaii 96720, USA \sameaddress1 \sameaddress5,1 \sameaddress1 \secondaddressINAF-Osservatorio Astrofisico di Arcetri, Firenze, Italy \sameaddress1 \sameaddress3 \sameaddress3,5
Local Magnetic Field Role in Star Formation
Abstract
We highlight distinct and systematic observational features of magnetic field morphologies in polarized submm dust continuum. We illustrate this with specific examples and show statistical trends from a sample of 50 star-forming regions.
1 Introduction: Angle
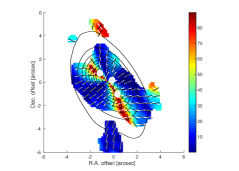
Dust polarization observations in the mm/submm continuum reveal plane-of-sky projected magnetic field morphologies. Here, dust grains are expected to be aligned with their shorter axes parallel to the magnetic field, thus the detected polarized emission is perpendicular to the B field. Despite the recent growing observations, e.g., CARMA (Hull et al. [2014]), SMA (Zhang et al. [2014]), magnetic field strengths can unfortunately not be directly inferred from these observed magnetic field morphologies. Through a series of publications (Koch et al. [2012a], [2012b], [2013], [2014]) we introduced – the local angle between an observed magnetic field orientation and the gradient of the underlying dust continuum Stokes emission (Figure 1). With the help of a magnetohydrodynamics (MHD) force equation, can be interpreted as a magnetic field alignment factor, where measures the fraction of the magnetic field tension force that is directed along an emission (density) gradient.
2 Results
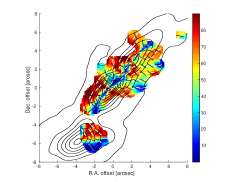
We demonstrate clear systematic features found in across two regions observed with the SMA at 345 GHz (Qiu et al. [2013], [2014]) in Figure 1. Strikingly, higher-resolution observations with the SMA at 1.3 mm (Qiu et al. [2009]) show condensations along a mid-plane in G240.31+0.07 where is maximised, with regions above and below this mid-plane showing small -values that allow the material to be channelled to the mid-plane. Opposite trends in structures are seen in G35.2-0.74N. Visually, these sources can clearly be categorised as type IIA (G240) and IIB (G35.2N) as described below.
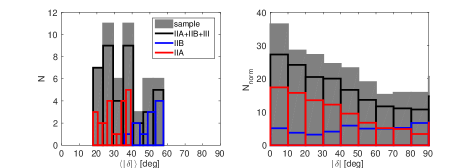
The examples depicted above are not unique. From our sample of 50 targets (SMA, Zhang et al. [2014]; CSO, Dotson et al. [2010]) most of the sources show systematic features in as soon as polarization is detected over a large enough area. Our sample covers both low- and high-mass star-formation sites over scales of 0.1 to 0.01 pc (, m; SMA) and larger scales around 1pc (, m; CSO). Figure 2 shows histograms for the source-averaged (50 data points) and for (based on 4000 independent beams across all 50 sources). The -histogram of each source is normalized first before co-adding, in order to avoid the statistics being dominated by sources with the largest numbers of independent beams. Both histograms show a broad shoulder peaking around small and , falling off with a tail towards larger values. This indicates that the prevailing source-magnetic field orientation statistically prefers small misalignments with the emission gradient. Thus, magnetic fields are found to be more often within small deviations of a source minor axis.
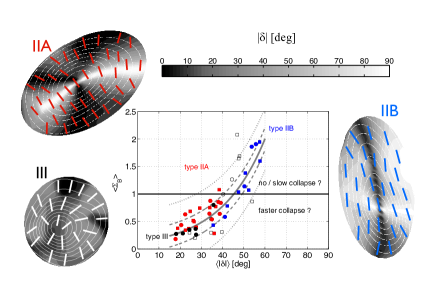
If is further interpreted with an MHD force equation, the ratio between the magnetic field tension force and gravity, , can be calculated from and as , where is the local angle between the gradient of the dust continuum and the direction of local gravity (Koch et al. [2012a]). This finding reflects the idea that an observed molecular cloud morphology – with its characteristic angles and – is a measure of the imprint of all the relevant forces in a system. Figure 3 displays source-averaged force ratios versus source-averaged . The force ratio increases with growing .
3 Conclusion
The local angle is found to be a prime observable across a sample of 50 star-forming regions. It can further be linked to a magnetic field-to-gravity force ratio, . Maps of are closely correlated to features in -maps, making a tracer for the local role of the magnetic field. While Figure 3 shows a source-averaged correlation, it is important to note that our approach also provides a local assessment of the magnetic field. Thus, can explain where condensations, and potentially star formation, occur (Figure 1). Our finding of magnetic fields being more aligned parallel to emission gradients in clouds and cores (Figure 2) connects to Planck results that observe a transition from fields being parallel to ridges in the diffuse interstellar medium to more orthogonal as densities towards molecular clouds increase (Planck Collaboration XXXII [2014]).
References
- [2010] Dotson, J. L., Vaillancourt, J. E., & Kirby, L. et al. 2010, ApJS, 186, 406
- [2014] Hull, C.L.H., Plambeck, R.L., Kwon, W. et al. 2014, ApJS, 213, 13
- [2012a] Koch, P.M., Tang, Y.-W., & Ho, P.T.P. 2012a, ApJ, 747, 79
- [2012b] Koch, P.M., Tang, Y.-W., & Ho, P.T.P. 2012b, ApJ, 747, 80
- [2013] Koch, P.M., Tang, Y.-W., & Ho, P.T.P. 2013, ApJ, 775, 77
- [2014] Koch, P.M., Tang, Y.-W., Ho, P.T.P. et al. 2014, ApJ, 797, 99
- [2014] Planck Collaboration XXXII. 2014, arXiv:1409.6728
- [2009] Qiu, K., Zhang, Q., Wu, J. et al. 2009, ApJ, 696, 66
- [2013] Qiu, K., Zhang, Q., Menten, K.M. et al. 2013, ApJ, 779, 182
- [2014] Qiu, K., Zhang, Q., Menten, K. M. et al. 2014, ApJ, 794, L18
- [2014] Zhang, Q., Qiu, K., Girart, J. M. et al. 2014, ApJ, 792, 116Z