11email: r.j.jackson@keele.ac.uk 22institutetext: INAF - Osservatorio Astrofisico di Arcetri, Largo E. Fermi 5, 50125, Florence, Italy 33institutetext: INAF - Osservatorio Astronomico di Bologna, via Ranzani 1, 40127, Bologna, Italy 44institutetext: European Southern Observatory, Alonso de Cordova 3107 Vitacura, Santiago de Chile, Chile 55institutetext: Instituto de Astrofísica de Andalucía-CSIC, Apdo. 3004, 18080, Granada, Spain 66institutetext: INAF - Osservatorio Astronomico di Palermo, Piazza del Parlamento 1, 90134, Palermo, Italy 77institutetext: Dipartimento di Fisica e Astronomia, Sezione AstrofiFsica, Università di Catania, via S. Sofia 78, 95123, Catania, Italy 88institutetext: Astrophysics Research Institute, Liverpool John Moores University, 146 Brownlow Hill, Liverpool L3 5RF, United Kingdom 99institutetext: Departamento de Ciencias Físicas, Universidad Andrés Bello, República 220, 837-0134 Santiago, Chile 1010institutetext: Department for Astrophysics, Nicolaus Copernicus Astronomical Center, ul. Rabiańska 8, 87-100 Toruń, Poland 1111institutetext: INAF - Padova Observatory, Vicolo dell’Osservatorio 5, 35122 Padova, Italy
The Gaia-ESO Survey: Stellar radii in the young open clusters NGC 2264, NGC 2547 and NGC 2516 ††thanks: Based on observations collected with the FLAMES spectrograph at VLT/UT2 telescope (Paranal Observatory, ESO, Chile), for the Gaia- ESO Large Public Survey (188.B-3002).
Abstract
Context. Rapidly rotating, low-mass members of eclipsing binary systems have measured radii that are significantly larger than predicted by standard evolutionary models. It has been proposed that magnetic activity is responsible for this radius inflation.
Aims. By estimating the radii of low-mass stars in three young clusters (NGC 2264, NGC 2547, NGC 2516, with ages of 5, 35 and 140 Myr respectively), we aim to establish whether similar radius inflation is seen in single, magnetically active stars.
Methods. We use radial velocities from the Gaia-ESO Survey (GES) and published photometry to establish cluster membership and then combine GES measurements of projected equatorial velocities with published rotation periods to estimate the average radii for groups of fast-rotating cluster members as a function of their luminosity and age. The average radii are compared with the predictions of both standard evolutionary models and variants that include magnetic inhibition of convection and starspots.
Results. At a given luminosity, the stellar radii in NGC 2516 and NGC 2547 are larger than predicted by standard evolutionary models at the ages of these clusters. The discrepancy is least pronounced and not significant ( per cent) in ZAMS stars with radiative cores, but more significant in lower-mass, fully convective pre main-sequence cluster members, reaching per cent. The uncertain age and distance of NGC 2264 preclude a reliable determination of any discrepancy for its members.
Conclusions. The median radii we have estimated for low-mass fully convective stars in the older clusters are inconsistent (at the level) with non-magnetic evolutionary models and more consistent with models that incorporate the effects of magnetic fields or dark starspots. The available models suggest this requires either surface magnetic fields exceeding 2.5 kG, spots that block about 30 per cent of the photospheric flux, or a more moderate combination of both.
Key Words.:
Stars:radii – Stars:rotation – Stars:activity – open clusters and associations: NGC 2516, NGC 2547, NGC 22641 Introduction
1.1 The radii of low-mass stars
The radius of a star is one of its most fundamental properties, that ought to be correctly predicted by stellar models. Yet precise measurements of K- and M-dwarfs in eclipsing binary systems have shown that, for a given mass, the radii of stars with are 10–15 per cent larger than predicted by current evolutionary models. Hence, for a given luminosity, the effective temperature can be underestimated by up to 7.5 per cent (e.g. Lopez-Morales 2007, Morales et al. 2009, Torres et al. 2010).
Stars in these short-period, tidally locked binaries are fast-rotating and highly magnetically active; a working hypothesis is that the larger radii are caused either by the suppression of convection by interior, dynamo-generated magnetic fields (e.g. Mullan & MacDonald 2001; Chabrier, Gallardo & Baraffe 2007; Feiden & Chaboyer 2012, 2013), or by the blocking of flux at the surface by cool, magnetic starspots (Chabrier et al. 2007, Macdonald & Mullan 2012, Jackson & Jeffries 2014b). Similarly high levels of rotation and magnetic activity are also a characteristic of young, low-mass stars. If rotationally induced magnetic fields or starspots do affect the radii of fast rotating stars, then this could significantly alter the masses and ages inferred for such objects from their locations in the Hertzprung-Russell diagram, change estimates of the radii and hence densities of any transiting exoplanets that are discovered around them and alter the age-dependence of lithium depletion in their photospheres (Jackson & Jeffries 2014a; Somers & Pinsonneault 2014, 2015).
A suspicion remains however, that the oversized radii could be directly connected with the close binary nature of the eclipsing stars for which precise radii and masses are available. Tidal synchronisation could modify internal rotation profiles, convection patterns and magnetic activity. If an inflated radius really is a consequence of rotation/magnetic activity and not just binarity, then a simple test is that rapidly rotating, single K- and M-dwarfs should also be bigger than both inactive stars and the model predictions. Although the masses of single stars are inaccessible, it is possible to measure their radii as a function luminosity. Interferometric techniques have been used to determine radii for nearby K- and M-dwarfs with an estimated mass range of (Boyajian et al. 2012). Unfortunately, almost all these nearby stars are magnetically inactive, so the radius-luminosity relation that can be derived is applicable to relatively old, slow-rotating, main sequence (MS) stars. This relationship shows satisfactory agreement with the predicted radii of evolutionary models (e.g. Baraffe et al. 1998; Dotter et al. 2008) for K- and early M-dwarfs, but later M-dwarfs (spectral types beyond M2) show lower effective temperatures than predicted by evolutionary models (Veeder 1974), with current models underestimating radii by per cent (Boyajian et al. 2012).
Extending this comparison to magnetically active, single, low-mass stars is difficult since there are none close enough to allow precise interferometric radius measurements. Instead Jackson, Jeffries & Maxted (2009) and Jackson & Jeffries (2014b) have used the product of individual rotation periods () and projected equatorial velocities () to estimate projected stellar radii (). Assuming random axial orientations, such measurements can provide average radii for groups of stars. The technique has been applied as a function of luminosity in two young open clusters (NGC 2516 and the Pleiades). Jackson & Jeffries (2014b) found that the highly magnetically active K- and M-dwarfs in these clusters (aged 130 Myr - Meynet, Mermilliod and Maeder 1993) showed significant radius inflation relative to the empirical locus defined by inactive MS field stars; the mean increase in radius, at a given luminosity, ranges from per cent for MS K-dwarfs to per cent for the lower luminosity pre main-sequence (PMS) M-dwarfs that are still descending their fully convective Hayashi tracks.
1.2 The Gaia-ESO Survey
The Gaia-ESO survey (GES) is employing the FLAMES multi-object spectrograph (Pasquini et al. 2002) on the VLT UT-2 (Kueyen) telescope to obtain high quality, uniformly calibrated spectroscopy of stars in the Milky Way over a 5 year period (Gilmore et al. 2012; Randich & Gilmore 2013). The survey, which began at the end of 2011, includes stars from the halo, bulge, thick and thin discs, as well as in star forming regions and clusters of all ages. Samples are chosen from photometric surveys with the aim of characterizing the chemical and kinematic evolution of these populations. Analysis of these spectra will provide a rich dataset of chemical and dynamical parameters which, when combined with proper motions and parallaxes from the Gaia satellite, will provide full three-dimensional velocities and chemistry for a large and representative sample of stars.
In addition to radial velocity () data, the GES measures the of target stars (Koposov et al. in preparation). In the case of young clusters, can be used to confirm cluster membership and data can be combined with published measurements of rotation periods to estimate the values for members of the cluster (e.g. Baxter et al. 2009, Jackson et al. 2009). As the GES progresses the opportunity arises to estimate the radii of both MS and PMS stars for a number of clusters, where rotation period data are available, using uniformly derived and calibrated values of . By determining the radii of low-mass stars as a function of their luminosity in clusters of different ages, we can test evolutionary models, search for the signatures of radius inflation by magnetic activity and investigate if there is any dependence on whether stars have reached the zero age main sequence (ZAMS) (e.g. see Jackson & Jeffries 2014b).
In this paper we use GES data to estimate the average radii for stars in three young clusters – NGC 2516, NGC 2547 and NGC 2264. In section 2 we describe the clusters and our database and use the of spectroscopic targets to assign cluster membership. In Sect. 3 we use the values of confirmed cluster members with known periods to determine average radii as a function of luminosity. Finally, in Sect. 4 we compare the radius data for each of the three clusters with the radii as a function of luminosity and age predicted by different evolutionary models, some of which include the effects of magnetic fields and starspots.
2 Cluster members and their projected rotation velocities
2.1 Cluster properties
NGC 2516 is the oldest of the three clusters considered in this paper. Meynet, Mermilliod & Maeder (1993) give an age of 141 Myr. This is consistent with more recent estimates of age of Myr from lithium depletion in low mass stars (Jeffries, James & Thurston 1998) and Myr from the nuclear turn off for high mass stars (Lyra et al. 2006). We adopt the intrinsic distance modulus of mag and cluster reddening of mag given by Terndrup et al. (2002) based on main sequence fitting.
NGC 2547 is a younger cluster and our dataset may be expected to contain both PMS and ZAMS stars . We adopt an age of Myr based on lithium depletion (Jeffries & Oliveira 2005). This is consistent with the age of 38.5 Myr found from main sequence fitting by Naylor & Jeffries (2006), who also give an intrinsic distance modulus of mag and reddening of mag.
NGC 2264 is the youngest cluster considered here with an estimated age of 2–7 Myr depending, amongst other things, on the adopted distance to the cluster, which varies between 400 pc (Dzib et al. 2014) and 913 pc (Baxter et al. 2009). In this paper we adopt the distance pc given by Turner (2012) based on model isochrone fitting. This is consistent with a distance of pc from fitting the ZAMS (Sung et al. 1997) and the parallax-based distance of pc obtained from two maser sources thought to be located in NGC 2264 (Kamezaki et al. 2013). Having adopted the distance given by Turner (2012) we also adopt their average reddening of mag and age of Myr. We note that at best this age represents a median value; Sung and Bessell (2010) estimate an age spread of 2–3 Myr about the median age.
All three clusters show near solar-metallicity, with [Fe/H] values, consistently determined from GES spectroscopy, that are within dex of solar (Magrini & Randich 2015).
| Cluster | Object | IC | No. | |||||||||
| mag. | mag. | mag. | mag. | km s-1 | km s-1 | Spec | km s-1 | |||||
| NGC2264 | 06392497+0933151 | 15.26 | 13.84 | 13.28 | 13.06 | 8.72 | 31.10 | 4.3 | 3.552 | 2 | 0.54 | 0.66 |
| NGC2264 | 06392506+0942515 | 14.26 | 13.21 | 12.48 | 12.36 | 15.02 | 20.08 | 1.1 | 3.560 | 2 | 0.36 | 1.43 |
| NGC2264 | 06392535+0943147 | 13.74 | 12.05 | 11.19 | 10.90 | 19.39 | -7.64 | 1.6 | 3.712 | 2 | 0.36 | 4.31 |
| NGC2264 | 06392550+0931394 | 15.32 | 13.77 | 12.86 | 12.38 | 27.40 | 17.98 | 4.7 | 3.544 | 2 | 0.29 | 0.23 |
| NGC2264 | 06392649+0943298 | 15.56 | 13.94 | 13.26 | 12.98 | 23.86 | 15.30 | 19.8 | 3.770 | 2 | 0.63 | 0.09 |
| NGC2264 | 06393939+0945215 | 13.97 | 12.90 | 12.04 | 11.54 | 55.61 | 20.18 | 11.8 | 3.621 | 4 | 0.21 | 0.05 |
| NGC2264 | 06393961+0945442 | 13.03 | 11.98 | 11.37 | 11.18 | 52.77 | 43.60 | 1.6 | 3.610 | 4 | 0.22 | 1.22 |
| No. Spec indicates the number of separate observations co-added to produce the target spectrum | ||||||||||||
| and are calculated values of the absolute precision in and fractional precision in , as described in Sect. 2.2 | ||||||||||||
| NGC 2516 | NGC 2547 | NGC 2264 | |
| Age (Myr) | 141 | 35 | 5.5 |
| 7.93 | 7.79 | 9.45 | |
| E(B-V) (mag) | 0.12 | 0.12 | 0.075 |
| (mag) | 0.04 | 0.04 | 0.02 |
| No. of targets observed | 743 | 450 | 1707 |
| No. potential members (a) | 618 | 376 | 1525 |
| No. members (b) | 459 | 156 | 350 (604) |
| Targets with Known period | 77 | 84 | 226 |
| Members with (c) | 32 | 45 | 90 (157) |
| (a) With , valid I-mag, K-mag and (if known) | |||
| (b) Based on the probability of membership from the being | |||
| (c) Member with known period, km s-1 and | |||
| Nos. in brackets are for relaxed membership criteria, see Sect. 2.4 | |||
2.2 Cluster targets with resolved projected equatorial velocities
Targets in these clusters were observed at the VLT on a number of dates between April 2012 and December 2013. The targets were selected using a combination of optical and infrared photometry and chosen using very broad regions of colour-magnitude space, so as to target all possible cluster members (or at least make them available for fibre placement – see Bragaglia et al. in preparation). The raw spectroscopic data were processed with pipelines developed at the Cambridge Astronomical Survey Unit, to produce wavelength-calibrated, sky-subtracted spectra and estimates of and (Lewis et al; Koposov et al. in preparation). These were passed to spectroscopic analysis working groups (e.g. Lanzafame et al. 2015), which estimated astrophysical parameters (, ) and chemical abundances for a subset of the targets with high quality spectra. The resulting data and parameters were placed in the GES archive (and made available to the GES consortium) at the Wide Field Astronomy Unit at Edinburgh University111http://ges/roe.ac.uk/. Data used in this paper is taken from tables Target, Spectrum, RecommendedAstroAnalysis and SpectrumNightly of the iDR2/iDR3 release of GES data.
All the relevant photometry and spectroscopic data for GES survey targets in NGC 2516, NGC 2547 and NGC 2264, were taken from the Edinburgh GES archive. The database contains and values derived from the analysis of both individual spectra (termed nightly spectra) and combined spectra – where all available nightly spectra are co-added to produce a single target spectrum. All the results reported here are given for combined spectra observed with the intermediate resolution GIRAFFE spectrograph, using order sorting filter HR15N which gives a spectral wavelength range of 6445–6815 at a resolution of 17000. The targets lie in the brightness range of approximately for all three clusters. The optical photometry originates from Jeffries, Thurston & Hambly (2001) and Irwin et al. (2007) for NGC 2516; from Naylor et al. (2002), Jeffries et al. (2004) and Irwin et al. (2008) for NGC 2547; and from Sung et al. (2008) for NGC 2264. 2MASS near infrared photometry is available for all targets (Skrutskie et al. 2006).
The uncertainties in and were estimated, as a function of temperature, and , using the scaling parameters and , the prescription defined by Jackson et al. (2015)222Note that is expressed as an absolute uncertainty in km s-1, whereas is a dimensionless fractional precision – see Jackson et al. (2015) for details., and with the constants shown in table 3 of their paper that are appropriate for order sorting filter HR15N. These scaling parameters approximate to the standard deviations for a normal distribution, but Jackson et al. showed that the underlying uncertainty distributions have extended tails and are better represented by Student’s t-distributions with degrees of freedom, where for and for . The intrinsic spectral resolution of the data means that there is an effective resolution limit to , such that only objects with km s-1 have reliably detected rotation. Data downloaded from the Edinburgh GES archive including calculated values of the and precision for each target are listed in Table 1, the full version of which is available at CDS.
Targets for each cluster were selected initially from the database as having both valid and -magnitudes and a signal to noise ratio of the combined spectra . Where possible, a further selection was made on the basis of surface gravity to remove field red giants (with ) from the sample. Estimates of were available from the Working Group (WG) analyses for 99 per cent of targets in NGC 2516 but only per cent of targets in the other two clusters. The numbers of potential targets are shown in Table 2.
2.3 Target mass and luminosity
2MASS magnitudes of the targets in Table 1 were transformed to the CIT system using relations given by Carpenter (2001) then scaled to absolute magnitudes using the distance moduli and extinctions shown in Table 2 (assuming that the targets are members of the cluster). Luminosities of targets in NGC 2547 and NGC 2516 were estimated from target values using the bolometic correction as a function of colour given by BHAC15 model isochrones (Baraffe et al. 2015) interpolated to the cluster age. Masses were estimated from luminosities using the same models. Luminosities in NGC 2264 were estimated from values using the bolometic correction as a function of colour in order to minimise possible effects of any infra-red excess due to circumstellar discs which may still be present in this relatively young cluster.
2.4 Probability of membership
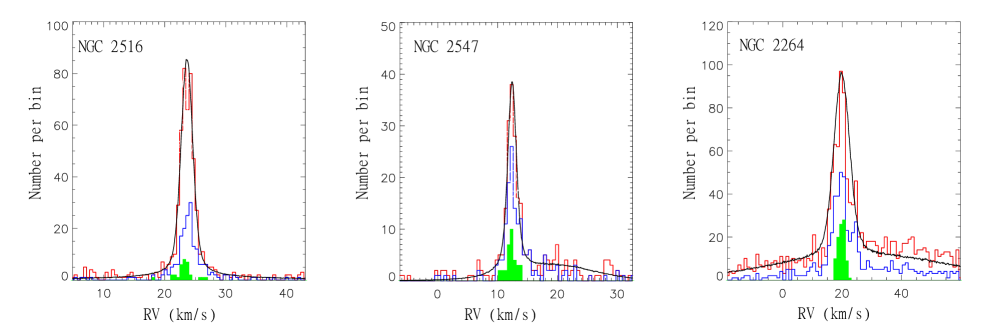
Figure 1 shows histograms of the of potential members for each clusters. Results are shown separately for (a) all potential members and (b) those with a km s-1. The latter group of relatively rapidly rotating stars have a higher probability of cluster membership, since older field stars are more likely to be slower rotators.
A maximum likelihood method was used to determine the probability of cluster membership as a function of by fitting a pair of quasi-Gaussian distributions to the data for each star. The first distribution defines cluster members, the second much broader distribution represents the background population. Each probability density function is the convolution of a Gaussian profile with the distribution of measurement uncertainty incorporating the combined effects of measurement precision and the projected orbital velocities of an estimated fraction of binary stars (see Cottaar, Meyer & Parker 2012; Jeffries et al. 2014).
For the present calculation.
-
•
the measurement uncertainty in of individual targets is defined as a Student-t distribution with =6 scaled according to the scaling constant for measurement precision (see Jackson et al. 2015).
-
•
Binary periods are assumed to follow the log normal distribution described by Raghavan et al. (2010) with and , where is the period in days.
-
•
The binary fraction varies with mass as over the range . This relationship, estimated from the binary fraction as a function of mass given by Jeffries et al. (2001) for NGC 2516, is assumed to apply to all three clusters here.
-
•
The binary mass ratio is represented by a flat distribution between 0.1 and 1 and the eccentricity by a uniform probability density between 0 and 0.8 (Raghavan et al. 2010).
-
•
Targets outside the range 20 km s-1 of the cluster central velocity are assumed to be non-members and are excluded from the calculation. A range of 40 km s-1 is adopted for NGC 2264, which appears to have a much broader intrinsic distribution.
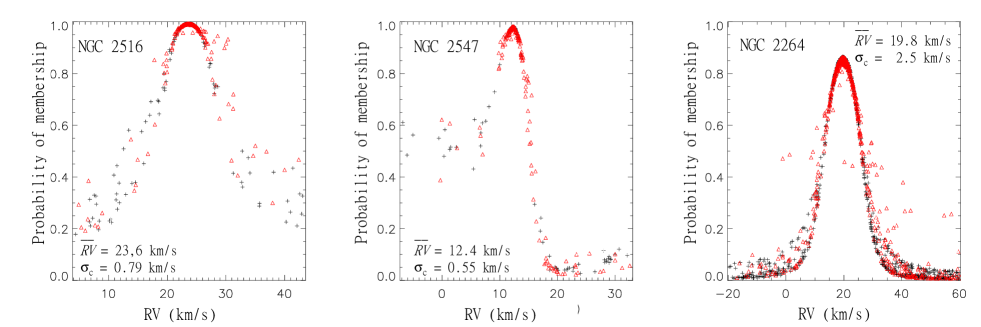
Figure 1 shows the maximum likelihood fit of the number density of targets as a function of for each cluster. Figure 2 shows the probability of membership as a function of for each star, which is calculated from the ratio of likelihoods that a target belongs to the cluster or field populations. This depends strongly on and more weakly on the measurement uncertainty. Note that the intrinsic dispersions of the clusters quoted in Fig. 1 are upper limits to the true dispersion. There is some evidence for mass-dependence in the dispersion and for a small (probably unphysical) mass-dependent systematic drift in which inflates the dispersion seen in a group covering a wide mass range. This is more carefully analysed in Jeffries et al. (in preparation), however the accuracy obtained using a single mass bin is easily sufficient for the current purpose of estimating the probability of cluster membership.
NGC 2516 shows an distribution characteristic of a relaxed cluster, centred at km s-1, with an intrinsic dispersion km s-1. There are 459 targets with a membership probability , about half of which have km s-1. In the rest of the paper we conservatively consider this subset of stars where determining values. This sample should suffer a low level of contamination by field stars, especially when we combine the membership probabilities with the likelihood of having km s-1 and the likelihood of having a measurement of their rotation periods from rotational modulation (see Sect. 3.1).
NGC 2547 shows an distribution consistent with the presence of a dominant cluster centered at km s-1 with a dispersion of km s-1, together with a lesser, more dispersed population with central of km s-1. This is consistent with the results of Sacco et al. (2015) who used a sub-sample of GES targets in NGC 2547 selected using the equivalent width of the Li i 6708Å line to identify the presence of a kinematically distinct, younger population in the line of sight towards NGC 2547, centred at km s-1. For our analysis we select only members of the main cluster and find 156 targets with membership probability , 75 per cent of which have km s-1.
NGC 2264 shows a broader peak in its distribution, with extended tails containing a large fraction of fast rotating stars. This is consistent with NGC 2264 being understood as a loose collection of star-forming clumps rather than as a single, distinct, strongly bound cluster (Tobin et al. 2015). This leads us to consider two membership samples, the first where cluster members are those associated with the peak in the distribution at km s-1, giving 339 members with membership probability , and a second where all 604 fast rotating stars with km s-1 and km s-1 are considered to be potential cluster members.
2.5 Comparison of with other work
Both the precision and accuracy of the measurements are important in estimating the distributions for stars in these clusters. The precision of the measurements is estimated from an empirical analysis of repeat measurements of recorded as part of the GES project (Jackson et al. 2015). However, such measurements give no indication of the absolute accuracy of the measurements, which is a combination of the uncertainty in measurement and the uncertainty in absolute calibration.
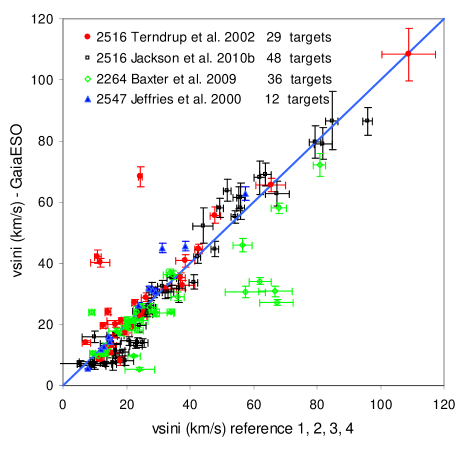
To assess the calibration uncertainty, GES measurements were compared with previously reported measurements for the same targets in NGC 2516 (Terndrup et al. 1998; Jackson & Jeffries 2010b), NGC 2547 (Jeffries, Totten & James 2000) and NGC 2264 (Baxter et al. 2009). Figure 3 compares measured and reported values of for 125 targets where both sources showed km s-1. The uncertainties shown for the GES data are (see Sect. 2.2). The uncertainties in the reported values, are taken from the source papers.
There is a good correlation between the two data sets after accounting for the measurement precisions. However, there are a number of outliers where the difference between the two estimates of is much greater than the expected uncertainty in the difference of the two values. To some extent this is expected since, at least for the GES data the measurement uncertainty is described by a Student-t distribution (with =2) rather than a Gaussian distribution. To eliminate these outliers the comparative data is clipped such that the discrepancy between the two measurements must be less than 5 times its uncertainty, which is equivalent to selecting data between the 8th and 92nd percentiles of a Student’s t-distribution with . Linear regression of the clipped data then yields the following relation between the reported in the GES database and previously the reported values ():
| (1) |
Thus there is no significant systematic difference between GES values of and those previously reported for the same targets. This calibration uncertainty is small compared to the expected random uncertainty for individual targets – usually per cent unless a target is observed on multiple occasions.
3 Mean radii of cluster members
3.1 Targets with measured rotation period
Projected radii, , are calculated for the samples of probable members defined in Sect. 2.4 that also have km s-1 and a reported rotation period in the literature. We also demand a high quality measurement, with .
All three clusters have been the subject of photometric surveys that attempted to measure the rotation periods of low mass cluster members via the rotational modulation caused by magnetic activity and starspots. Irwin et al. (2007) found periods for 362 stars in NGC 2516 over the mass range (estimated from using the BHAC15 models) . Cross correlation with the GES target list showed 77 matches, 32 of which are both members (based on their ) and have km s-1 and . Irwin et al. (2008) found rotation periods for 176 stars in NGC 2547 over the mass range , 84 were matched with GES targets and 45 of these are members with high quality measurements. Makidon et al. (2004), Lamm et al. (2004) and Affer et al. (2013) measured rotational periods in NGC 2264 over the approximate mass range , yielding 226 matches with GES targets, 90 of which are members with high quality measurements (or 149 if we take the broader definition of cluster membership in Sect. 2.4).
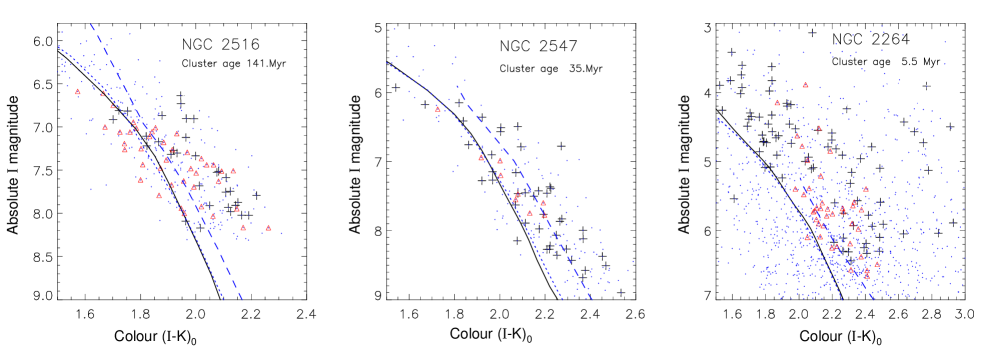
Figure 4 shows vs colour magnitude plots333This colour-magnitude diagram was chosen as and magnitudes were available for all targets in all three clusters. of the GES targets for each cluster, highlighting targets for which has been calculated. Also shown are solar metallicity isochrones interpolated according to the logarithm of cluster age for three different evolutionary models. The BHAC15 models (Baraffe et al. 2015), Dartmouth models (Dotter et al. 2008) and a modified version of the Dartmouth code that includes magnetic fields (Feiden & Chaboyer 2013; Feiden, Jones & Chaboyer 2015, see Sect. 4.1). The colour of targets in NGC 2516 and NGC 2547 are somewhat redder than the non-magnetic BHAC15/Dartmouth isochrones and are possibly better represented by the magnetic Dartmouth models. However, this may also partly be due to unresolved binaries in the sample, or could simply reflect the fact that the BHAC15 models do appear to predict colours that are too blue at (see fig.5 in BHAC15). Results for NGC 2264 show much more scatter in colour vs magnitude for both the GES targets and the subset of members with measured rotation period. This could be due to the presence of circumstellar material, accretion, differential reddening or perhaps indicate some variation in the age of cluster members.
Filled histograms in Fig. 1 show cluster members with resolved values of , i.e. those targets which are cluster members with a measured rotation period, km s-1 and . The median of this subset is 30 km s-1 for NGC 2516, 20 km s-1 for NGC 2547 and 21 km s-1 for NGC 2264. Table 3 lists the measured and calculated properties of all valid targets with and measured rotation period.
| Cluster | RA | Dec | MK | Membership | Period | Flag | |||||||
| degrees | degrees | km s-1 | km s-1 | km s-1 | mag | probability | days | ||||||
| NGC 2547 | 122.1693 | -48.8938 | 13.38 | 0.81 | 18.30 | 0.14 | 6.20 | -1.72 | 0.94 | 1.06 | 0.39 | 0.05 | |
| NGC 2547 | 122.4060 | -49.0341 | 12.48 | 0.41 | 15.10 | 0.09 | 5.30 | -1.31 | 0.98 | 1.96 | 0.59 | 0.05 | |
| NGC 2547 | 122.2800 | -49.3207 | 12.09 | 0.18 | 5.50 | 0.06 | 4.15 | -0.68 | 0.98 | 5.26 | 0.58 | 0.04 | |
| NGC 2547 | 122.3004 | -49.4583 | 13.03 | 0.79 | 17.90 | 0.15 | 6.32 | -1.77 | 0.96 | 1.57 | 0.56 | 0.08 | |
| NGC 2547 | 122.3077 | -49.5550 | 16.85 | 0.36 | 16.10 | 0.07 | 5.31 | -1.36 | 0.16 | 1.69 | 0.55 | 0.04 | |
| Note values are shown only where km s-1 and where is the relative uncertainty in | |||||||||||||
| Flag is set to 1 for targets in cluster NGC 2264 where a (H-K) versus (J-H) colour colour plot indicates possible infra-red excess. | |||||||||||||
3.2 Averaged radii as a function of luminosity
The averaged radii of stars is calculated from and following the method described by Jeffries (2007). The product of these quantities gives the projected radii in solar units, , where is in days and is in km s-1. Assuming that the stellar spin axes are randomly oriented (e.g. Jackson & Jeffries 2010a) then in principle the average radius can be found by dividing the average for a group of similar stars by an average value of . estimates for cluster members are divided into magnitude (and later luminosity) bins with approximately equal numbers of targets per bin. The radius value for each bin, is calculated from the median value of per bin, which is then corrected for the inclinations based on a distribution of values and measurement uncertainties. Taking the median value of is preferred over the mean, since it minimises the effects of the expected extended tail in the distribution of uncertainties.
A Monte Carlo method was used to determine the correction to the median and the uncertainty in this correction. Samples of individual values, with estimates of measurement precision, and a known probability distribution of were simulated, under the assumption that the uncertainty in is dominated by (see Section 2.1 and Table 3). It is further assumed that the stellar spin axes are randomly distributed but that can only be resolved if . The reason for this threshold is that stars with low inclinations do not exhibit sufficient rotational modulation to enable a rotation period determination or do not have sufficient equatorial velocity to yield a resolvable .
Random values of were drawn from the distribution where . The value of was estimated directly from the measured distribution of values about the median value of in two absolute magnitude bins for each cluster (see Jackson et al. 2009 for details). For the present data sets we find an average , which corresponds to . (Note that the effect of is small, because relatively few stars have a low value of in a random distribution of orientations.) Multiple realisations are modelled using the appropriate uncertainties for the dataset under consideration. The distribution of median values is then analysed to determine the value of and its uncertainty.
| Sample | |||||
| NGC 2516 (a) | 15 | 13.1505 | -1.19 | 0.60 | 0.620.08 |
| 16 | 13.7205 | -1.47 | 0.49 | 0.490.06 | |
| NGC 2547 (a) | 15 | 12.5108 | -1.01 | 0.66 | 0.730.07 |
| 15 | 13.2905 | -1.36 | 0.44 | 0.780.11 | |
| 14 | 13.8905 | -1.63 | 0.29 | 0.570.07 | |
| NGC 2264 (a) | 21 | 11.6204 | +0.01 | 1.22 | 2.00 0.16 |
| 20 | 12.0902 | -0.18 | 1.04 | 1.76 0.16 | |
| 20 | 12.4703 | -0.35 | 0.82 | 1.67 0.15 | |
| 20 | 13.1606 | -0.68 | 0.52 | 1.21 0.12 | |
| NGC 2264 (b) | 33 | 11.6204 | -0.01 | 1.25 | 2.25 0.23 |
| 34 | 12.0902 | -0.20 | 1.04 | 1.65 0.11 | |
| 31 | 12.4703 | -0.38 | 0.82 | 1.68 0.13 | |
| 23 | 13.1606 | -0.72 | 0.51 | 1.27 0.10 | |
| (a) Averaged radii for members selected on with | |||||
| period, km s-1 and . | |||||
| (b) Averaged radii for all targets with period, | |||||
| km s-1 and . | |||||
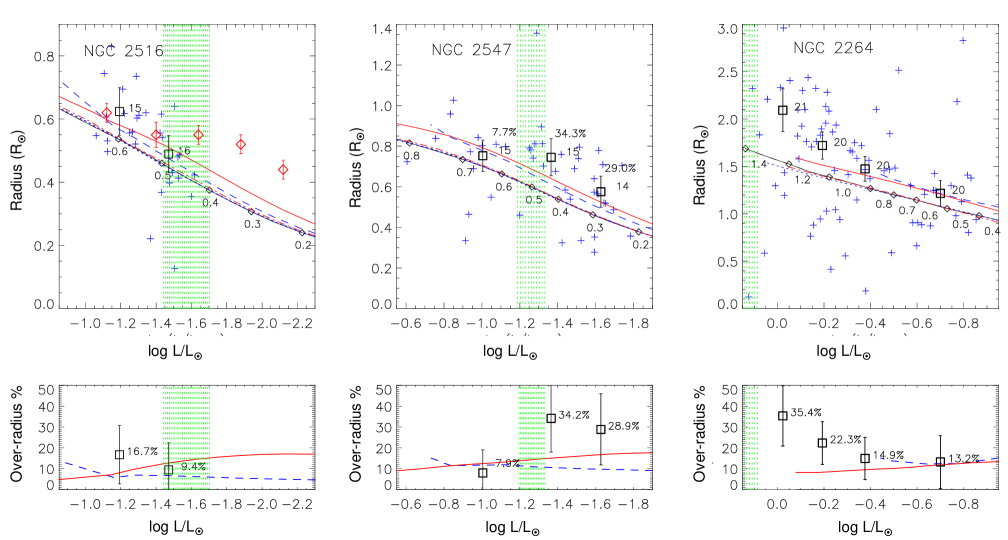
Table 4 shows the average radii, , derived from the estimates for members of each cluster with luminosities corresponding to masses in the range according to the BHAC15 model of Baraffe et al. (2015). The results are binned according to magnitude with 15 to 20 targets per bin (or if the wider membership criteria is adopted for NGC 2264) . In NGC 2547 and NGC 2516 a single outlier with an exceptionally small mag was excluded. The relationships between and apparent magnitude are model- and distance-independent and not affected by the estimated reddening to the cluster. Also shown in Table 4 are the model-, distance- and reddening-dependent average luminosity and mass per bin derived from BHAC15 model isochrones (Baraffe et al. 2015) using the cluster parameters shown in Table 2.
The over-radius of a set of targets relative to an evolutionary model is calculated as the median value of the over-radii of individual targets relative to the model radii at equivalent luminosity, corrected for the effects of inclination and measurement uncertainties using the same Monte-Carlo model.
3.3 Measurement accuracy
The uncertainty in and in over-radius depends on the number of targets. A simple estimate of the expected uncertainty is given by considering the ideal case where the uncertainties in and are small compared to the uncertainty in the mean value of , which (in the absence of a lower cut off) has a mean value of where is the number of targets per bin. Hence the minimum uncertainty in for is per cent, and would reduce to 3 per cent for . The estimates of uncertainty in shown in Table 4, from Monte Carlo simulations, also take account of the measurement errors in and the non Gaussian distribution of (see Sect. 3.2), giving average uncertainties of per cent for our bin occupancies of .
The procedure described in Sect. 3.2 gives an unbiased estimate of provided that and are themselves unbiased and the distribution of is modelled correctly. Hartman et al. (2010) pointed out that differential rotation may systematically increase the measured values of . However the rate of differential rotation is low for active K- and M- dwarfs (e.g. Reinhold, Reiners & Basri 2013), and the effect of any positive bias in produced by differential rotation is offset by a corresponding negative bias in measured . The net changes in inferred radii using the method discussed here should be less than 1 per cent (see discussion in Jackson & Jeffries 2014b). A second source of bias is uncertainty in the distribution of , in particular the effect of uncertainty in the lower cut off value, , below which values cannot be obtained. However, the large uncertainty in given in Sect 3.2 corresponds to only a 2 per cent systematic error in and and so is much less important than the statistical uncertainties.
A further source of uncertainty could be contributed by targets that are unresolved spectroscopic binaries. For some fraction of these targets, the measured values of could be systematically higher than the true of the primary star, depending on the difference in RVs of the primary and secondary stars and their relative contribution to the GES spectra. This would lead to an upward bias in the estimate of . Appendix 1 presents an analysis of the effects of binarity on the measured value of which is then used to estimate the increase in for individual observations assuming the binary distribution described in Sec. 2.4. Calculations of the averaged radii (Sec. 3.2) were repeated with a correction made for this binary bias in . For NGC 2516 and NGC 2547 there was a small reduction ( per cent) in the averaged radii whilst for NGC 2264 the downward correction was higher at per cent, due to its more massive members that have a higher assumed binary fraction. The bias caused by binarity is therefore not completely negligible, but is still small compared to the statistical uncertainties for the current data set.
4 Discussion
4.1 Comparison with model isochrones
Figure 5 compares the measured radii, as a function of luminosity, with the predictions of three current evolutionary models, two of which have also been adapted to explicitly include the effects of magnetic fields and activity on the evolution of low-mass stars. The models considered are:
-
1.
The solar metallicity isochrones of versus for the BHAC15 model (Baraffe et al. 2015), interpolated to the cluster ages in Table 2. Open circles on the isochrones mark fiducial mass points.
-
2.
The Dartmouth (Dotter et al. 2008) and Dartmouth-magnetic models (Feiden & Chaboyer 2013; Feiden, Jones & Chaboyer 2015). The latter is a version of the Dartmouth evolutionary code modified to take account of the effect of magnetic fields on the equation of state and on mixing length theory in the stellar interior of magnetically active stars. The isochrones shown here correspond to the rotational dynamo model of Feiden & Chaboyer (2013) with a surface field strength of 2.5 kG, as described in detail by Malo et al. (2014).
-
3.
The YREC and YREC-spot models, where the standard YREC evolutionary code (van Saders & Pinsonneault 2013) has been adapted by Somers and Pinsonneault (2015; isochrones supplied by Somers, private communication) to model the effect of dark starspots on the evolution of magnetically active, low-mass stars. The specific isochrones in Fig. 5 show predicted radii for stars with 0 and 50 per cent coverage of starspots with an average spot temperature of 30 per cent of the temperature of the (unspotted) photosphere (equivalent to an effective coverage by dark spots of 30 per cent).
In the absence of imposed magnetic fields and/or starspots all three models show almost identical radii as a function of luminosity in the upper panels of Fig.5. The effect of magnetic fields and/or starspots is to increase radii at a given luminosity, although the percentage increase in radius at a given field strength or spot coverage varies with both mass and age. This over-radius, expressed with respect to their non-magnetic counterpart models, is compared with our measurements of average radii with respect to the BHAC15 isochrones in the lower panels of Fig. 5. The shaded areas in Fig. 5 indicate the range of luminosities over which stars are expected to develop radiative cores according to the BHAC15 model at the assumed age of the clusters. i.e. stars to the left of the shaded area are expected to have radiative cores, stars to the right are expected to be fully convective and still be descending their Hayashi tracks. The width of these regions corresponds to , the resolution of the model grids in our possession.
The percentage increase in radius shown by the Dartmouth-magnetic model with respect to non-magnetic models is smaller for the low-mass, fully convective stars. This is consistent with the results of Feiden & Chaboyer (2012, 2013) for MS stars, where magnetic inhibition of convection can produce significant inflation for stars with radiative cores but has less effect (for a given magnetic field strength) for fully convective stars. Starspots have the opposite effect, producing a larger radius inflation for fully-convective PMS stars. Jackson & Jeffries (2014b) used polytropic models to show that starspots slow stellar contraction along Hayashi tracks, asymptotically inflating the radii of PMS stars by a factor of compared to unspotted stars of the same luminosity, where is the equivalent covering fraction of dark starspots and . This is a much stronger inflation than predicted by Spruit & Weiss (1986) for spotted MS stars with the same . The over-radius predicted for fully convective stars in NGC 2516 and NGC 2547 by the YREC-spot model with (shown in Fig. 5) is per cent, which is fully consistent with the simple scaling derived from polytropic models.
4.2 NGC 2547
We consider this cluster first since we have data for both fully convective PMS stars and ZAMS stars with radiative cores. Figure 5 shows averaged radii for 44 targets divided into 3 bins, one to the left of the shaded area containing stars with radiative cores and two to the right, containing fully convective stars on their Hayashi tracks. The average over-radius for the full sample, relative to the predictions of the BHAC15 model is per cent. This result applies to cluster members having per cent probability of membership according to their (see Sect. 2.4). There are in addition 15 targets with measured but per cent membership probability (see Table 3). This latter sample is expected to contain a significant proportion of stars from a secondary population identified by Sacco et al. (2015) as kinematically distinct and much younger than NGC 2547. Taking an age of Myr (Sacco et al. 2015) and assuming then the radius of any stars belonging to this younger population should be per cent larger than members of NGC 2547. The mean over-radius of these 15 targets is per cent and thus consistent with a significant proportion belonging to the younger population identified by Sacco et al.
For NGC 2547 the highest luminosity bin in Fig. 5, containing stars with radiative cores, has compatible (within ) with both magnetic and non-magnetic evolutionary models. The low-luminosity bins containing fully convective stars show significantly higher radii than predicted by the non-magnetic evolutionary models. The average over-radius for data in these two lower mass bins is per cent compared to the BHAC15 isochrone. The possible systematic errors discussed in section 3.2 associated with differential rotation, uncertainties in the threshold inclination for measurement or binarity, are small compared with the statistical uncertainties. There are additional systematic uncertainties due to possible errors in the assumed distance modulus, reddening and age. These effects are also small for NGC 2547 where the combined uncertainty in and leads to an uncertainty of only 0.04 dex in estimated values, which corresponds to less than a 2.5 per cent change in radius at a fixed luminosity. A change in age of Myr leads to a change of only per cent in the average over-radius with respect to the BHAC15 models. It follows that the estimated over-radius (with respect to non-magnetic models) for convective stars is significantly larger () than both the random errors in the measurements and the systematic uncertainties in the method.
The observed over-radius of per cent could be caused by either magnetic inhibition of convection, by starspots or by a combination of the two.
-
•
The curve in the lower panel of Fig. 5 shows the over-radius produced by Dartmouth-magnetic models for a rotational dynamo and surface magnetic field strength of 2.5 kG. The over-radius amounts to about 10 per cent for the low-mass fully-convective stars. The plots in Feiden et al. (2015) suggest that a much larger surface magnetic field would be required to explain a 30 per cent over-radius, but this would be incompatible with the level of (integrated) magnetic field measured on rapidly rotating M-dwarfs of 31 kG (Reiners, Basri & Browning 2009). The turbulent dynamo model of Feiden & Chaboyer (2013) has a much smaller effect on low-mass PMS stars (e.g. see Malo et al. 2014).
-
•
The YREC-spot models with predict an over-radius of about 15-18 per cent for fully convective stars in NGC 2547, which is almost compatible with the observations. Using the scaling relation between over-radius and spot coverage of Jackson & Jeffries (2014b), the measured over-radius would actually correspond to . If we adopt the temperature ratio of between spots and unspotted photosphere, as measured by O’Neal et al. (2004) and O’Neal (2006) in some active G/K dwarfs, this would require a spot area coverage of per cent. If the temperature ratio was larger, as advocated by Feiden & Chaboyer (2014), then this would require an even higher spot coverage.
-
•
Alternatively, the observed level of radius inflation could result from the combined effects of inhibition of convection in the stellar interior and inhibition of radiative heat transfer from the stellar surface due to starspots. This scenario was considered as one of several options to account for the over-radius of PMS stars in NGC 2516 by MacDonald & Mullan (2013). If we were to assume that the effects were additive, then a combination of the 2.5 kG Dartmouth-magnetic model and starspots with would give an over-radius of 30 per cent in fully convective stars (coincidentally this is almost exactly the sum of the over-radii shown for the two magnetic models in the lower panel of Fig. 5).
4.3 NGC 2516
GES targets in NGC 2516 are restricted to . Consequently there are relatively few targets with measured periods from the photometric survey of Irwin et al. (2007), which covered stars with . Only a fraction of these are relatively fast rotators ( km s-1), resulting in only 32 targets with measured . In Fig. 5 these data are divided into two bins both of which lie leftward of the shaded area indicating stars with radiative cores. According to the BHAC15 evolutionary model, stars of this luminosity and with an age of 140 Myr should be ZAMS stars. An average over-radius of 14 per cent relative to the BHAC15 model is inferred from the data. This falls to 8 per cent relative to the Dartmouth-magnetic/YREC-spot models. The measurement uncertainties are therefore too large to discern whether the magnetic or non-magnetic models better describe the data.
Also shown in Fig. 5 are estimates of from previous work (Table 1 of Jackson & Jeffries 2014b), which also used Giraffe spectroscopy to estimate and periods from Irwin et al. (2007), to determine for a sample that extended to lower luminosities. The inferred mean radii from both datasets show reasonable agreement for ZAMS stars over a relatively narrow common mass range () and these are consistent with either magnetic or non-magnetic models. The results of Jackson & Jeffries (2014b) however demonstrate a much larger over-radius ( per cent) for fully convective PMS stars. This is the same situation as found in NGC 2547 and could be explained in the same way. Unfortunately no direct comparison for PMS stars in NGC 2516 can be made using the GES data.
4.4 NGC 2264
Figure 5 shows average radii for targets in the mass range according to the BHAC15 model of Baraffe et al. (2015). All but two targets show luminosities to the right of the shaded area indicating that they are PMS stars still on their Hayashi tracks. Table 4 lists the average radii for two cases; the first calculated using values for targets identified as cluster members in section 2.2, the second using a sample of all targets with measured and km s-1 and km s-1. The broader sample generally shows higher radii but not at a significant level. The results, as measured, are consistent with the majority of the faster rotating targets being members of a single young cluster.
The colour-magnitude plot (Fig. 4) shows a number of targets with measured that have mag redder than the BHAC15 isochrone, too red to be unresolved binaries and suggesting that a fraction of the targets in NGC 2264 show excessive reddening and/or an infra-red excess due to the presence of disks, which could in turn effect their estimated luminosities and consequently our estimates of over-radius. To test this hypothesis, targets with measured period were plotted on a versus colour colour diagram and those showing higher than expected colour with respect to the usual reddening band were flagged in Table 3 as having a possible infra-red excess. Excluding these flagged targets reduces the sample size by 10–20 per cent per bin but makes no makes no measurable difference ( per cent) to the averaged radii and over-radii. Hence, including the few stars with overt signs of circumstellar material appears not to significantly affect the results.
Comparison of the measured radii with the 5.5 Myr isochrone of the BHAC15 model shows an average over-radius of per cent. Lower mass stars () show an average over-radius similar to that predicted by either the Dartmouth-magnetic model or the YREC-spot model. However, for NGC 2264 the inferred over-radii depends strongly on the adopted cluster age and to a lesser extent on its distance. If we assume an uncertainty of Myr in age at a fixed distance, which is comparable to the age spread suggested by Sung et al. (2010), then the over-radius varies from per cent for an age of 3 Myr to per cent at 8 Myr. In principle, comparison of measured and predicted radii could be used to help constrain the age of very young clusters (e.g. Jeffries 2007). However such comparisons are strongly model dependent since the predicted radius at a given age depends on how the effects of the rotationally induced magnetic fields are represented (if at all) in the evolutionary model.
5 Summary
GES determinations of for photometrically selected candidates have been used to define samples of low-mass members in the three young clusters NGC 2516, NGC 2547 and NGC 2264. By combining GES measurements of projected rotation velocity and published rotation periods for a subset of these stars, we have estimated model-independent projected radii as a function of magnitude for all three clusters. Average radii as a function of luminosity are calculated and compared with isochrones predicted by several evolutionary models, including variants that incorporate the influence of magnetic inhibition of convection or photospheric starspots.
-
•
The radii of these young, fast-rotating stars in NGC 2547 and NGC 2516 are, on average, larger than predicted by non-magnetic evolutionary models. However, the discrepancy is mostly apparent for the lower-mass, fully convective PMS stars. The current uncertainties in the age and distance for NGC 2264 preclude any meaningful comparison of stellar radii with the models.
-
•
The radii measured for higher-mass ZAMS stars in NGC 2547 and NGC 2516 are consistent with either non-magnetic or magnetic models. However, the difference between the predicted radii from these models ( per cent) is comparable to the precision with which our limited samples permit the determination of average radii. A more decisive test would require an additional determinations of rotation periods to reduce the measurement uncertainties below 5 per cent.
-
•
In contrast the average radii of the lower-mass PMS stars significantly exceed those predicted by non-magnetic models – by per cent for members of NGC 2547 and by per cent for members of NGC 2516 studied previously using similar techniques. To explain this inflation with the magnetic models would either require: (i) rotational dynamos that produce very large surface magnetic fields ( kG), that may be incompatible with direct measurements of surface fields on active stars; (ii) starspots that block 30-50 per cent of the photospheric flux; or a more moderate combination of both.
Acknowledgements.
RJJ wishes to thank the UK Science and Technology Facilities Council for financial support. Based on data products from observations made with ESO Telescopes at the La Silla Paranal Observatory under programme ID 188.B-3002. These data products have been processed by the Cambridge Astronomy Survey Unit (CASU) at the Institute of Astronomy, University of Cambridge, and by the FLAMES/UVES reduction team at INAF/Osservatorio Astrofisico di Arcetri. These data have been obtained from the Gaia-ESO Survey Data Archive, prepared and hosted by the Wide Field Astronomy Unit, Institute for Astronomy, University of Edinburgh, which is funded by the UK Science and Technology Facilities Council. This work was partly supported by the European Union FP7 programme through ERC grant number 320360 and by the Leverhulme Trust through grant RPG-2012-541. We acknowledge the support from INAF and Ministero dell’ Istruzione, dell’ Università’ e della Ricerca (MIUR) in the form of the grant ”Premiale VLT 2012”. The results presented here benefit from discussions held during the Gaia-ESO workshops and conferences supported by the ESF (European Science Foundation) through the GREAT Research Network Programme.References
- Affer et al. (2013) Affer, L., Micela, G., Favata, F., Flaccomio, E., & Bouvier, J. 2013, MNRAS, 430, 1433
- Baraffe et al. (1998) Baraffe, I., Chabrier, G., Allard, F., & Hauschildt, P. H. 1998, A&A, 337, 403
- Baraffe et al. (2015) Baraffe, I., Homeier, D., Allard, F., & Chabrier, G. 2015, A&A, 577, A42
- Baxter et al. (2009) Baxter, E. J., Covey, K. R., Muench, A. A., et al. 2009, AJ, 138, 963
- Boyajian et al. (2012) Boyajian, T. S., von Braun, K., & van Belle, G. 2012, ApJ, 757, 112
- Carpenter (2001) Carpenter, J. M. 2001, AJ, 121, 2851
- Chabrier et al. (2007) Chabrier, G., Gallardo, J., & Baraffe, I. 2007, A&A, 472, L17
- Cottaar et al. (2012) Cottaar, M., Meyer, M. R., & Parker, R. J. 2012, A&A, 547, A35
- Dotter et al. (2008) Dotter, A., Chaboyer, B., Jevremović, D., et al. 2008, ApJS, 178, 89
- Dzib et al. (2014) Dzib, S. A., Loinard, L., Rodríguez, L. F., & Galli, P. 2014, ApJ, 788, 162
- Feiden & Chaboyer (2012) Feiden, G. A. & Chaboyer, B. 2012, ApJ, 761, 30
- Feiden & Chaboyer (2013) Feiden, G. A. & Chaboyer, B. 2013, ApJ, 779, 183
- Feiden & Chaboyer (2014) Feiden, G. A. & Chaboyer, B. 2014, ApJ, 789, 53
- Feiden et al. (2015) Feiden, G. A., Jones, J., & Chaboyer, B. 2015, in Cambridge Workshop on Cool Stars, Stellar Systems, and the Sun, Vol. 18, 18th Cambridge Workshop on Cool Stars, Stellar Systems, and the Sun, ed. G. T. van Belle & H. C. Harris, 171–176
- Gilmore et al. (2012) Gilmore, G., Randich, S., Asplund, M., & et al. 2012, The Messenger, 147, 25
- Hartman et al. (2010) Hartman, J. D., Bakos, G. Á., Kovács, G., & Noyes, R. W. 2010, MNRAS, 408, 475
- Irwin et al. (2008) Irwin, J., Hodgkin, S., Aigrain, S., et al. 2008, MNRAS, 384, 675
- Irwin et al. (2007) Irwin, J., Hodgkin, S., Aigrain, S., et al. 2007, MNRAS, 377, 741
- Jackson & Jeffries (2010a) Jackson, R. J. & Jeffries, R. D. 2010a, MNRAS, 402, 1380
- Jackson & Jeffries (2010b) Jackson, R. J. & Jeffries, R. D. 2010b, MNRAS, 407, 465
- Jackson & Jeffries (2014a) Jackson, R. J. & Jeffries, R. D. 2014a, MNRAS, 445, 4306
- Jackson & Jeffries (2014b) Jackson, R. J. & Jeffries, R. D. 2014b, MNRAS, 441, 2111
- Jackson et al. (2015) Jackson, R. J., Jeffries, R. D., Lewis, J., et al. 2015, A&A, 580, A75
- Jackson et al. (2009) Jackson, R. J., Jeffries, R. D., & Maxted, P. F. L. 2009, MNRAS, 399, L89
- Jeffries (2007) Jeffries, R. D. 2007, MNRAS, 376, 1109
- Jeffries et al. (2014) Jeffries, R. D., Jackson, R. J., Cottaar, M., & et al. 2014, A&A, 563, A94
- Jeffries et al. (1998) Jeffries, R. D., James, D. J., & Thurston, M. R. 1998, MNRAS, 300, 550
- Jeffries et al. (2004) Jeffries, R. D., Naylor, T., Devey, C. R., & Totten, E. J. 2004, MNRAS, 351, 1401
- Jeffries & Oliveira (2005) Jeffries, R. D. & Oliveira, J. M. 2005, MNRAS, 358, 13
- Jeffries et al. (2001) Jeffries, R. D., Thurston, M. R., & Hambly, N. C. 2001, A&A, 375, 863
- Jeffries et al. (2000) Jeffries, R. D., Totten, E. J., & James, D. J. 2000, MNRAS, 316, 950
- Kamezaki et al. (2013) Kamezaki, T., Imura, K., Nagayama, T., et al. 2013, in IAU Symposium, Vol. 292, IAU Symposium, ed. T. Wong & J. Ott, 45–45
- Lamm et al. (2004) Lamm, M., Bailer-Jones, C. A. L., Mundt, R., & Herbst, W. 2004, in IAU Symposium, Vol. 215, Stellar Rotation, ed. A. Maeder & P. Eenens, 125–+
- López-Morales (2007) López-Morales, M. 2007, ApJ, 660, 732
- Lyra et al. (2006) Lyra, W., Moitinho, A., van der Bliek, N. S., & Alves, J. 2006, A&A, 453, 101
- MacDonald & Mullan (2012) MacDonald, J. & Mullan, D. J. 2012, MNRAS, 421, 3084
- MacDonald & Mullan (2013) MacDonald, J. & Mullan, D. J. 2013, ApJ, 765, 126
- Magrini & Randich (2015) Magrini, L. & Randich, S. 2015, ArXiv e-prints 1505.08027
- Makidon et al. (2004) Makidon, R. B., Rebull, L. M., Strom, S. E., Adams, M. T., & Patten, B. M. 2004, AJ, 127, 2228
- Malo et al. (2014) Malo, L., Doyon, R., Feiden, G. A., et al. 2014, ApJ, 792, 37
- Meynet et al. (1993) Meynet, G., Mermilliod, J.-C., & Maeder, A. 1993, A&AS, 98, 477
- Morales et al. (2009) Morales, J. C., Ribas, I., Jordi, C., et al. 2009, ApJ, 691, 1400
- Mullan & MacDonald (2001) Mullan, D. J. & MacDonald, J. 2001, ApJ, 559, 353
- Naylor & Jeffries (2006) Naylor, T. & Jeffries, R. D. 2006, MNRAS, 373, 1251
- Naylor et al. (2002) Naylor, T., Totten, E. J., Jeffries, R. D., et al. 2002, MNRAS, 335, 291
- O’Neal (2006) O’Neal, D. 2006, ApJ, 645, 659
- O’Neal et al. (2004) O’Neal, D., Neff, J. E., Saar, S. H., & Cuntz, M. 2004, AJ, 128, 1802
- Pasquini et al. (2002) Pasquini, L., Avila, G., Blecha, A., & et al. 2002, The Messenger, 110, 1
- Raghavan et al. (2010) Raghavan, D., McAlister, H. A., Henry, T. J., et al. 2010, ApJS, 190, 1
- Randich et al. (2013) Randich, S., Gilmore, G., & Gaia-ESO Consortium. 2013, The Messenger, 154, 47
- Reiners et al. (2009) Reiners, A., Basri, G., & Browning, M. 2009, ApJ, 692, 538
- Reinhold et al. (2013) Reinhold, T., Reiners, A., & Basri, G. 2013, A&A, 560, A4
- Sacco et al. (2015) Sacco, G. G., Jeffries, R. D., Randich, S., & et al. 2015, A&A, 574, L7
- Skrutskie et al. (2006) Skrutskie, M. F., Cutri, R. M., Stiening, R., et al. 2006, AJ, 131, 1163
- Somers & Pinsonneault (2014) Somers, G. & Pinsonneault, M. H. 2014, ApJ, 790, 72
- Somers & Pinsonneault (2015) Somers, G. & Pinsonneault, M. H. 2015, ApJ, 807, 174
- Spruit & Weiss (1986) Spruit, H. C. & Weiss, A. 1986, A&A, 166, 167
- Sung & Bessell (2010) Sung, H. & Bessell, M. S. 2010, AJ, 140, 2070
- Sung et al. (2008) Sung, H., Bessell, M. S., Chun, M.-Y., Karimov, R., & Ibrahimov, M. 2008, AJ, 135, 441
- Sung et al. (1997) Sung, H., Bessell, M. S., & Lee, S.-W. 1997, AJ, 114, 2644
- Terndrup et al. (2002) Terndrup, D. M., Pinsonneault, M., Jeffries, R. D., et al. 2002, ApJ, 576, 950
- Tobin et al. (2015) Tobin, J. J., Hartmann, L., Fűrész, G., Hsu, W.-H., & Mateo, M. 2015, AJ, 149, 119
- Torres et al. (2010) Torres, G., Andersen, J., & Giménez, A. 2010, A&A Rev., 18, 67
- Turner (2012) Turner, D. G. 2012, Astronomische Nachrichten, 333, 174
- van Saders & Pinsonneault (2013) van Saders, J. L. & Pinsonneault, M. H. 2013, ApJ, 776, 67
Appendix A Estimating the effect of binarity on measured values of
In the Gaia-ESO survey pipeline is estimated from the broadening of spectral lines produced by stellar rotation. In the case of unresolved binaries, the line widths of the measured spectrum may be increased relative to those of the primary star depending on the difference in RV between the primary and secondary star and the relative contribution of the secondary to the observed spectrum.
The additional broadening can be determined as a function of the line of sight velocity of the primary relative to the centre of mass, , and the relative flux contribution of the secondary at the wavelength of the observed spectra, , by measuring the FWHM, , of a Gaussian profile fitted to the sum of two separate Gaussian profiles. The first Gaussian represents the primary star with central velocity and FWHM ; the second Gaussian represents the secondary with velocity and FWHM , where is the binary mass ratio.
To a reasonable approximation the effect of rotational broadening is to increase the measure FWHM as where is the unbroadened line width, is a constant dependent on the resolution, , of the spectrograph and the speed of light, , as , giving km s-1 for the Giraffe spectrograph using order sorting filter HR15N (see Jackson et al. 2015 for derivation). Using this expression for , the apparent increase in the measured rotational velocity relative to the of the primary is given by, where .
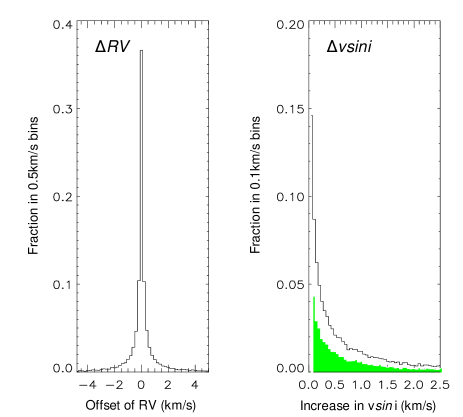
Fig. A.1 shows the distribution of the offset in the measured recession velocity, (relative to the centre of mass) and the increase in rotational velocity, obtained for a random distribution of binary stars (as described in Sect. 2.3) with similar true rotational velocities of km s-1, where the relative flux from the secondary star is assumed to vary as a fixed power of mass with . Binary pairs showing large changes in will mostly have a membership probability (e.g. see Fig. 2). In this example binaries with km s-1 are assumed to be non-members and are not included in the distribution of . Of course, only a fraction of stars are in binaries and this further reduces the proportion of stars that show large offsets in (see Fig. A.1).
This analysis is used to calculate the additional bias in the averaged radius due to binarity. First the fractional increase in individual values is calculated from the median increase in using the target and (mass-dependent) binary fraction. The increased values of are then used to recalculate the averaged values of using the method described in Sect 3.2.