EPJ Web of Conferences \woctitleICNFP 2015
A possible evidence of observation of two mixed phases in nuclear collisions
Abstract
Using an advanced version of the hadron resonance gas model we have found several remarkable irregularities at chemical freeze-out. The most prominent of them are two sets of highly correlated quasi-plateaus in the collision energy dependence of the entropy per baryon, total pion number per baryon, and thermal pion number per baryon which we found at center of mass energies 3.6-4.9 GeV and 7.6-10 GeV. The low energy set of quasi-plateaus was predicted a long time ago. On the basis of the generalized shock-adiabat model we demonstrate that the low energy correlated quasi-plateaus give evidence for the anomalous thermodynamic properties of the mixed phase at its boundary to the quark-gluon plasma. The question is whether the high energy correlated quasi-plateaus are also related to some kind of mixed phase. In order to answer this question we employ the results of a systematic meta-analysis of the quality of data description of 10 existing event generators of nucleus-nucleus collisions in the range of center of mass collision energies from 3.1 GeV to 17.3 GeV. These generators are divided into two groups: the first group includes the generators which account for the quark-gluon plasma formation during nuclear collisions, while the second group includes the generators which do not assume the quark-gluon plasma formation in such collisions. Comparing the quality of data description of more than a hundred of different data sets of strange hadrons by these two groups of generators, we find two regions of the equal quality of data description which are located at the center of mass collision energies 4.3-4.9 GeV and 10.-13.5 GeV. These two regions of equal quality of data description we interpret as regions of the hadron-quark-gluon mixed phase formation. Such a conclusion is strongly supported by the irregularities in the collision energy dependence of the experimental ratios of the Lambda hyperon number per proton and positive kaon number per Lambda hyperon. Although at the moment it is unclear, whether these regions belong to the same mixed phase or not, there are arguments that the most probable collision energy range to probe the QCD phase diagram (tri)critical endpoint is 12-14 GeV.
1 Introduction
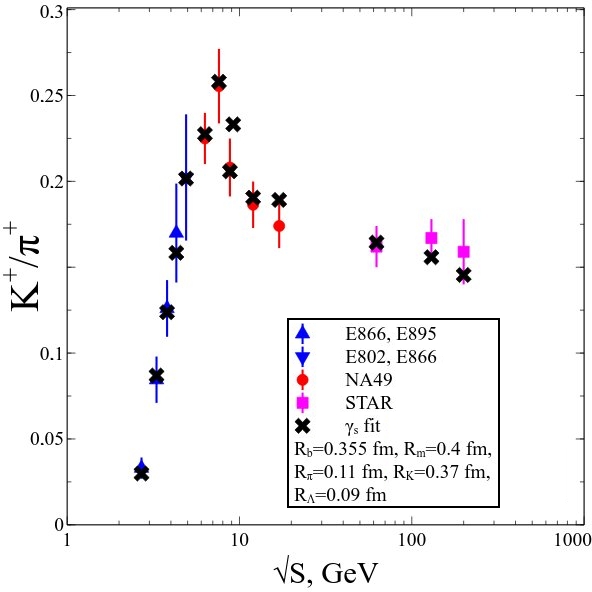
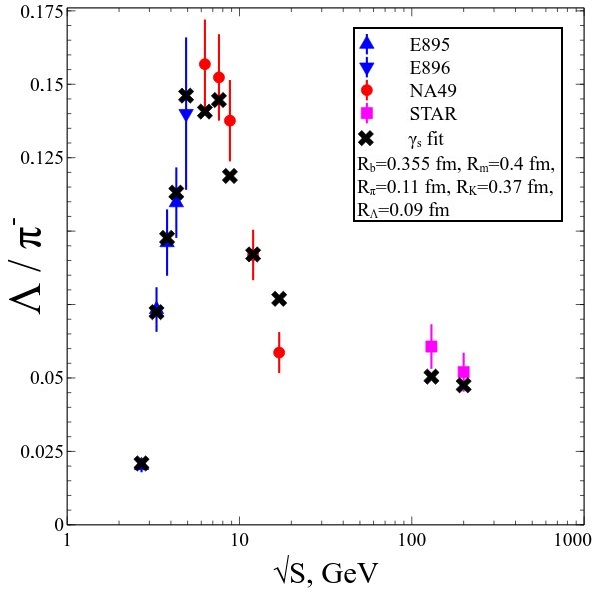
The hadron resonance gas model (HRGM) Andronic:05 is traditionally used to extract the parameters of chemical freeze-out (CFO) from the measured hadronic yields. Its version with the multicomponent hard-core repulsion Oliinychenko:12 ; HRGM:13 ; SFO:13 allowed one for the first time to successfully describe the most problematic ratios with and with without spoiling all other hadron yield ratios Sagun ; Sagun2 . Fig. 1 demonstrates the present fit quality of these traditionally problematic ratios. The achieved high quality Sagun ; Sagun2 of data description of 111 independent hadron yield ratios measured at midrapidity in central nucleus-nucleus collisions at the center of mass energies GeV proves that the multicomponent version of HRGM is a precise and a sensitive tool of heavy ion collision phenomenology.
Using the multicomponent version of HRGM it was possible to reveal a few novel irregularities at CFO. The most remarkable of them are two sets of highly correlated quasi-plateaus in the collision energy dependence of the entropy per baryon, total pion number per baryon, and thermal pion number per baryon which were found at the center of mass energies 3.6-4.9 GeV and 7.6-10 GeV Bugaev:SA1 and the sharp peak of the trace anomaly found at the center of mass energy 4.9 GeV Bugaev:SA2 . The low energy set of quasi-plateaus was predicted a long time ago KAB:89a ; KAB:90 ; KAB:91 as a signal of the anomalous thermodynamic properties inside the quark-gluon-hadron mixed phase. Unfortunately, the generalized shock-adiabat model cannot be safely applied to the central nuclear collisions at GeV KAB:89a . Therefore, in order to correctly interpret the high energy quasi-plateaus here we use the results of meta-analysis Metaanalisys of the quality of data description (QDD) of 10 existing event generators of nucleus-nucleus collisions along with the thorough analysis of irregularities in the existing experimental hadron yield ratios.
The work is organized as follows. In Sect. 2 we remind the basic elements of the HRGM with multicomponent hard-core repulsion. A brief description of the meta-analysis suggested in Metaanalisys is presented in Sect. 3 along with a discussion of existing hadron multiplicity data which help to shed light on the problem of the formation of two quark-gluon-hadron mixed phases. In Sect. 4 our conclusions are formulated.
2 HRGM with multicomponent hard-core repulsion
The HRGM is based on the assumption of local thermal and chemical equilibrium at CFO. Hence the hadron yields produced in the collisions of large atomic nuclei can be found using the grand canonical valuables, i.e. using the temperature , the baryonic , the strange and the isospin third projection chemical potentials. As usual, the chemical potential is fixed by the condition of zero total strange charge. The possible deviation of strange charge from the full chemical equilibrium is taken into account by the parameter Rafelski . It changes the thermal density of hadron sort as , where is the total number of strange valence quarks and antiquarks in such a hadron.
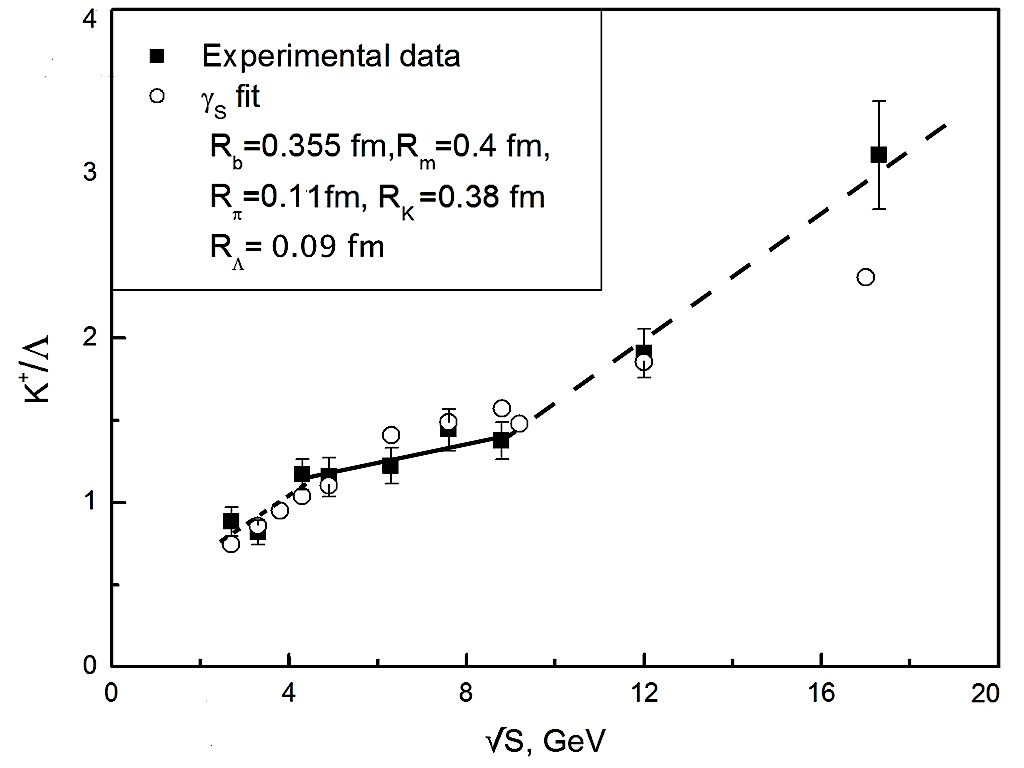
The main difference of the present version of HRGM from the ones developed by other authors is that in our HRGM several sorts of hadrons have individual hard-core radii. Thus, it employes different hard-core radii for pions, , kaons, , -hyperons, , other mesons, , and baryons, . The best global fit of 111 independent hadronic multiplicities measured in the whole collision energy range from GeV to GeV was found for = 0.355 fm, = 0.4 fm, = 0.1 fm, = 0.37 fm and fm with the quality Sagun ; Sagun2 . The second virial coefficient between the hadrons of hard-core radii and is defined as . Taking from the thermodynamic code THERMUS Thermus such characteristics of hadrons of sort as the spin-isospin degeneracy , the mass and the width one can find the set of partial pressures for each hadronic component ( is total pressure) from the system
| (1) |
Here is the full chemical potential of the -th hadronic sort expressed via its charges and the corresponding chemical potentials (with ). In the Boltzmann approximation the thermal density of -th hadronic sort reads as
| (2) |
where is a threshold of its dominant decay channel and is the normalized Breit-Wigner mass attenuation function. Thermal multiplicities ( is the effective volume at CFO) should be corrected by the hadron decays after the CFO according to the branching ratios . The latter define the probability of particle to decay into a particle . Hence the ratio of full multiplicities can be written as
| (3) |
With the help of (3) we obtained the high quality fit of experimental hadron ratios measured at AGS for energies GeVAGS1 ; AGS2 ; AGS2b ; AGS_p2 ; AGS3 ; AGS4 ; AGS5 ; AGS6 ; AGS7 ; AGS8 , at SPS energies GeV measured by the NA49 Collaboration SPS1 ; SPS2 ; SPS3 ; SPS4 ; SPS5 ; SPS6 ; SPS7 ; SPS8 ; SPS9 and at RHIC energies GeV measured by the STAR Collaboration RHIC . As described in SFO:13 ; HRGM:13 , from these data we constructed 111 independent ratios measured at 14 values of collision energies. The most important results are shown in Figs. 1 and 2. The left panel of Fig. 2 shows the highly correlated quasi-plateaus in the collision energy dependence of the entropy per baryon , total pion number per baryon , and thermal pion number per baryon at laboratory energies 6.9–11.6 GeV (i.e. GeV) which were found in Bugaev:SA1 . As one can see from the left panel of Fig. 2, a clear plateau is demonstrated by the thermal pion number per baryon while other quantities show quasi-plateaus. Nevertheless, all these quasi-plateaus are important, since their strong correlation with the plateau in the thermal pion number per baryon allows one to find out their common width in the collision energy Bugaev:SA1 ; Bugaev:SA2 .
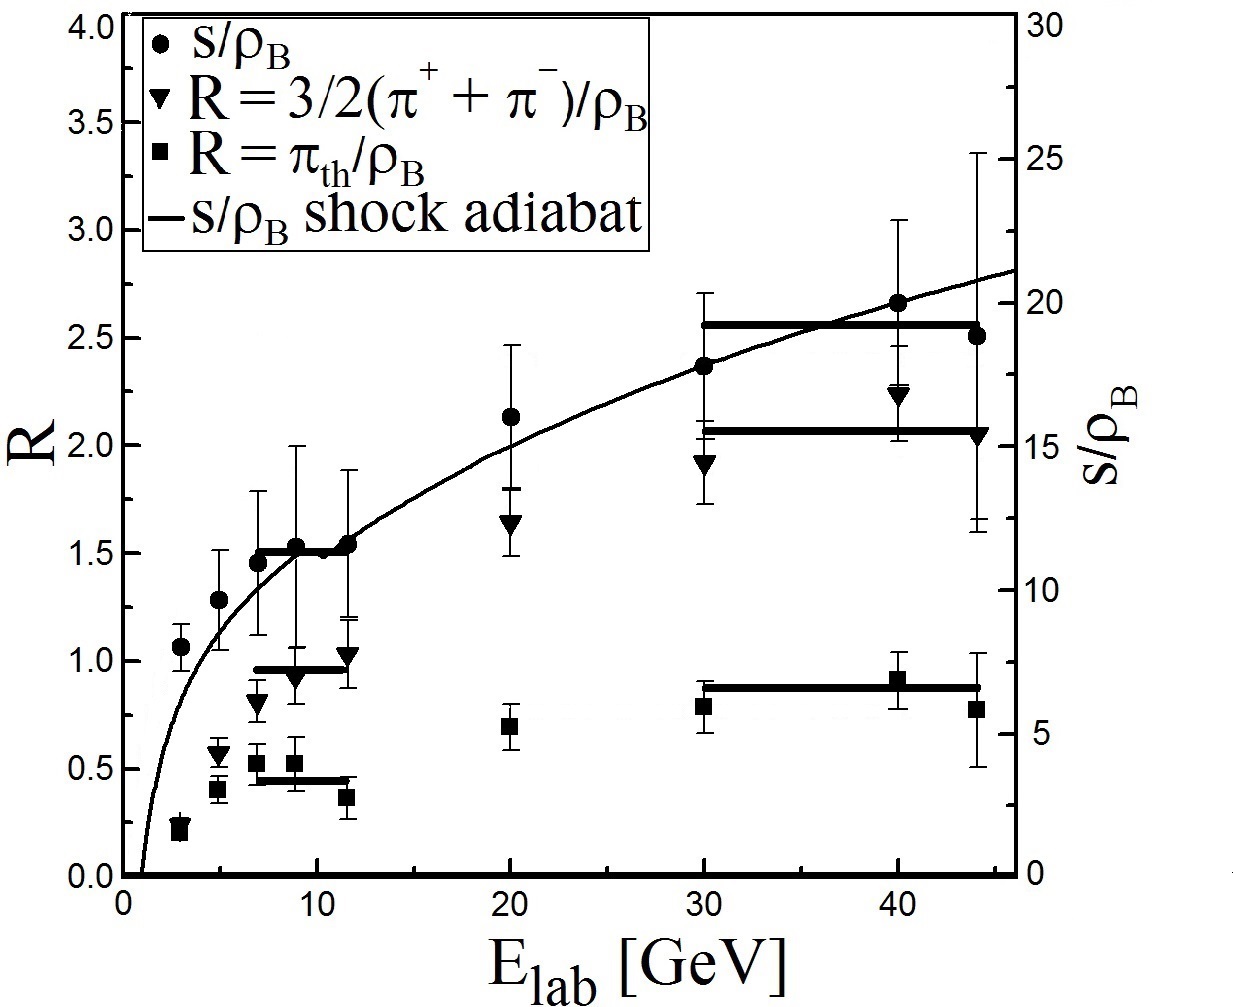
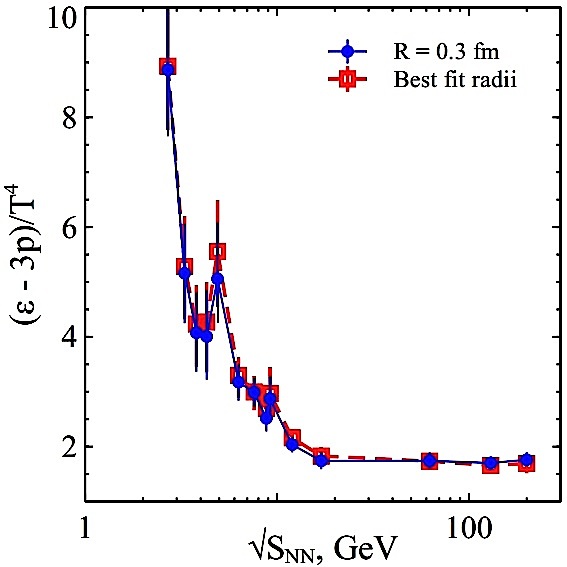
Note that these low energy quasi-plateaus were predicted about 25 years ago KAB:89a ; KAB:90 ; KAB:91 as a manifestation of the anomalous thermodynamic properties of quark-gluon-hadron mixed phase. In contrast to the normal thermodynamic properties, in the medium with the anomalous ones the adiabatic compressibility of matter increases for increasing pressure. In the normal media (pure gaseous or liquid phases) there exists a repulsion between the constituents at short distances which leads to an opposite behavior of the adiabatic compressibility. Therefore, an appearance of these quasi-plateaus is a signal of the quark-gluon-hadron mixed phase formation KAB:89a ; KAB:90 ; KAB:91 . Such a conclusion is strongly supported by an existence of the sharp peak of the trace anomaly (here is energy density) at GeV Bugaev:SA2 (see the right panel of Fig. 2). This peak is important, since in lattice QCD an inflection or a maximum point of the trace anomaly is used for a determination of the pseudo-critical temperature of the cross-over transition lQCD . One may think that a sharp peak of at CFO is exclusively generated by the peak of baryonic density which in our HRGM also exists at GeV. However, the real situation is more complicated. Writing the trace anomaly as
| (4) |
where in the last step the small contribution related to the charge of the third isospin projection is neglected. From (4) one can easily conclude that the strong increase of on the collision energy interval GeV is provided by a strong jump of the effective number of degrees of freedom on this interval Bugaev:SA2 ; NonsmFO . Note that despite the existence of a baryon density peak on this interval of collision energy, the entropy per baryon is constant on it as one can see from the left panel of Fig. 2. Now it is evident that without a strong jump of the effective number of degrees of freedom the sharp peak of trace anomaly at CFO would not exist. At higher collision energies the trace anomaly decreases mainly because the ratio strongly decreases, while the inverse entropy per baryon decreases slowly. It is important to mention that the sharp peak of is seen, if the finite width of all hadronic resonances is included into the HRGM NonsmFO , while for the HRGM with a zero width of hadron resonances such a peak is washed out.
The physical origin of the trace anomaly sharp peak (and, hence, of a strong jump of the effective number of degrees of freedom ) at CFO found at GeV is rooted in the trace anomaly peak existing at the shock adiabat Bugaev:SA2 . The shock adiabat model reasonably well describes the hydrodynamic and thermodynamic quantities of the initial state formed in the central nucleus-nucleus collisions in the laboratory energy range GeV 30 GeV Bugaev:SA2 , while at higher collision energies, i.e. for GeV, it can be used for qualitative estimates. In Bugaev:SA2 it was found that the peak of at the shock adiabat appears at the collision energy corresponding exactly to the boundary between the quark gluon plasma (QGP) and quark-gluon-hadron mixed phase and, therefore, the trace anomaly sharp peak at CFO is a signal of QGP formation. In this respect it is interesting that in the right panel of Fig. 2 one can see a second peak of trace anomaly located at GeV. Although the second peak of is less pronounced than the first one, it is also associated to the high energy set of quasi-plateaus shown in the left panel of Fig. 2 at the collision energy interval GeV ( GeV). Therefore, the future experiments at RHIC, NICA and FAIR will have to find out whether the high energy peak of trace anomaly has any physical meaning.
3 Meta-analysis of quality of data description
The main objects of a meta-analysis suggested in Metaanalisys are the mean deviation squared of the quantity of the model M from the data per number of the data points for a particle type
| (5) |
and its error which is defined according to the rule of indirect measurements Taylor82 as
| (6) |
where is an experimental error of the experimental quantity and the summation in Eqs. (5) and (6) runs over all data point at given collision energy. For a convenience the quantity defined in (5) is called the quality of data description (QDD). To get the most complete picture of the dynamics of nuclear collisions, one has to compare the available data on the transverse mass () distributions , the longitudinal rapidity () distributions and the hadronic yields (Y) measured at midrapidity or/and the total one, i.e. measured within 4 solid angle, since right these observables are traditionally believed to be sensitive to the equation of state properties Rafelski2 ; Shuryak .
The QDD of strange hadrons was found for two types of models Metaanalisys :
- •
- •
A short description of these models along with the criteria of their selection can be found in the Appendix of Metaanalisys .
The main idea of such a meta-analysis Metaanalisys is based on the assumption that the HG models of heavy ion collisions should provide worse description of the data above the QGP threshold energy, whereas below this threshold they should be able to better (or at least not worse) reproduce experimental data compared to the QGP models. Furthermore, it is assumed that both kinds of models should provide an equal and rather good QDD at the energy of mixed phase production. Hence, the energy of the mixed phase formation should be located below the energy at which the equal QDD is changed to the essentially worse QDD of HG models.
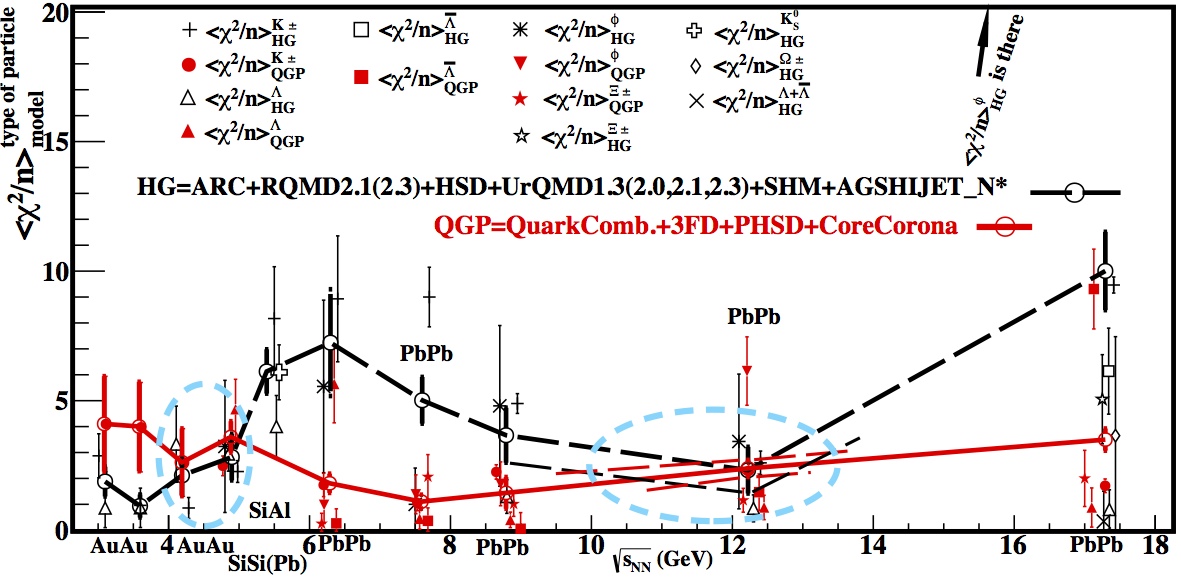
Based on these assumptions the experimental data measured at the collision energies 3.1, 3.6, 4.2, 4.9, 5.4, 6.3, 7.6, 8.8, 12.3 and 17.3 GeV were analyzed in Metaanalisys . The collision energies 4.9 GeV correspond to Au+Au reactions studied at AGS. At 5.4 GeV the reactions Pb+Si, Si+Si and Si+Al were also investigated at AGS, while higher collision energies correspond to Pb+Pb reactions studied at SPS. Using the definitions (5) and (6) at each collision energy the available description of the transverse mass distributions, the longitudinal rapidity distributions and the hadronic yields measured at midrapidity or/and the total one obtained by a given model was arithmetically averaged for each kind of analyzed strange hadron. The QDDs and their errors obtained for each energy and for each hadron were arithmetically averaged over the models belonging to the same type. Then the QDDs and their errors found in this way for the models belonging to the same type were arithmetically averaged for each hadron and antihadron, if available, in order to reduce the number of data for a comparison. Finally, the resulting QDDs and their errors of the same same type of model were arithmetically averaged over all hadronic species. More details can be found in Metaanalisys . The averaged QDDs of HG models and the ones of QGP models were found in this way together with their errors. The results are shown in Fig. 3.
From Fig. 3 one can see that the meta-analysis of work Metaanalisys leads to an independent conclusion that the mixed phase exists at the same collision energy range GeV which was originally found in Bugaev:SA1 ; Bugaev:SA2 . This result is important not only to validate the entire framework of shock adiabat model used in Bugaev:SA1 ; Bugaev:SA2 , but also to justify the jump of the effective number of degrees of freedom at CFO and a sharp peak of the trace anomaly at CFO as reliable signals of QGP formation. In addition the meta-analysis of QDD Metaanalisys predicts that the most probable collision energy range of the second phase transition is GeV. Thus, the meta-analysis of QDD supports an interpretation of the high energy set of correlated quasi-plateaus as an indicator of phase transition, although it shifts this transition to slightly higher collision energies.
Unfortunately, at present it is impossible to distinguish between two possible explanations of this phenomenon. The first possible explanation is that with increasing collision energy the initial states of thermally equilibrated matter formed in nucleus-nucleus collisions move first from the hadron gas into the mixed phase, then from the mixed phase to QGP and then again they return to the same mixed phase, but at higher initial temperature and lower baryonic density. Such a scenario corresponds to the case, if QCD phase digram has a critical endpoint Metaanalisys . An alternative explanation Metaanalisys corresponds to the QCD phase diagram with the tricritical endpoint. In such a case the second phase transition is the second order phase transition of (partial) chiral symmetry restoration or a transition between quarkyonic matter and QGP QYON . It is necessary to stress, that despite the lack of a single interpretation of the second phase transition possibly existing at GeV there are strong arguments Metaanalisys that the (tri)critical endpoint of QCD phase diagram maybe located at GeV.
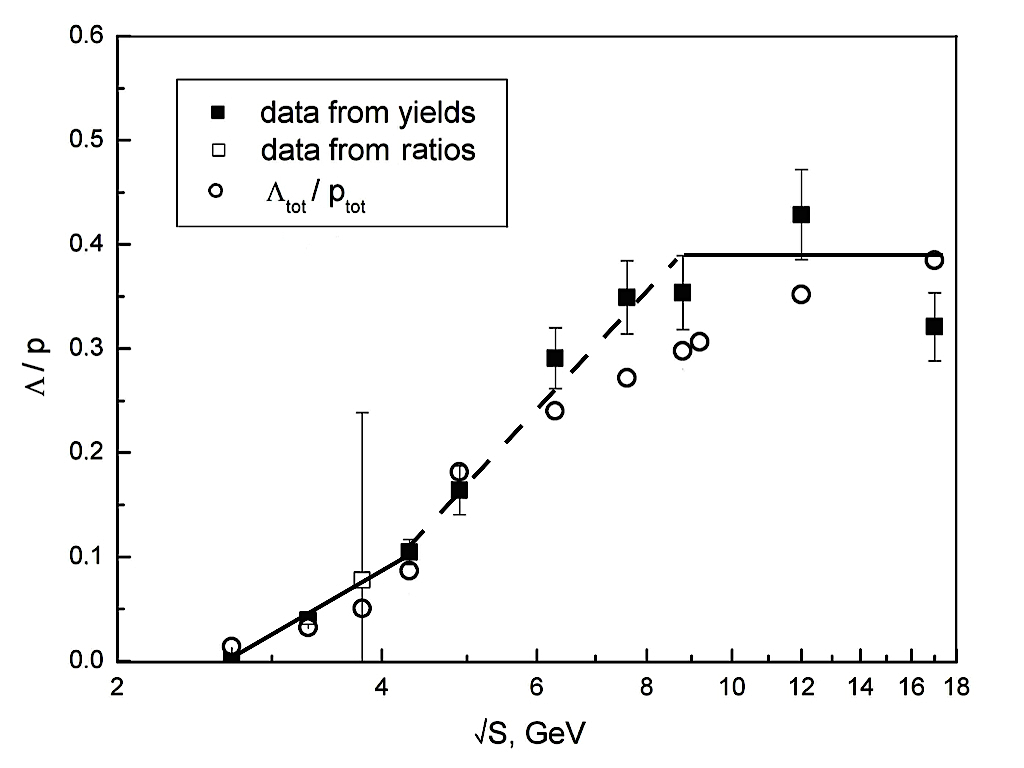
The combined conclusions obtained from inspecting two sets of correlated quasi-plateaus at CFO, two peaks of trace anomaly at CFO and the ones found out by the meta-analysis, led us a thorough analysis of the and ratios. From the left panel of Fig. 4 one can see that there are three regimes in the energy dependence of the ratio: at GeV the slope of this ratio clearly increases, while above GeV it nearly saturates. The sudden increase of slope at GeV can be naturally explained by the idea of work Rafelski:82 that the mixed phase formation can be identified by a rapid increase in the number of strange quarks per light quarks. Evidently, the ratio is a convenient indicator because at low collision energies hyperons are generated in collisions of nucleons. Moreover, such a ratio does not depend on baryonic chemical potential, since both the protons and hyperons have the same baryonic charge. As it is seen from the left panel of Fig. 4, this mechanism works up to GeV, while an appearance of the mixed phase should lead to an increase of the number of strange quarks and antiquarks due to the annihilation of light quark-antiquark and gluon pairs. Clearly, this simple picture is well fitted into the prediction that the mixed phase can be reached at GeV, while QGP is formed at GeV. The dramatic decrease of the slope of the experimental ratio at GeV which is seen in Fig. 4 can be an evidence for the second phase transformation, which we discussed above.
It is appropriate to say a few words about the experimental data of hadron yields shown in both panels of Fig. 4. For the AGS collision energies 2.7, 3.1, and 4.3 GeV the yields of protons and kaons were, respectively, taken from Refs. AGS8 and AGS_p2 , whereas for hyperons they were taken from Ref. AGS3 . Experimental yields measured at the highest AGS energy 4.9 GeV for protons and kaon were taken from Ref. AGS2 ; AGS8 , while for they were given in Ref. AGS7 . The mid-rapidity yields of protons, kaons and lambdas measured at the SPS energies 6.3, 7.6, 8.8, 12, and 17.3 GeV are provided by the NA49 collaboration in Refs. SPS2 ; SPS3 ; SPS5 ; SPS6 ; SPS7 . For a comparison, in Fig. 4 we also show the value with huge error bars which are found from other two ratios, and , for GeV.
It is interesting that the energy dependence of the ratio shows the change of slopes at the same energies as the ratio. This can be see from the right panel of Fig. 4. Note that in the dominant hadronic reactions the positive kaons and hyperons are born simultaneously. Since both of these hadrons carry the strange charge, then the logic of work Rafelski:82 is inapplicable to their ratio. Therefore, in contrast to an increase of the slope of the ratio on the interval GeV, the ratio has a flattening of the slope on this collision energy interval. In the leading order this ratio is defined via the kaon mass , the mass and two chemical potentials as . Therefore, a small slope of this ratio at the interval GeV evidences about the cancellation of energy dependencies of strange and baryonic chemical potentials, i.e. for GeV. An increase of the ratio at higher collision energies can be mainly explained by the fast decrease of the baryonic chemical potential.
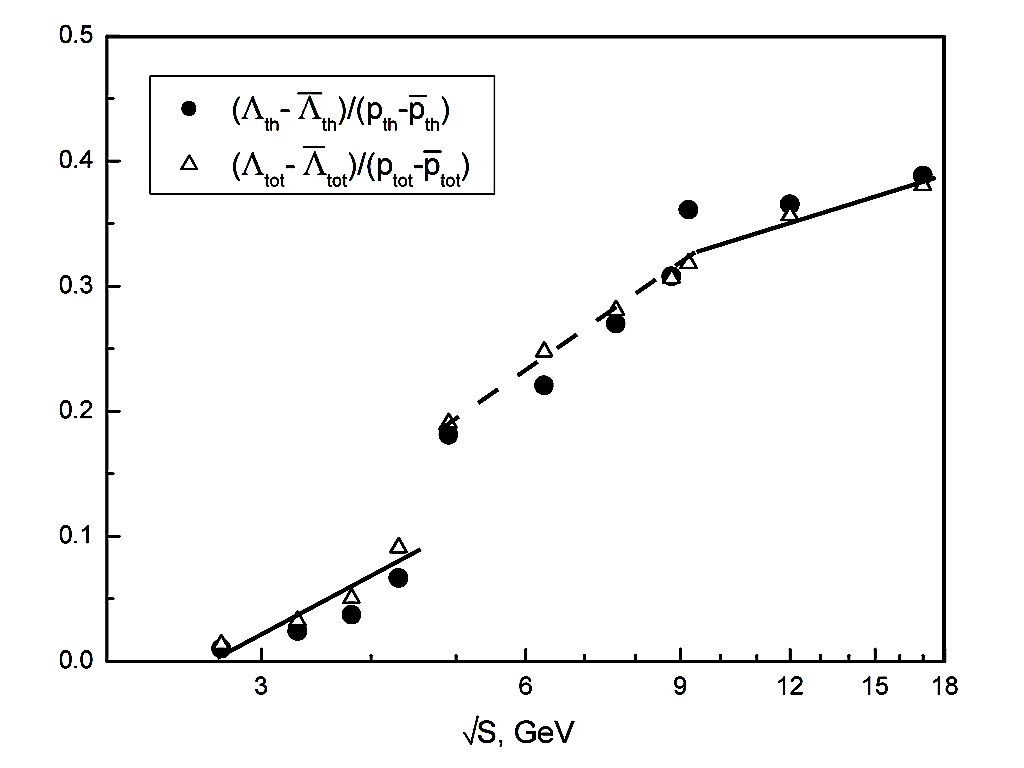
Very recently a better description of the ratio was achieved in Bugaev15a , when more data were analyzed. Note that this result was obtained not on the expense of worsening of other hadron yield ratios. Based on this new fit of hadron yield ratios the predictions for the ratio are made. As one can see from Fig. 5 this ratio demonstrates even more dramatic changes in the collision energy dependence. Indeed, at the narrow collision energy interval GeV this ratio has a strong jump, while at GeV it shows a change of slope. Our educated guess is that the collision energy dependence of the ratio is an indicator of two phase transformations Bugaev15a . Since the observed jump of this ratio is located in the collision energy region of the mixed phase formation (i.e. with a first order phase transition), then a change of its slope at GeV can be naturally associated with a weak first order or a second order phase transition. Note that such a hypothesis is well supported by the results of the meta-analysis Metaanalisys which is briefly summarized above.
4 Conclusions
From the discussions given in previous sections it is clear that a development of the multicomponent version of HRGM in 2012 led to a real breakthrough in our understanding of the thermodynamics at CFO. With the help of HRGM it was possible for the first time to describe the Strangeness Horn with the highest accuracy HRGM:13 ; SFO:13 ; Sagun2 including the topmost point. The new concept of separated CFOs for strange and non-strange hadrons with conservation laws connecting them allows one to naturally explain the appearance of apparent chemical non-equilibrium of strange particles SFO:13 . Furthermore, a thorough analysis of the entropy per baryon and the pion number (thermal and total) per baryon at CFO led to a finding out of two sets of strongly correlated quasi-plateaus Bugaev:SA1 ; Bugaev:SA2 . Since the low energy set of quasi-plateaus was predicted in KAB:89a ; KAB:90 ; KAB:91 as a signal of the quark-gluon-hadron mixed phase formation, then it was necessary to give a physical interpretation of the high energy set of quasi-plateaus.
A good hint to interpret the appearance of high energy set of quasi-plateaus is provided by the meta-analysis Metaanalisys of QDD. Since the QDD meta-analysis gave an independent evidence for the quark-gluon-hadron mixed phase formation at the narrow region of collision energy GeV, then its predictions for the possible existence of another mixed phase at collision energies GeV led us to a more thorough inspection of existing hadron multiplicity ratios. As one can see from the left panel of Fig. 4 the ratio exhibits three different regimes in the collision energy dependence: at GeV the slope of this ratio suddenly increases, while above GeV it nearly saturates. As we argued above a strong increase of slope at GeV can be naturally explained by the idea of work Rafelski:82 that the mixed phase formation can be identified by a rapid increase in the number of strange quarks per light quarks, while a dramatic decrease of the slope at GeV can be an evidence for the second phase transformation.
It is remarkable that the ratio shows the change of slopes at the same energies as the ratio, although the ratio involves two strange particles and (in general) it strongly depends on the baryonic chemical potential. Also the trace anomaly at CFO shows two peaks at the collision energies GeV and GeV. The low energy trace anomaly peak can be explained within the shock adiabat model Bugaev:SA2 as a signal of QGP formation, whereas the existence of high energy peak requires further confirmation by better experimental data. If it will be confirmed, then it will serve as a new indicator for a second phase transition. Nevertheless, already now all irregularities at CFO discussed here together with the results of the QDD meta-analysis form a coherent picture of possible observation of two mixed phases in nucleus-nucleus collisions. Therefore, the Beam Energy Scan program at RHIC has a unique chance to experimentally verify the above signals and to discover the mixed phases before the start of NICA and FAIR programs. The new observable, the ratio suggested in Bugaev15a , will be very helpful for this because of its high sensitivity. However, to reach such goals the RHIC experiments should provide much smaller error bars, especially at low energies. Hence, the experiments in a fixed target mode are absolutely necessary for the success of the Beam Energy Scan program at RHIC.
The authors are thankful to D. B. Blaschke, T. Galayuk, R. A. Lacey, I. N. Mishustin, D. H. Rischke, K. Redlich, L. M. Satarov, A.V. Taranenko, K. Urbanowski and Nu Xu for interesting discussions and valuable comments. K.A.B., A.I.I., V.V.S. and G.M.Z. acknowledge the partial support of the program “On perspective fundamental research in high-energy and nuclear physics” launched by the Section of Nuclear Physics of NAS of Ukraine. D.R.O. acknowledges a support of Deutsche Telekom Stiftung. K.A.B. is very thankful to all organizers of the ICNFP2015 for providing him with a chance to present and to discuss these results at the Conference and for a warm hospitality in OAC.
References
- (1) A. Andronic, P. Braun-Munzinger and J. Stachel, Nucl. Phys. A 772, 167 (2006) and references therein.
- (2) D.R. Oliinychenko, K.A. Bugaev and A.S. Sorin, Ukr. J. Phys. 58, 211 (2013).
- (3) K. A. Bugaev, D. R. Oliinychenko, A. S. Sorin, G. M. Zinovjev, Eur. Phys. J. A 49, 30 (2013).
- (4) K. A. Bugaev et al., Europhys. Lett. 104, 22002 (2013).
- (5) V. V. Sagun, Ukr. J Phys. 59, 755 (2014).
- (6) V. V. Sagun et al., Ukr. J. Phys. 59, 1043 (2014).
- (7) K. A. Bugaev et al., Phys. Part. Nucl. Lett. 12, 238 (2015).
- (8) K. A. Bugaev et al., arXiv:1412.0718 [nucl-th] and references therein.
- (9) K. A. Bugaev, M. I. Gorenstein, B. Kämpfer and V. I. Zhdanov, Phys. Rev. D 40, 2903 (1989).
- (10) K. A. Bugaev, M. I. Gorenstein and D. H. Rischke, JETP Lett. 52, 1121 (1990).
- (11) K. A. Bugaev, M. I. Gorenstein and D. H. Rischke, Phys. Lett. B 255, 18 (1991).
- (12) V. A. Kizka, V. S. Trubnikov, K. A. Bugaev and D. R. Oliinychenko, arXiv:1504.06483 [hep-ph].
- (13) J. Rafelski, Phys. Lett. B 62, 333 (1991).
- (14) S. Wheaton, J. Cleymans and M. Hauer, Comput. Phys. Commun. 180, 84 (2009).
- (15) J.L. Klay et al., Phys. Rev. C 68, 054905 (2003).
- (16) L. Ahle et al., Phys. Lett. B 476, 1 (2000).
- (17) L. Ahle et al., Phys. Lett. B 490, 53 (2000).
- (18) J.L. Klay et al., Phys. Rev. Lett. 88, 102301 (2002).
- (19) C. Pinkenburg et al.,Nucl. Phys. A 698, 495 (2002).
- (20) J. Barrette et al., Phys. Rev. C 62, 024901 (2000).
- (21) L. Ahle et al., Phys. Rev. C 60, 064901 (1999).
- (22) L. Ahle et al., Phys. Rev. C 58, 3523 (1998).
- (23) S. Albergo et al., Phys. Rev. Lett. 88, 062301 (2002).
- (24) B. B. Back et al., Phys. Rev. Lett. 87, 1970 (2001).
- (25) I. G. Bearden et al., Phys. Rev. C 66, 044907 (2002).
- (26) S. V. Afanasiev et al., Phys. Rev. C 66, 054902 (2002).
- (27) S. V. Afanasiev et al., Phys. Rev. C 69, 024902 (2004).
- (28) C. Alt et al., Phys. Lett. B 635, 270 (2006).
- (29) T. Anticic et al., Phys. Rev. Lett. 93, 022302 (2004).
- (30) S. V. Afanasiev et al., Phys. Lett. B 538, 275 (2002).
- (31) C. Alt et al., Phys. Rev. Lett. 94, 192301 (2005).
- (32) F. Antinori et al., Phys. Lett. B 595, 65 (2004).
- (33) F. Antinori et al.,J. Phys. G 31, 1345 (2005) .
- (34) J. Adams et al., Phys. Rev. Lett. 92, 112301 (2004).
- (35) Sz. Borsanyi et al., JHEP 1208, 053 (2012).
- (36) K. A. Bugaev et al., Ukr. J. Phys. 60, 181 (2015).
- (37) P. Koch, B. Müller and J. Rafelski, Phys. Rep. 142, 167 (1986) and references therein.
- (38) C. M. Hung and E. V. Shuryak, Phys. Rev. C 57, 1891 (1998) and references therein.
- (39) Y. Pang, T. J. Schlagel and S.H. Kahana, Phys. Rev. Lett. 68, 2743 (1992).
- (40) H. Sorge, Phys. Rev. C 52, 3291 (1995).
- (41) W. Ehehalt and W. Cassing, Nucl. Phys. A 602, 449 (1996).
- (42) W. Cassing and E. L. Bratkovskaya, Phys. Rep. 308, 65 (1999).
- (43) J. Geiss, W. Cassing and C. Greiner, Nucl. Phys. A 644, 107 (1998).
- (44) S. A. Bass et al., Prog. Part. Nucl. Phys. 41, 225 (1998).
- (45) F. Becattini, J. Manninen and M. Gazdzicki, Phys. Rev. C 73, 044905 (2006).
- (46) R. Longacre, preprint BNL-48648, C93-01-13.
- (47) S. E. Eiseman et al., Phys. Lett. B 297, 44 (1992).
- (48) L. X. Sun, R. Q. Wang, J. Song and F. L. Shao, Chin. Phys. C 36, 55 (2012).
- (49) Y. B. Ivanov, V. N. Russkikh and V. D. Toneev, Phys. Rev. C 73, 044904 (2006).
- (50) Yu. B. Ivanov and V. N. Russkikh, Phys. Rev. C 78, 064902 (2008).
- (51) Yu. B. Ivanov, Phys. Rev. C 87, (2013) 064905.
- (52) Yu. B. Ivanov, Phys. Rev. C 89, 024903 (2014).
- (53) W. Cassing and E. L. Bratkovskaya, Phys. Rev. C 78, 034919 (2008).
- (54) W. Cassing, Eur. Phys. J. ST 168, 3 (2009).
- (55) W. Cassing and E. L. Bratkovskaya, Nucl. Phys. A 831, 215 (2009).
- (56) P. Bozek, Acta Phys. Pol. B 36, 3071 (2005).
- (57) K. Werner, Phys. Rev. Lett. 98, 152301 (2007).
- (58) J. R. Taylor, An introduction to error analysis (University Science Book, Mill Valley, California, 1982).
- (59) A. Andronic et al., Nucl. Phys. A 837, 65 (2010).
- (60) J. Rafelski and B. Müller, Phys. Rev. Lett. 48, 1066 (1982).
- (61) K.A. Bugaev et. al., arXiv:1510.03099v1 [nucl-th] (2015).