Broadband X-ray Spectral Investigations of Magnetars, 4U 0142+61, 1E 1841-045, 1E 2259+586, and 1E 1048.1-5937
Abstract
We have generated an extended version of rather simplified but physically oriented three-dimensional magnetar emission model, STEMS3D, to allow spectral investigations up to 100 keV. We have then applied it to the broadband spectral spectra of four magnetars: 4U 0142+61, 1E 1841-045, 1E 2259+586 and 1E 1048.1-5937, using data collected with Swift/XRT or XMM-Newton in soft X-rays, and Nuclear Spectroscopic Telescope Array in the hard X-ray band. We found that the hard X-ray emission of 4U 0142+61 was spectrally hard compared to the earlier detections, indicating that the source was likely in a transition to or from a harder state. We find that the surface properties of the four magnetars are consistent with what we have obtained using only the soft X-ray data with STEMS3D, implying that our physically motivated magnetar emission model is a robust tool. Based on our broadband spectral investigations, we conclude that resonant scattering of the surface photons in the magnetosphere alone cannot account for the hard X-ray emission in magnetars; therefore, an additional non-thermal process, or a population of relativistic electrons is required. We also discuss the implication of the non-detection of persistent hard X-ray emission in 1E 1048.1-5937.
Subject headings:
radiation mechanisms: nonthermal — stars: magnetic fields — stars: neutron — X-rays: stars — pulsars: individual (4U 0142+61) — pulsars: individual (1E 1841-045) — pulsars: individual (1E 2259+586) — pulsars: individual (1E 1048.1-5937)1. Introduction
Two small populations of young, isolated neutron stars (NSs), anomalous X-ray pulsars (AXPs) and soft gamma-ray repeaters (SGRs) are considered to be ultra-magnetized objects, G, also known as magnetars, as is primarily indicated by their emission of energetic bursts and their high spin-down rates (Thompson & Duncan, 1995, 1996). To date, 28 magnetars or magnetar candidates have been identified in the Galaxy, LMC, and SMC (Olausen & Kaspi, 2014) 111Note that PSR J1846-0258 is usually referred to a rotation-powered pulsar, but it also exhibited a magnetar-like burst in 2006 (Gavriil et al., 2008). http://www.physics.mcgill.ca/$∼$pulsar/magnetar/main.html. Magnetars are luminous in the X-ray band with persistent luminosities, erg s-1, which are orders of magnitude higher than their rotation power for most sources. Soft X-ray spectra of magnetars below 10 keV are soft and can be empirically described by either the sum of two blackbody (BB) functions, or by the sum of a BB ( keV) and a power-law (PL) model with a photon index of (Mereghetti et al., 2015). In addition to their soft X-ray emission, some magnetars also persistently emit bright hard X-rays, detected with INTEGRAL, RXTE, (Kuiper et al., 2006; den Hartog et al., 2008a, b), SUZAKU, (Enoto et al., 2010), and recently with the Nuclear Spectroscopic Telescope Array (NuSTAR; see, e.g., Vogel et al., 2014; An et al., 2015). The hard X-ray spectra can be fit by a PL with typical photon indices of (see Rea & Esposito 2011, and Mereghetti et al. 2015 for recent reviews).
Unlike magnetospheres in ordinary radio pulsars, those of magnetars are expected to be highly twisted due to the deformation of the NS crust (Thompson et al., 2002). The twisted magnetospheres can support dense charge particles which further provide large optical depth () to resonant cyclotron scattering (RCS). In the magnetar framework, soft X-ray spectra are generally explained as the NS surface thermal emission Compton up-scattered by the plasma in the magnetosphere which form a PL tail (see e.g., Lyutikov & Gavriil, 2006; Fernández & Thompson, 2007; Tong et al., 2010). Both one-dimensional (1D) and three-dimensional (3D) RCS models had been proposed (see, e.g., Lyutikov & Gavriil, 2006; Fernández & Thompson, 2007; Nobili et al., 2008a), and applied to the observed spectra (Rea et al., 2008; Zane et al., 2009). However, the scattering process is insensitive to the surface magnetic field; therefore, one cannot deduce magnetospheric properties via modeling with the RCS process.
In addition to the RCS in twisted magnetospheres, the vacuum polarization and proton cyclotron resonances play key roles in the propagation of radiation through magnetar atmospheres, leaving signatures of surface magnetic fields in the continuum spectra of magnetars (Özel, 2001, 2003; Ho & Lai, 2003). Taking into account the combined effects of the magnetar atmosphere and reprocessing in the magnetosphere, Güver et al. (2007) developed the 1D surface thermal emission and magnetospheric scattering (STEMS) model, which offers acceptable fits to the soft X-ray spectra of numerous magnetars (Güver et al., 2007, 2008; Ng et al., 2011; Lin et al., 2012). Recently, we considered the same physical processes but calculated the synthetic spectra using a Monte Carlo technique (Weng et al. 2015, hereafter Paper I). The set of calculated spectra are further used to create a tabular model (STEMS3D) that can be accommodated by the X-ray fitting package XSPEC. Investigating a large sample of XMM-Newton spectra of magnetars, we found that the STEMS3D model yielded successful fits to nearly all of the spectra with a reduced less than 1.3. We concluded that the STEMS3D model provides a robust method to measure the surface magnetic field strength and the magnetospheric configuration, that is, the level of magnetospheric twist. The results of modeling the soft X-ray spectra of magnetars with STEMS3D showed that the magnetosphere in a magnetar is highly twisted, and at least in one case (1E 2259+586 in its 2002 outburst), we most likely observe an indication of the untwisting of a twisted magnetosphere.
At present, hard X-ray emission has been reported in about one-third of magnetars. There is still no clear evidence of the peak energy beyond which the hard X-ray emission would decline rapidly (den Hartog et al., 2008a, b). Nevertheless, there was an indirect indication of MeV for the spectral break energy (Şaşmaz Muş & Göğüş, 2010). Additionally, hard X-ray emission in transient sources exhibits time variations, as in the 2009 outburst of 1E 1547.0-5408 (Kuiper et al., 2012). Beloborodov (2013) attributed the hard X-ray emission to the interaction of surface emission with the relativistic particles surrounding magnetars, which also could make a non-negligible contribution to the emission below 10 keV. The observed non-relativistic nature of magnetospheric particles (electron velocity, ) as presented in Paper I places a constraint on the viability of such a mechanism. However, it is important to note the fact that electrons with mildly relativistic velocities, , could effectively scatter soft photons up to keV. It is therefore crucial to diagnose the scattering scenario using a broadband spectral modeling.
NuSTAR, the first focusing hard X-ray instrument (Harrison et al., 2013), executed a series observations of a small set of bright magnetars. Here, we employed NuSTAR observations of four magnetars: 4U 0142+61, 1E 1841-045, 1E 2259+586, and 1E 1048.1-5937, together with simultaneous or contemporaneous soft X-ray observations to perform broadband spectral analysis using the expanded STEMS3D model. In the next section, we briefly describe the STEMS3D model and the Monte-Carlo-based methodology used to extend its spectral coverage into hard X-rays. We present the results of broadband spectral investigations using the expanded STEMS3D in Section 3. We discuss the implications of these results and present our main conclusions in Section 4.
2. Three-dimensional surface thermal emission and magnetospheric scattering model
In this section, we provide a brief overview of the STEMS3D model as further details of the model were already presented in Paper I. The STEMS3D model envisions that the emergent radiation of magnetars is significantly affected by their atmospheres and twisted magnetospheres. The emission from the NS surface is expected to become distorted while propagating through the ionized, highly magnetized atmospheres by the absorption, emission, and scattering processes (Özel, 2003). In turn, proton cyclotron resonance gives rise to a line feature while the vacuum polarization weakens this line feature and also enhances the conversion between photons of different polarization modes (Özel, 2003). The spectral profile of the emerging surface emission is described by the surface temperature () and magnetic field (; see Figure 4 in Özel, 2003). These emerging photons would further interact with the charged particles in the magnetosphere by multiple resonant scattering, manifesting themselves as the high-energy tail (Güver et al., 2007; Nobili et al., 2008a; Rea et al., 2008).
The STEMS3D model has four model parameters: surface temperature , magnetic field strength at the pole , twist angle , and the electron velocity . Unlike the previous version of STEMS3D presented in Paper I, we now restricted the model parameter space of keV, and radian, as suggested by the soft X-ray spectral fitting (see Paper I). In these cases, a significant fraction of the seed photons are scattered up to the hard X-ray band with moderate optical depths (, Figure 3 in Paper I), which is a few orders larger than the tiny fraction contributed by the surface emission above 10–15 keV. Therefore, seed photons at energies above this level would not influence the emerging spectrum, hence, they can safely be discarded. We calculated more than 7000 model spectra in the 0.1-100 keV range, above which the electron recoil effect becomes important (Nobili et al., 2008b). The parameter ranges for the current version of STEMS3D are keV (with a step of 0.1 keV), G (with a step G), radian (with a step of 0.1 radians), and = 0.1-0.9 (with a step of 0.1).
In the STEMS3D model, the current density and the optical depth are self-consistently derived from the and the . Consequently, the Compton up-scattering efficiency, and therefore, the spectral profile, is sensitive to these two parameters. We plot the STEMS3D spectra in Figure 1 to illustrate the effects of and the . As can be seen, the proton cyclotron lines are weakened by multiple scatterings in the twisted magnetosphere, and the hard X-ray flux level increases with as well as . When a magnetosphere becomes optically thick, a larger fraction of seed photons is scattered to the energy around the electron energy, forming a second hump. Thus, the photon density beyond the electron energy looks suppressed in the normalized spectra with a larger optical depth (, see also Figure 5 in Nobili et al. 2008a). Such a trend in evolution is shown in other RCS models as well, e.g., 1D RCS (Figure 1 in Rea et al., 2008).


3. Observations, Data Analysis & Results
NuSTAR consists of two focusing instruments and two focal plane modules, called Focal Plane Modules A and B (hereafter FPMA and FPMB). The instruments are sensitive to photon energies in the range of 3–79 keV. Soft X-ray telescopes (3–10 keV) are useful for cross calibration. NuSTAR is currently the most sensitive detector in the 10–79 keV range due to its unique focusing ability; thus, it can acquire high-quality data from magnetars within a relatively short exposure time. To date, NuSTAR has observed five magnetars: 4U 0142+61 (Tendulkar et al., 2015), 1E 1841-045 (An et al., 2015), 1E 2259+586 (Vogel et al., 2014), 1E 1048.1-5937 (An et al., 2014), and the Galactic Center magnetar SGR 1745–2900 (Mori et al., 2013; Kaspi et al., 2014). There have also been simultaneous or contemporaneous pointed X-ray observations of these sources with Swift/XRT or XMM-Newton. In our investigations, we used the NuSTAR data of four magnetars and contemporaneous X-ray observations for broadband spectral analysis (see Table 1). We excluded the Galactic Center magnetar from our sample due to the very high interstellar absorption in its galactic vicinity.
We processed NuSTAR and Swift with HEAsoft version 6.16. In particular, NuSTAR (Harrison et al., 2013) data were processed with nupipeline and CALDB version 20141107 using standard quality thresholds. The source spectra were extracted from a circular region () with the task nuproducts and the resulting spectra were grouped to have at least 50 counts per spectral bin. In each pointing, we chose a source-free region to extract the background spectrum, except for 1E 1841-045 (see below). For Swift XRT (Gehrels et al., 2004) data, the initial event cleaning was performed with the task xrtpipeline using standard filters. To ensure reliable results using statistical analysis, the spectra were grouped to have at least 30 counts per spectral bin. For XMM-Newton observations, the data collected with EPIC instruments (Strüder et al., 2001) were reduced using the Science Analysis System (SAS) software version 12.0.1, and filtered with standard criteria. We provide further source specific processing details below. All of the spectra were then fitted with XSPEC 12.8.2 (Arnaud, 1996). We assume a gravitational redshift correctionof 0.306 for the emergent emission, corresponding to an NS with mass 1.4 and km, and we adopt the solar abundances by Lodders (2003).
| Source | Observatory/ | ObsID | Obs Date | Mode | Net Exposure | Energy Band |
|---|---|---|---|---|---|---|
| Instrument | (ks) | (keV) | ||||
| 4U 0142+61 | Swift | 00080026001 | 2014 Mar 27 | WT | 5 | 1-10 |
| … | Swift | 00080026002 | 2014 Mar 28 | WT | 13 | 1-10 |
| … | Swift | 00080026003 | 2014 Mar 28 | WT | 7 | 1-10 |
| … | NuSTAR | 30001023002 | 2014 Mar 27 | Science | 24 | 3-79 |
| … | NuSTAR | 30001023003 | 2014 Mar 28 | Science | 144 | 3-79 |
| 1E 1841-045 | pn | 0013340101 | 2002 Oct 05 | LW | 2 | 1-10 |
| … | pn | 0013340201 | 2002 Oct 07 | LW | 4 | 1-10 |
| … | NuSTAR | 30001025012 | 2013 Sep 21 | Science | 101 | 3-79 |
| 1E 2259+586 | Swift | 00080292002 | 2013 Apr 25 | PC | 13 | 0.5-10 |
| … | Swift | 00080292003 | 2013 Apr 26 | PC | 14 | 0.5-10 |
| … | Swift | 00080292004 | 2013 Apr 28 | PC | 14 | 0.5-10 |
| … | NuSTAR | 30001026002 | 2013 Apr 24 | Science | 37 | 4-79 |
| … | NuSTAR | 30001026003 | 2013 Apr 25 | Science | 15 | 4-79 |
| … | NuSTAR | 30001026005 | 2013 Apr 26 | Science | 16 | 4-79 |
| … | NuSTAR | 30001026007 | 2013 May 16 | Science | 88 | 4-79 |
| 1E 1048.1-5937 | pn/MOS1/MOS2 | 0723330101 | 2013 Jul 22 | FF/SW/SW | 53/72/71 | 0.5-10 |
| … | NuSTAR | 30001024002 | 2013 Jul 17 | Science | 25 | 3-12 |
| … | NuSTAR | 30001024003 | 2013 Jul 17 | Science | 22 | 3-12 |
| … | NuSTAR | 30001024005 | 2013 Jul 19 | Science | 153 | 3-12 |
| … | NuSTAR | 30001024007 | 2013 Jul 25 | Science | 104 | 3-12 |
Note. — Net exposure: clean exposure after background flares and short bursts excluded. Mode: operating mode including Windowed Timing (WT), Photon Counting (PC), Full Frame Window (FF), Large Window (LW), and Small Window (SW).
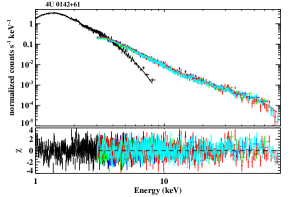
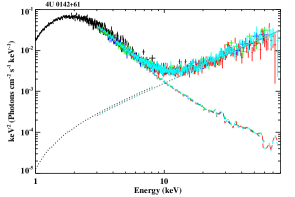
4U 0142+61 is the brightest AXP and its X-ray emission is quite steady in both the hard and soft X-ray bands. There were two NuSTAR and three Swift observations executed at the end of 2014 March. Swift XRT observations were performed in Windowed Timing (WT) mode to avoid pile up. We extracted both the source and background signals from 50-pixel long strips. Since there were the model-independent residuals were exhibited below 1 keV, we fit the Swift spectrum in the range of 1–10 keV together with NuSTAR spectra in the 3-79 keV range. In this paper, we fit all of the available spectra for each source simultaneously by linking model parameters together so that they can converge to common values while allowing model normalizations to vary. We also included a multiplicative constant for each model component to account for cross-normalization issues, which were fixed to unity for data collected with the soft X-ray missions, and allowed to vary for FPMA and FPMB. In all of the cases, we find that the cross-normalization factors are not far from unity, ranging between 0.88 and 1.12. We find that the broadband X-ray spectrum of 4U 0142+61 is very well described by the STEMS3D + PL model (/dof = 1290.3/1235), yielding a magnetospheric twist angle of 1.7 rad and magnetospheric electron velocity of 0.21 , which are in agreement with what we obtained using XMM-Newton observations only (Paper I). In the top row of Figure 2, we present combined 4U 0142+61 data sets together with best-fit model curves and fit residuals, as well as spectral decomposition of each model component. The hard X-ray component represented by a PL has an index of which is flatter than what is observed with INTEGRAL (den Hartog et al. 2008a, but see Wang et al. 2014).
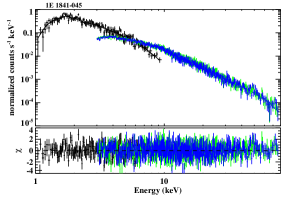
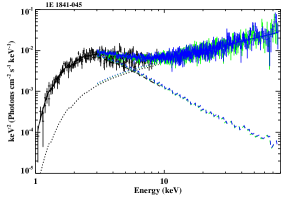
1E 1841-045, located at the center of supernova remnant (SNR) Kes 73 (Vasisht & Gotthelf, 1997), is another steady X-ray emitter. The source was monitored with NuSTAR between 2013 September 5 and 21, during which time six bursts were detected (An et al., 2015). In order to eliminate the contamination from the SNR, an annulus region with inner and outer radii of 60″and 100″around the source position was selected for background spectral extraction, as was also done in An et al. (2013). We searched for soft X-ray data from 2013 August 1 to 2013 October 30, and identified 11 Swift XRT observations, 10 executed in WT mode and 1 short observation in Photon Counting (PC) mode. Note that in WT mode, 10 rows are compressed into a single row, only the central 200 columns are read, and only 1D imaging is preserved. consequently, it is impossible to resolve the SNR contribution and three SNR related emission lines (Mg, Si, and S) clearly appear in the stacked spectrum of 10 WT data. Since the source emission has been stable for more than 15 years (Dib & Kaspi, 2014), we performed the joint fit with the longest, and burst-free NuSTAR observations (ObsID = 30001025012) and XMM-Newton observations that were performed years earlier. For the XMM-Newton observation, since the MOS1/MOS2 data were performed in the full frame mode and were seriously affected by pile up, we only use the pn data in the following spectral fitting. The joint spectra are fit by our model (STEMS3D+PL) and a 2% systematic error is added to the XMM-Newton data to account for calibration uncertainties. The fit results yielded that 1E 1841-045 has the lowest twist angle () and the highest electron velocities in the magnetosphere () among the four sources studied here. The resulting photon index of the PL component () is consistent with the value reported based on INTEGRAL data (Kuiper et al., 2006). However, due to the short exposure of XMM-Newton data, in addition to the high interstellar absorption, the parameter values have large uncertainties (see Table 2 and Figure 2). Note that 1E 1841-045 is the only source whose non-thermal component ( erg s-1 cm-2) dominates the STEMS3D component ( erg s-1 cm-2) in the range of 1–79 keV.
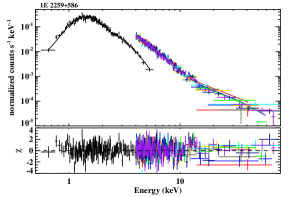
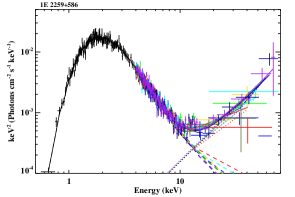
1E 2259+586 is considered to be the AXP prototype and its soft X-ray spectrum is typical of AXPs, empirically described by a BB and a PL components (Gavriil et al., 2004). Fitting the XMM-Newton spectra collected during its 2002 outburst with the STEMS3D model, we found that an increased twist angle was coincident with the outburst and then decreased subsequently during the outburst decay, which agrees perfectly with the twisting/untwisting magnetosphere scenario (Paper I). Persistent emission above 10 keV had been detected in 1E 2259+586 with RXTE (Kuiper et al., 2006), and pulsations above 20 keV were first revealed in NuSTAR data (Vogel et al., 2014). Here, we analyzed all four NuSTAR observations. 1E 2259+586 is located near the center of the SNR CTB 109, which has a half-shell morphology (Gregory & Fahlman, 1980). Investigating a Chandra data, Sasaki et al. (2004) pointed out that no emission above 4 keV was emitted by CTB 109. Thus, we only use the NuSTAR spectra above 4 keV to minimize the contamination from the SNR. Swift XRT observations were performed in PC mode, and its angular resolution is good enough to resolve the SNR. Because of the fact that XRT data were suffered from the pile-up effect, we extracted source spectra within an annular region centered on the source position (R.A. = 23:01:08.1, decl. = +58:52:44.5, J2000) with the inner radius of 5 pixels and create ARF files to correct for the loss of counts caused by annular exclusion. The fitted parameters of the STEMS3D model are B G, , and . In contract to 1E 1841-045, the broadband NuSTAR spectra of 1E 2259+586 yield a very hard () but weak hard X-ray component, contributing a fraction of of total X-ray emission.
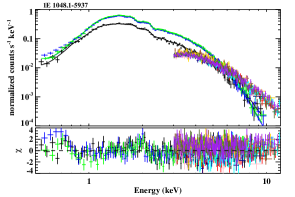
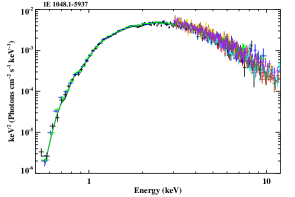
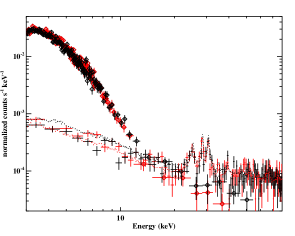
The AXP 1E 1048.1-5937 displays bright and variable soft X-ray emission, but its hard X-ray radiation was only observed during short bursts. Recently, An et al. (2014) reported the detection of eight bursts during the 2013 July observation campaign with the NuSTAR. After removing the times of the burst intervals, we do not detect any significant emission above 15 keV (Figure 3) and the persistent emission below 15 keV remains constant during different observations. For the simultaneous XMM-Newton observation (ObsID=0723330101, on July 22), the pn data were executed in the full-frame mode and suffered from the pile up, while the MOS1 and MOS2 data were taken in the small window mode and thus avoided the pile up. After correcting the pile-up effect for the pn data, we performed simultaneous fit with the NuSTAR observations and XMM-Newton observation performed in 2013 July. Fitting the joint spectra in the range of 0.5–15 keV yields unacceptable results due to the fact that (1) the PL component converges to a very steep index () and dominates the softer component while the STEMS3D contributes most hard X-ray emissions, (2) hits the hard upper limit (0.5 keV), and (3) the obtained column density ( cm-2) is significantly higher than the value ( cm-2) derived from the single STEMS3D model. By fitting the NuSTAR+XMM-Newton spectra below 12 keV with the STEMS3D model only, we obtain model parameters (Table 2) that are consistent with what have been obtained from XMM-Newton spectrum modeled in 0.5–7 keV, as presented in Paper I.
| Source | nH | /dof | |||||||
|---|---|---|---|---|---|---|---|---|---|
| ( cm-2) | (keV) | ( G) | (rad) | ||||||
| 4U 0142+61 | 18.6 | 3.8 | 1290.3/1235 | ||||||
| 1E 1841-045 | 3.6 | 5.1 | 1183.1/1162 | ||||||
| 1E 2259+586 | 5.0 | 0.58 | 567.6/548 | ||||||
| 1E 1048.1-5937 | 1.4 | 1370.0/995 |
Note. — : unabsorbed flux of the STEMS3D component in 1–79 keV in units of 10-11 erg s-1 cm-2 with cross-normalization factors taken into account. : unabsorbed flux of the PL component in 1–79 keV in units of 10-11 erg s-1 cm-2. All errors are in the 90% confidence level. : Spectra are fit with a single STEMS3D component.
4. Discussion and Conclusions
In the framework of the magnetar model, bright X-ray emission is expected to be primarily fed by a magnetic energy budget through various channels (e.g., Thompson et al., 2002; Lyutikov & Gavriil, 2006; Viganò et al., 2013). Therefore, studying broadband observations of magnetars should offer essential information about their radiation mechanisms. However, there is still a shortage of physically oriented magnetar emission models covering both soft and hard X-rays. As a part of our ongoing effort to build a physically motivated 3D magnetar emission model, STEMS3D, we extended the model to accommodate spectral investigations up to 100 keV. We obtain a perfect fit for all of the applied spectra with the STEMS3D model appended with a PL component (Table 2). The model parameters of STEMS3D are in agreement with our previous investigations of soft X-ray spectra only (Paper I). (1) The magnetic field strengths obtained using different data sets are almost the same, implying that the application of the STEMS3D model is indeed robust. The magnetic field of 1E 2259+586 obtained here ( G) is about one order of magnitude larger than the spin-down inferred value, likely because the assumption of a fixed angle between the rotation axis and dipole moment in the framework of magnetic dipole radiation may not be valid in this source. (2) The magnetospheres in these four sources are strongly twisted (). (3) The electron velocity is non-relativistic (). Practically, this means that soft X-ray photons from the NS surface cannot act as the seed for the entire hard X-ray emission, and an additional non-thermal process has to account for the bright hard X-ray radiation of 4U 0142+61, 1E 1841-045, and 1E 2259+586.
The hard X-ray component in magnetars is widely considered to be generated in the magnetosphere (e.g., Baring & Harding, 2007; Beloborodov & Thompson, 2007). Recently, Beloborodov (2013) proposed a relativistic outflow model for the hard X-ray emission and predicted that an averaged photon index of 1.5 for the hard X-ray spectrum. However, the observed spectra are always harder than the predicted value, especially for 4U 0142+61 and 1E 2259+586, which could be due to the effect of the object inclination to the line of sight. Currently, this model provides satisfactory fits to the phase-averaged and phase-resolved hard X-ray emission (An et al., 2013; Hascoët et al., 2014; Vogel et al., 2014; Tendulkar et al., 2015). On the other hand, the soft X-ray spectra of 4U 0142+61, 1E 1841-045, and 1E 2259+586 can be best fit by a Comptonized BB model or by the superposition of a hotter modified BB and a cool BB. Beloborodov (2013) argued that the fitted modified BB corresponding to a hot spot on the NS surface can be interpreted as the footprint of outflows having either a polar-cap or a ring shape (e.g., Vogel et al., 2014). It is important to note that this model does not self-consistently calculate the surface temperature, and only offers phenomenological fits rather than physical fits. Alternatively, the flux relaxation of the outbursts accompanied by decreasing NS surface temperature exhibited in some transient magnetars could be interpreted as the evidence of the crustal cooling (see e.g., Güver et al., 2007; Scholz et al., 2014). By analyzing the multiple observations of variable magnetars, we suggested that outbursts in SGRs/AXPs could also be driven by different mechanisms (Paper I).
Our spectral investigations reveal that the STEMS3D (soft band) and the PL (hard band) components have the comparable flux measurements in the 5–15 keV energy range (Figure 2). We also find that the fluence of the hard spectral component starts to dominate the soft component at 10.1, 5.7, and 13.3 keV for 4U 0142+61, 1E 1841-045, and 1E 2259+586, respectively. The NuSTAR spectra of 4U 0142+61, 1E 1841-045, and 1E 2259+586 above 15 keV are represented by a PL model of the photon indices , , and , respectively. Although, for three sources only, we find an anti-correlation between the photon index and the flux domination energy, as may be naturally expected from a PL dependence.
The PL component of 4U 0142+61 obtained from NuSTAR is harder than those measured from INTEGRAL ( den Hartog et al., 2008b) and SUZAKU ( Enoto et al., 2011). Investigating INTEGRAL data spanning 2003–2011, Wang et al. (2014) reported the variation of the hard X-ray spectral shape. The hard X-ray component can be fit with a simple PL model and the photon index changes from 0.7 to 1.6; meanwhile, a cutoff PL model provides even better fits to the data with the photon index varying between 0.3 and 1.5 and the cutoff energy in the range keV. It is suggestive that this source is mostly in a hard X-ray spectral state of and makes intermittent transitions to a spectrally harder state, and NuSTAR observations were likely performed during the spectral transition.
Investigating Suzaku data for nine magnetars, Enoto et al. (2010) found a tight anti-correlation between the characteristic age inferred from spin-down rates and the hardness ratio (i.e., the flux ratio of hard to soft spectrum component in 1–60 keV). In other words, the hard X-ray component decreases with NS age. We calculate the 1–79 fluxes of the STEMS3D and PL components (Table 2), and find that the data for 4U 0142+61, 1E 1841-045, and 1E 2259+586 are in agreement with this relation. Surprisingly, there is no significant hard X-ray emission observed in 1E 1048.1-5937, which is the youngest in characteristic age ( kyr) among these four sources. If we assume that 1E 1048.1-5937 would have the same spectral hardness as 1E 1841-045 (with a characteristic age of kyr), then we would expect a flux level of erg s-1 cm-2 in 10–79 keV, which is well above the NuSTAR detection limit, indicating different spectral hardness values in these two sources. Note that the background components of NuSTAR observations vary from detector to detector, and it might be inappropriate to extract background emission from any arbitrary source-free region in the field of view (Wik et al., 2014). Generally, the choice of background does not affect the analysis of the bright source (e.g., 1E 2259+586, Vogel et al., 2014). In order to check any influence from background selection, we also generated the background spectra using the tool nuskybgd developed by Wik et al. (2014), and obtained nearly identical modeling results. As an example, we plot the source as well as the background spectra extracted from both the canonical analysis procedure and the background model nuskybgd for the longest observation (ObsID = 30001024005) 222https://github.com/NuSTAR/nustar-idl/tree/master/nuskybgd in Figure 3. The background spectra produced in different ways marginally deviate from each other at soft X-rays (15 keV) where the source emission dominates the background. Beyond 20 keV, the background spectra are consistent with each other, which is a significant fraction of the source photons. The non-detection of persistent hard X-ray emission suggests that the additional mechanism responsible for the hard X-ray emission is not functioning efficiently in 1E 1048.1-5937, as it does in other persistent sources.
References
- An et al. (2015) An, H., Archibald, R. F., Hascoët, R., et al. 2015, ApJ, 807, 93
- An et al. (2013) An, H., Hascoët, R., Kaspi, V. M., et al. 2013, ApJ, 779, 163
- An et al. (2014) An, H., Kaspi, V. K., Beloborodov, A. M., et al. 2014, ApJ, 790, 60
- Arnaud (1996) Arnaud, K. A. 1996, in ASP Conf. Ser. 101, Astronomical Data Analysis Software and Systems V, ed. G. Jacoby & J. Barnes (San Francisco: ASP), 17
- Baring & Harding (2007) Baring M. G., & Harding A. K., 2007, Ap&SS, 308, 109
- Beloborodov (2013) Beloborodov, A. M. 2013, ApJ, 762, 13
- Beloborodov & Thompson (2007) Beloborodov, A. M., & Thompson, C. 2007, ApJ, 657, 967
- den Hartog et al. (2008a) den Hartog, P. R., Kuiper, L., Hermsen, W., et al. 2008a, A&A, 489, 245
- den Hartog et al. (2008b) den Hartog P. R., Kuiper L., Hermsen W., 2008b, A&A, 489, 263
- Dib & Kaspi (2014) Dib, R., & Kaspi, V. M. 2014, ApJ, 784, 37
- Enoto et al. (2011) Enoto, T., Makishima, K., Nakazawa, K., et al. 2011, PASJ, 63, 387
- Enoto et al. (2010) Enoto, T., Nakazawa, K., Makishima, K., et al. 2010, ApJL, 722, L162
- Fernández & Thompson (2007) Fernández, R., & Thompson, C., 2007, ApJ, 660, 615
- Gehrels et al. (2004) Gehrels, N., Chincarini, G., Giommi, P., et al. 2004, ApJ, 611, 1005
- Gregory & Fahlman (1980) Gregory, P. C., & Fahlman, G. G. 1980, Nature, 287, 805
- Gavriil et al. (2008) Gavriil, F. P., Gonzalez, M. E., Gotthelf, E. V., et al. 2008, Science, 319, 1802
- Gavriil et al. (2004) Gavriil, F. P., Kaspi, V. M. & Woods, P. M. 2004, ApJ, 607, 959
- Güver et al. (2008) Güver, T., Özel, F., & Göğüş, E. 2008, ApJ, 675, 1499
- Güver et al. (2007) Güver, T., Özel, F., Göğüş, E., & Kouveliotou, C. 2007, ApJL, 667, L73
- Ho & Lai (2003) Ho, W. C. G., & Lai, D. 2003, MNRAS, 338, 233
- Harrison et al. (2013) Harrison, F. A., Craig, W. W., Christensen, F. E., et al. 2013, ApJ, 770, 103
- Hascoët et al. (2014) Hascoët, R., Beloborodov, A. M., & den Hartog, P. R. 2014, ApJL, 786, L1
- Kaspi et al. (2014) Kaspi, V. M., Archibald, R. F., Bhalerao, V. et al. 2014, ApJ, 786, 84
- Kuiper et al. (2006) Kuiper, L., Hermsen, W., den Hartog, P. R., & Collmar, W. 2006, ApJ, 645, 556
- Kuiper et al. (2012) Kuiper, L., Hermsen, W., den Hartog, P. R., & Urama, J. O., 2012, ApJ, 748, 133
- Lin et al. (2012) Lin, L., Göğüş, E., Güver, T., & Kouveliotou, C. 2012, ApJ, 761, 132
- Lodders (2003) Lodders, K. 2003, ApJ, 591, 1220
- Lyutikov & Gavriil (2006) Lyutikov, M., & Gavriil, F. P. 2006, MNRAS, 368, 690
- Mereghetti et al. (2015) Mereghetti, S., Pons, J. A., & Melatos, A., 2015, SSRv, 191, 315
- Mori et al. (2013) Mori, K., Gotthelf, E. V., Zhang, S., et al. 2013, ApJL, 770, L23
- Ng et al. (2011) Ng, C.-Y., Kaspi, V. M., Dib, R., et al. 2011, ApJ, 729, 131
- Nobili et al. (2008a) Nobili, L., Turolla, R., & Zane, S. 2008a, MNRAS, 386, 1527
- Nobili et al. (2008b) Nobili, L., Turolla, R., & Zane, S. 2008b, MNRAS, 389, 989
- Olausen & Kaspi (2014) Olausen, S. A., & Kaspi, V. M. 2014, ApJS, 212, 6
- Özel (2001) Özel, F. 2001, ApJ, 563, 276
- Özel (2003) Özel, F. 2003, ApJ, 583, 402
- Rea & Esposito (2011) Rea, N., & Esposito, P. 2011, in High-Energy Emission from Pulsars and Their Systems, ed. D. F. Torres & N. Rea (Berlin: Springer), 247
- Rea et al. (2008) Rea, N., Zane, S., Turolla, R., Lyutikov, M., Götz, D., 2008, ApJ, 686, 1245
- Sasaki et al. (2004) Sasaki, M., Plucinsky, P. P., Gaetz, T. J., et al. 2004, ApJ, 617, 322
- Scholz et al. (2014) Scholz, P., Kaspi, V. M., & Cumming, A. 2014, ApJ, 786, 62
- Şaşmaz Muş & Göğüş (2010) Şaşmaz Muş S., & Göğüş E., 2010, ApJ, 723, 100
- Strüder et al. (2001) Strüder, L., Briel, U., Dennerl, K., et al. 2001, A&A, 365, L18
- Tendulkar et al. (2015) Tendulkar S. P., Hascoët, R., Yang, C., 2015, ApJ, 808, 32
- Thompson & Duncan (1995) Thompson, C., & Duncan, R. C. 1995, MNRAS, 275, 255
- Thompson & Duncan (1996) Thompson, C., & Duncan, R. C. 1996, ApJ, 473, 322
- Thompson et al. (2002) Thompson, C., Lyutikov, M., Kulkarni, S.R., 2002, ApJ, 574, 332
- Tong et al. (2010) Tong, H., Xu, R. X., Peng, Q. H., & Song, L. M. 2010, RAA, 10, 553
- Vasisht & Gotthelf (1997) Vasisht, G., & Gotthelf, E. V. 1997, ApJL, 486, L129
- Viganò et al. (2013) Viganò, D., Rea, N., Pons, J. A., et al. 2013, MNRAS, 434, 123
- Vogel et al. (2014) Vogel, J. K., Hascoët, R., Kaspi, V. M., et al. 2014, ApJ, 789, 75
- Wang et al. (2014) Wang, W., Tong, H., & Guo, Y.J. 2014, RAA, 14, 673
- Wik et al. (2014) Wik, D. R., et al., 2014, ApJ, 792, 48
- Weng et al. (2015) Weng, S.-S., Göğüş, E., Güver, T., & Lin, L. 2015, ApJ, 805, 81 (Paper I)
- Zane et al. (2009) Zane, S., Rea, N., Turolla, R., & Nobili, L. 2009, MNRAS, 398, 1403