Universal avalanche exponents in plasticity of amorphous materials
Abstract
Plastic yield of amorphous solids occurs by power law distributed slip avalanches whose universality is still debated. Determination of the power law exponents from experiments and molecular dynamics simulations is hampered by limited statistical sampling. On the other hand, while existing elasto-plastic depinning models give precise exponent values, these models to date have been limited to a scalar approximation of plasticity which is difficult to reconcile with the statistical isotropy of amorphous materials. Here we introduce for the first time a fully tensorial mesoscale model for the elasto-plasticity of disordered media that can not only reproduce a wide variety of shear band patterns observed experimentally for different deformation modes, but also captures the avalanche dynamics of plastic flow in disordered materials. Slip avalanches are characterized by universal distributions which are quantitatively different from mean field predictions, both regarding the exponents and regarding the form of the scaling functions, and which are independent of system dimensionality (2D vs 3D), boundary and loading conditions, and uni-or biaxiality of the stress state. We also measure average avalanche shapes, which are equally universal and inconsistent with mean field predictions. Our results provide strong evidence that the universality class of plastic yield in amorphous materials is distinct from that of mean field depinning.
Introduction
Plasticity of both crystalline and amorphous materials is interesting from the point of view of statistical mechanics of complex systems because, during irreversible deformation under load, solids exhibit a rich variety of collective phenomena including spontaneous strain localization, intermittent dynamics and power-law distributed avalanches. This phenomenology overlaps with that seen in systems as diverse as ferromagnets exhibiting Barkhausen noise Durin and Zapperi (2006) and crack propagation Bonamy et al. (2008); Laurson et al. (2010, 2013), and a unified conceptual model for these problems is desirable. While there is consensus that plastic deformation in amorphous materials occurs via local reorganizations Argon and Kuo (1979); Argon and Shi (1983); Falk and Langer (1998); Albaret et al. (2016), how these behave collectively is a topic that continues to receive considerable experimental and theoretical attention Baret et al. (2002); Picard et al. (2002, 2005); Jagla (2007); Shan et al. (2008); Dahmen et al. (2009); Wang et al. (2009); Homer et al. (2010); Sun et al. (2010); Sun and Wang (2011); Martens et al. (2011); Talamali et al. (2011, 2012); Sun et al. (2012); Budrikis and Zapperi (2013); Salerno and Robbins (2013); Nicolas et al. (2014); Lin et al. (2014a, b); Antonaglia et al. (2014a, b); Liu et al. (2016).
A key point of debate concerns the universality class of the plastic yield transition. As the external drive reaches a critical value the system undergoes a non-equilibrium phase transition into a flowing phase. The essential physics of this transition is captured by depinning-like models in which plastic deformation with fluctuating local yield thresholds is mapped to the motion of an interface through a disordered medium Talamali et al. (2011); Budrikis and Zapperi (2013); Lin et al. (2014b, 2015); Sandfeld et al. (2015); Liu et al. (2016). Mean-field depinning models provide predictions for critical exponents which have been tested in atomistic Salerno and Robbins (2013); Liu et al. (2016) or mesoscale simulations Baret et al. (2002); Picard et al. (2002, 2005); Talamali et al. (2011); Budrikis and Zapperi (2013); Lin et al. (2014b, 2015); Liu et al. (2016); Sandfeld et al. (2015) and in experiments Wang et al. (2009); Sun et al. (2010); Antonaglia et al. (2014a, b), but results remain inconclusive. For example, reported values of the avalanche size exponent range from to , often with large error bars. Faced with such data, different groups have interpreted the results as either consistent with the mean-field exponent of Antonaglia et al. (2014a, b) or not Talamali et al. (2011); Budrikis and Zapperi (2013); Lin et al. (2014b, 2015); Sandfeld et al. (2015), and controversy continues.
Many molecular dynamics and experimental studies face limitations in terms of accessible system size and strain rate range. Often, studies are limited to a narrow range of avalanche sizes for such technical reasons, with scaling regimes spanning a single decade only, making accurate determination of exponents difficult if not impossible. Furthermore, as has been demonstrated recently Liu et al. (2016), it is essential to ensure applied strain rates are slow enough to be truly adiabatic in order to avoid exponent drift.
While these problems can be overcome by lattice based mesoscale models, existing mesoscale models often treat the plastic strain as a scalar variable — effectively assuming that shear occurs in a single direction only Baret et al. (2002); Picard et al. (2002, 2005); Talamali et al. (2011); Martens et al. (2012); Budrikis and Zapperi (2013); Nicolas et al. (2014); Lin et al. (2014b, 2015); Sandfeld et al. (2015). This assumption which is inherent in all scalar models sits very uneasily with the statistically isotropic nature of amorphous solids and makes such models appear more suited to single-slip crystal plasticity Zaiser and Moretti (2005). In case of finite samples subject to general loads, the assumption of a scalar strain occurring in response to a scalar load is quite obviously at variance with the tensor nature of stress and strain in continuum mechanics. This assumption makes it in principle impossible to model general deformation processes where stress is heterogeneous and multi-axial. Even if the applied stress is acting along a single stress axis, the models predict spontaneous strain localization and spatially fluctuating plastic strain fields, which implies that to ensure compatibility of deformation the stress field must locally be always multi-axial (see e.g. Sandfeld and Zaiser (2014)). So one may legitimately ask what is the relevance of predictions derived from scalar models to real-world plasticity.
Tensorial plasticity models have been regularly used in the context of amorphous materials (see e.g. Bulatov and Argon (1994); Anand and Su (2005); Su and Anand (2006); Yang et al. (2006); Homer and Schuh (2009)). However, these models – even where they are parameterized based upon microscale simulations Schuh and Lund (2003); Homer and Schuh (2009) and consider statistical flow rules Bulatov and Argon (1994); Homer and Schuh (2009) – tend to assume spatially homogeneous constitutive equations which do not fully reflect the stochastic heterogeneity of plastic deformation properties on the smallest scales. As a consequence, while such models are able to predict complex deformation states on the macroscale, they are not capable of adequately capturing the avalanche dynamics of plastic deformation. We are thus facing a conundrum: On the one hand we have (over-)simplified statistical physics models of avalanche dynamics which because of their scalar nature cannot capture real-world deformation processes, on the other hand we have continuum mechanics models which because of their homogeneous and/or deterministic nature cannot capture avalanche dynamics of plastic flow. As avalanche phenomena are assumed to play a key role in the early stage of shear band formation, which in turn controls the macroscopic deformation behavior of many amorphous materials, this deficiency may prevent a comprehensive theoretical understanding of amorphous plasticity.
In the present paper we address this fundamental issue by formulating a fully tensorial model of plasticity of disordered solids which accounts for the discrete and stochastic nature of the elementary deformation processes on the smallest scales and thus bridges the gap between statistical physics and engineering plasticity approaches.
We apply the model to both two- and three-dimensional problems, including finite samples, intrinsically heterogeneous deformation processes such as bending and indentation, and genuinely multi-axial loading conditions. For all these systems we analyze the avalanche statistics in terms of the stress dependent distribution of avalanche sizes and determine the exponent which controls the power-law regime of the avalanche size distributions, the exponent which controls the divergence of the maximum avalanche size near the yield stress, and the exponent which connects duration and size of avalanches. Our simulations yield the surprising result that, under all these circumstances, the exponents and neither depend on the nature of the stress and strain variables (scalar/uniaxial vs. tensorial/multiaxial), nor on the dimensionality of the system (2D vs. 3D), nor on the presence or absence of macroscopic strain gradients. Where can be meaningfully measured, it is also the same for all loading conditions. Furthermore, our avalanche distributions can be fitted quantitatively by non-mean field scaling functions. Finally, we also demonstrate that not only are avalanche size distributions universal and not mean field, but so are the average shapes of avalanche signals.
Model
Our plasticity model is formulated in the spirit of rate-independent continuum plasticity with a J2/Von Mises type yield criterion, which we generalize to account for structural randomness and deformation occurring in localized, discrete events. We implement our simulations on a dimensional cubic lattice and assign to each lattice element a local stress tensor . From this we define a yield condition as , where is the deviatoric part of the stress tensor and is the rank-2-unit tensor in dimensions. Activation of a shear event occurs as soon as the equivalent stress at a lattice site exceeds the randomly assigned threshold which we draw from a uniform distribution over . Such activation results in local atomic re-arrangements which lead to a change of the local yield threshold, which is newly assigned after each event. In this respect our model differs significantly from the zero-temperature limit of stochastic plasticity models which consider thermal activation of shear events with a stress dependent threshold, as assumed in the Kinetic Monte Carlo approaches proposed by Bulatov and Argon Bulatov and Argon (1994) and Homer and Schuh Homer and Schuh (2009). These models assume a fixed and uniform local yield threshold, an assumption which may not fully capture the influence of atomic-scale randomness on plastic flow and makes such models unsuitable for investigating avalanche phenomena.
The stress on an element is the sum of internal stress arising from the plastic strain field and an applied load. In simulations with periodic boundary conditions (PBCs), the loading is a spatially homogeneous ‘external’ stress field which is understood to arise from remote boundary tractions applied to the infinite contour. Simulations of finite samples are performed using standard finite element methods (FEM) to solve the elastic-plastic problem with the specified boundary displacements and/or tractions. For details of the FEM implementation in the context of a scalar model, see Sandfeld et al. (2015). In both cases, the external stress is increased adiabatically slowly and is held constant during avalanches, as described previously Budrikis and Zapperi (2013); Sandfeld et al. (2015). When an element yields, we increase its local plastic strain by an amount where the strain direction is chosen to maximize the locally dissipated energy and is a fixed strain increment. The size of an avalanche is defined as the to tal number of local strain increments, and its duration is the number of parallel update steps performed.
The ‘internal’ stress arising from the plastic strain field is calculated using either a Green’s function method (for PBCs) or FEM (for finite systems). In the former case we consider stress and strain only at the element center-points which form a cubic grid with periodic boundary conditions. In Fourier space, the internal stress field is given by . The interaction kernel is obtained by treating the plastic strain of an element as the strain of an Eshelby inclusion of vanishing volume located at the element centre-point, for which the stress field is known analytically D. (1957). Continuing this solution periodically with period allows us to use a Fourier transform to obtain the overall internal stress field that arises from superposition of all element stresses.
For finite samples, our FEM implementation uses four-node linear elements of square shape. Each element is associated with an element stress that is evaluated as the average stress over the element. An active element experiences a plastic strain increment that is homogeneous over the element and zero elsewhere. The models are matched by ensuring that the plastic strain field of the point-like Eshelby inclusion, integrated over the element, has the same value as the homogeneous element strain in the finite element model.
Simulations have been performed in both two and three dimensions, considering both macro-homogeneous deformation modes (uniaxial tension with free surfaces and applied tensile tractions, pure shear, bi-axial deformation with applied tensile and shear tractions) and, in 2D, also macro-heterogeneous deformation modes such as simple shear, bending, and indentation. Systems in 3D had elements, and 2D systems had elements.
Results
Depinning models give strain localization dependent on loading conditions.
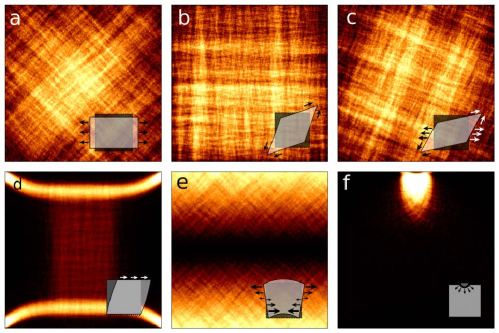
We first verify that our model gives rise to strain localization consistent with previous experimental and molecular dynamics studies Vaidyanathan et al. (2001); Ramamurty et al. (2005); Shi and Falk (2007); Maloney and Robbins (2009); Chen and Lin (2010). As illustrated in Fig. 1, the plastic strain field organizes into localization patterns (shear bands) which approximately follow the directions of maximum shear stress. In the case of uniaxial tension and biaxial loading, this is at approximately to the tensile axis. In the case of simple shear the vertically fixed surfaces cause strong stress concentrations in the specimen corners. Under simulated 2D indentation with a circular indenter, strain localizes into a pattern of intersecting circles. This patterrn is typical of shear bands observed in indentation of bulk metallic glasses Su and Anand (2006), and the simulations correctly reproduce even details of the incipient shear band pattern such as the slightly acute intersection angle of the shear bands (Fig. 1g,h). We emphasize that this type of strain patterning cannot be captured at all by scalar plasticity models.
Avalanche exponents are universal for a variety of loading and boundary conditions.
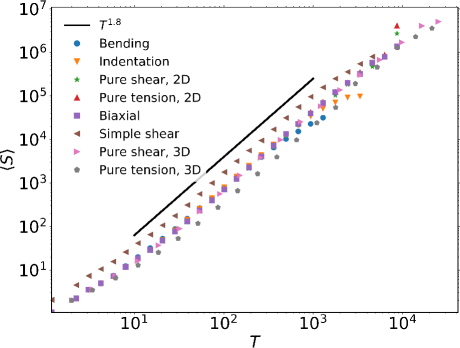
We now turn to measurement of the exponents describing the avalanche size distributions. While in mean field depinning, the avalanche size distribution is given by , we find that this simple exponential tail does not fit our data. We turn instead to a first-order correction to the mean field size distribution, given by Le Doussal and Wiese (2012)
| (1) |
Here, , where the size of the largest avalanches diverges like as the external loading (in simulations without periodic boundary conditions, averaged over the loaded face) approaches a non-universal critical value , and is a universal exponent. The parameters , , and are, in terms of the exponent , given by Le Doussal and Wiese (2012)
| (2a) | |||
| (2b) | |||
| (2c) | |||
| (2d) | |||
where is Euler’s constant.
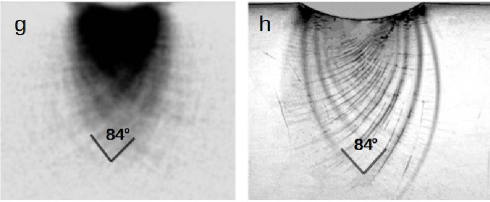
We use the form (1) to simultaneously fit avalanche size distributions for six different loading/boundary conditions: (i) Uniaxial tension in 3D with periodic boundary conditions; (ii) uniaxial tension in 2D with free side surfaces; (iii) biaxial deformation in 2D with superimposed tensile and shear tractions; (iv) pure shear in 3D with periodic boundary conditions; (v) pure shear in 2D with uniform shear tractions applied to the unconstrained side surfaces; (vi) simple shear in 2D with horizontal traction forces applied to the vertically constrained top surface and with fixed bottom surface. We emphasize that the only fitting parameters are for each loading condition, and the exponents and , which are the same for all loading conditions, with no additional free parameters. We find and . Fig. 2 shows the measured avalanche size distributions and their collapse using these two parameters, along with the fit of (1) to the collapsed data. Table 1 gives the fitted values for each loading.
To test whether a joint fit of avalanche distributions for different loading conditions is appropriate, we have also fitted each loading condition separately with the functional form (1). Data collapses from these fits are shown in Fig. S1. The fitted exponent is nearly identical across the loading conditions, with separate fits giving and values ranging from to .
On the other hand, when fitted separately for each loading condition, varies considerably, from for biaxial loading to for pure tension in 2d, with mean fitted value . This certainly indicates that the nominal errorbar of in the joint fit is an underestimate. However, because of the strong universality of the other exponents as well as the avalanche shapes (see below), a joint fit of all loading conditions is an appropriate procedure. Indeed, since and both determine for each distribution and both are fitted, a range of and values will give fits of approximately equal quality, and constraining to be the same for all loadings avoids spurious over-fitting of individual distributions. This interpretation is also supported by the high quality of the data collapse in Fig. 2(b).
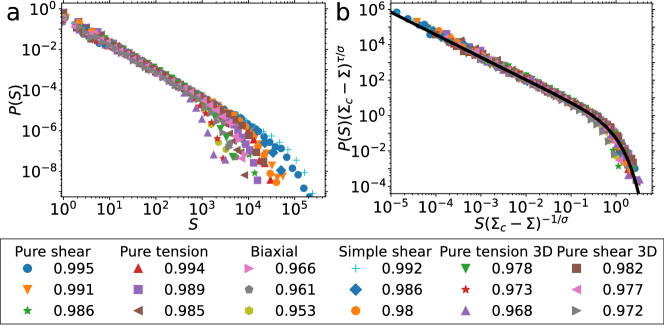
Using our finite-element based code, we have also studied more complex loading conditions such as bending and indentation. Bending corresponds to a heterogeneous but uniaxial stress state; however, hardening is observed (Fig. S2). For indentation, the stress state is both heterogeneous and multi-axial and in addition the fraction of the simulated specimen that actually undergoes plastic deformation increases with increasing force acting on the indenter. Accordingly, in both cases, no critical stress can be defined.
However, despite these complexities, the avalanche distribution is described by an exponent consistent with other cases, as shown in Fig. 3. We have fitted the distributions to obtain . In the case of bending, the fitting form of Eq. (1) is used, with shared between all curves but with fitted independently for each . We find . For indentation, the distributions display distinct ‘bumps’ in the tails and we use a fitting form
| (3) |
with and shared between all curves, and and fitted independently for each . Here, we find .
| Loading | |
|---|---|
| Pure shear, 2D | |
| Pure tension, 2D | |
| Biaxial, 2D | |
| Simple shear, 2D | |
| Pure tension, 3D, PBCs | |
| Pure shear, 3D, PBCs |
Remarkably, although the strain patterns depend strongly on the loading conditions, the avalanche exponent is not only independent of the dimensionality (2D vs. 3D), but it is also independent of whether the stress field is homogeneous and uniaxial (pure shear, pure tension), homogeneous and biaxial, or inhomogeneous and uni- or biaxial (bending, simple shear, indentation). Pure tension and pure shear produce identical results, which indicates that the avalanche exponent is not influenced by the presence or absence of hydrostatic stresses (pure tension adds a hydrostatic stress contribution), by boundary conditions, or by the orientation of the simulation grid (deviatoric stresses are in both cases equivalent but the directions of shear differ by 45 degrees).
A third universal exponent defines the relationship between avalanche duration and avalanche size . To determine this exponent we define the duration of an avalanche as the number of simultaneous updates required from the start of the avalanche to the moment when all elements are stable again. Also here we find strong universality with an exponent for all loading conditions, including bending and indentation (Fig. 4).
Avalanche temporal signals are not consistent with mean field theory.
Beyond avalanche size distributions, the average temporal signal of avalanches, , is also expected to take a form that depends on the universality class of the yield transition Laurson et al. (2013); Dobrinevski et al. (2014).
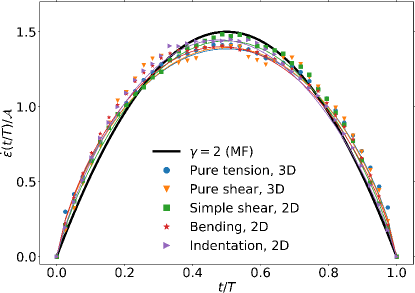
We first measure the average avalanche shape for avalanches of fixed duration . To first order, for time and with normalization such that the area under the curve is , the expected form is Laurson et al. (2013)
| (4) |
where is the avalanche size vs duration exponent measured above, is the beta function, and is a parameter describing the asymmetry of the avalanche shape.
We have measured the average shape of avalanches of fixed duration under several loading conditions: pure tension and pure shear in systems with periodic boundary conditions in 3D, as well as simple shear, bending and indentation in systems with free surface boundary conditions in 2D. As shown in Fig. 5, we fit each curve using (4) to obtain a mean , identical to the measurement based on avalanche size vs duration reported in Fig. 4, and inconsistent with the inverted parabola of mean field theory where and . A full list of fit parameters is given in Table 2.
| Loading | ||
|---|---|---|
| Pure tension, 3D | – | |
| Pure shear, 3D | – | |
| Simple shear, 2D | – | |
| Bending, 2D | ||
| Indentation, 2D |
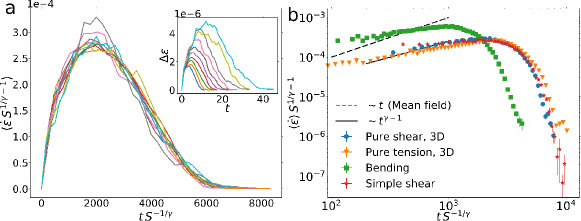
We have also measured avalanche shapes for avalanches of fixed size . In this case, the expected scaling form is Dobrinevski et al. (2014); Durin et al. (2016)
| (5) |
where and are size and time scales, and is a universal scaling function. Accordingly, for a given loading condition, mean avalanche shapes at different sizes can be collapsed by rescaling by and by , with the exponent as measured from vs data. We show in Fig. 6(a) this collapse for pure shear loading in 3D. We have also tested data collapse using the mean field exponent and find a less satisfactory collapse, as shown in Fig. S3. In addition, at early times, the universal shape is expected Dobrinevski et al. (2014). As shown in Fig. 6(b), this scaling with is valid for all loadings. In contrast, the mean field prediction of linear growth () is clearly in contradiction with the data.
Conclusion
We have formulated for the first time a tensorial model of amorphous materials plasticity which captures avalanche dynamics and at the same time reproduces the complex, spatially heterogeneous shear localization patterns which emerge as amorphous materials deform under inhomogeneous loads. Using this model we have demonstrated that avalanches in both 2 and 3 dimensions are characterized by universal, dimension independent critical exponents which are consistently observed across a wide range of loading conditions including heterogeneous and multi-axial loading. The exponents we have obtained, , and differ from the predictions , and derived from a mean-field theory of the depinning transition Dahmen et al. (2009) but remain consistent with the depinning paradigm. In fact, our avalanche size distributions are described quantitatively by corrections to mean field theory Le Doussal and Wiese (2012), with only , and the non-universal critical stress as fitting parameters. The agreement between our results and the predictions of depinning models outside of the mean field universality class is further seen in the avalanche temporal signals, which are clearly governed by the exponent and which have shapes inconsistent with mean field predictions.
Our results provide compelling evidence that the universality class of plastic yield in amorphous materials is not mean field depinning as has been previously claimed, even though the phenomenon may still be considered within the depinning paradigm. We have demonstrated this by using a model that is both truly quasistatic — a feature which has been shown to be of great importance for measurement of critical exponents Liu et al. (2016) and which is difficult to ensure in experiments and molecular dynamics simulations — and also tensorial, thereby being – unlike scalar models – directly applicable to real plasticity experiments. The universality of the determined exponents provides an a posteriori justification of the use of scalar models which are ubiquitous in the statistical physics literature on amorphous plasticity.
A possible explanation for the failure of mean field theory may be related to the fact that the long-range elastic interactions associated with elasto-plasticity are not associated with a positively definite elastic kernel, invalidating a crucial assumption of the renormalization group theory on which our current understanding of depinning phenomena Le Doussal et al. (2002) is based. Intriguingly, the exponents we measure are close to the values known for depinning of 1D lines with long-range interactions ( Bonamy et al. (2008); Laurson et al. (2010), Laurson et al. (2010), Bonamy et al. (2008)), and the universal scaling form of (1) is a renormalization group prediction valid for long-range 1D depinning Le Doussal and Wiese (2012). This suggests that dimensional reduction via strain localization may be relevant in these systems Budrikis and Zapperi (2013); Liu et al. (2016). Such strain localization on linear/planar manifolds, which follow directions that are dictated by the macroscopic stress state, may also be an essential factor in the emergence of shear bands which may thus be intimately related to the avalanche dynamics.
Acknowledgements
ZB and SZ are supported by ERC Advanced Grant SIZEFFECTS. SZ acknowledges support from the Academy of Finland FiDiPro progam, project 13282993. MZ acknowledges support from EPSRC under grant EP/J003387/1 and from DFG under grant Za-171/8-1. ZB thanks Ezequiel Ferrero and Gianfranco Durin for useful discussions.
References
- Durin and Zapperi (2006) G. Durin and S. Zapperi, in The Science of Hysteresis, edited by G. Bertotti and I. Mayergoyz (Elsevier, Amsterdam, 2006), vol. 2, pp. 181–267.
- Bonamy et al. (2008) D. Bonamy, S. Santucci, and L. Ponson, Phys. Rev. Lett. 101, 045501 (2008), URL http://link.aps.org/doi/10.1103/PhysRevLett.101.045501.
- Laurson et al. (2010) L. Laurson, S. Santucci, and S. Zapperi, Phys. Rev. E 81, 046116 (2010), URL http://link.aps.org/doi/10.1103/PhysRevE.81.046116.
- Laurson et al. (2013) L. Laurson, X. Illa, S. Santucci, K. T. Tallakstad, K. J. Måløy, and M. J. Alava, Nature communications 4 (2013).
- Argon and Kuo (1979) A. Argon and H. Kuo, Materials Science and Engineering 39, 101 (1979), ISSN 0025-5416, URL http://www.sciencedirect.com/science/article/pii/0025541679901745.
- Argon and Shi (1983) A. Argon and L. Shi, Acta Metallurgica 31, 499 (1983), ISSN 0001-6160, URL http://www.sciencedirect.com/science/article/pii/000161608390038X.
- Falk and Langer (1998) M. L. Falk and J. S. Langer, Phys. Rev. E 57, 7192 (1998), URL http://link.aps.org/doi/10.1103/PhysRevE.57.7192.
- Albaret et al. (2016) T. Albaret, A. Tanguy, F. Boioli, and D. Rodney, Phys. Rev. E 93, 053002 (2016), URL http://link.aps.org/doi/10.1103/PhysRevE.93.053002.
- Baret et al. (2002) J.-C. Baret, D. Vandembroucq, and S. Roux, Phys. Rev. Lett. 89, 195506 (2002), URL http://link.aps.org/doi/10.1103/PhysRevLett.89.195506.
- Picard et al. (2002) G. Picard, A. Ajdari, L. Bocquet, and F. m. c. Lequeux, Phys. Rev. E 66, 051501 (2002), URL http://link.aps.org/doi/10.1103/PhysRevE.66.051501.
- Picard et al. (2005) G. Picard, A. Ajdari, F. m. c. Lequeux, and L. Bocquet, Phys. Rev. E 71, 010501 (2005), URL http://link.aps.org/doi/10.1103/PhysRevE.71.010501.
- Jagla (2007) E. A. Jagla, Phys. Rev. E 76, 046119 (2007), URL http://link.aps.org/doi/10.1103/PhysRevE.76.046119.
- Shan et al. (2008) Z. W. Shan, J. Li, Y. Q. Cheng, A. M. Minor, S. A. Syed Asif, O. L. Warren, and E. Ma, Phys. Rev. B 77, 155419 (2008), URL http://link.aps.org/doi/10.1103/PhysRevB.77.155419.
- Dahmen et al. (2009) K. A. Dahmen, Y. Ben-Zion, and J. T. Uhl, Phys. Rev. Lett. 102, 175501 (2009), URL http://link.aps.org/doi/10.1103/PhysRevLett.102.175501.
- Wang et al. (2009) G. Wang, K. Chan, L. Xia, P. Yu, J. Shen, and W. Wang, Acta Materialia 57, 6146 (2009), ISSN 1359-6454, URL http://www.sciencedirect.com/science/article/pii/S1359645409005527.
- Homer et al. (2010) E. R. Homer, D. Rodney, and C. A. Schuh, Phys. Rev. B 81, 064204 (2010), URL http://link.aps.org/doi/10.1103/PhysRevB.81.064204.
- Sun et al. (2010) B. A. Sun, H. B. Yu, W. Jiao, H. Y. Bai, D. Q. Zhao, and W. H. Wang, Phys. Rev. Lett. 105, 035501 (2010), URL http://link.aps.org/doi/10.1103/PhysRevLett.105.035501.
- Sun and Wang (2011) B. A. Sun and W. H. Wang, Applied Physics Letters 98, 201902 (2011), URL http://scitation.aip.org/content/aip/journal/apl/98/20/10.1063/1.3592249.
- Martens et al. (2011) K. Martens, L. Bocquet, and J.-L. Barrat, Phys. Rev. Lett. 106, 156001 (2011), URL http://link.aps.org/doi/10.1103/PhysRevLett.106.156001.
- Talamali et al. (2011) M. Talamali, V. Petäjä, D. Vandembroucq, and S. Roux, Phys. Rev. E 84, 016115 (2011), URL http://link.aps.org/doi/10.1103/PhysRevE.84.016115.
- Talamali et al. (2012) M. Talamali, V. Petäjä, D. Vandembroucq, and S. Roux, Comptes Rendus Mécanique 340, 275 (2012), ISSN 1631-0721, recent Advances in Micromechanics of Materials, URL http://www.sciencedirect.com/science/article/pii/S1631072112000472.
- Sun et al. (2012) B. Sun, S. Pauly, J. Tan, M. Stoica, W. Wang, U. Kühn, and J. Eckert, Acta Materialia 60, 4160 (2012), ISSN 1359-6454, URL http://www.sciencedirect.com/science/article/pii/S1359645412002698.
- Budrikis and Zapperi (2013) Z. Budrikis and S. Zapperi, Phys. Rev. E 88, 062403 (2013), URL http://link.aps.org/doi/10.1103/PhysRevE.88.062403.
- Salerno and Robbins (2013) K. M. Salerno and M. O. Robbins, Phys. Rev. E 88, 062206 (2013), URL http://link.aps.org/doi/10.1103/PhysRevE.88.062206.
- Nicolas et al. (2014) A. Nicolas, K. Martens, L. Bocquet, and J.-L. Barrat, Soft Matter 10, 4648 (2014), URL http://dx.doi.org/10.1039/C4SM00395K.
- Lin et al. (2014a) J. Lin, A. Saade, E. Lerner, A. Rosso, and M. Wyart, EPL (Europhysics Letters) 105, 26003 (2014a), URL http://stacks.iop.org/0295-5075/105/i=2/a=26003.
- Lin et al. (2014b) J. Lin, E. Lerner, A. Rosso, and M. Wyart, Proceedings of the National Academy of Sciences 111, 14382 (2014b).
- Antonaglia et al. (2014a) J. Antonaglia, W. J. Wright, X. Gu, R. R. Byer, T. C. Hufnagel, M. LeBlanc, J. T. Uhl, and K. A. Dahmen, Phys. Rev. Lett. 112, 155501 (2014a), URL http://link.aps.org/doi/10.1103/PhysRevLett.112.155501.
- Antonaglia et al. (2014b) J. Antonaglia, X. Xie, G. Schwarz, M. Wraith, J. Qiao, Y. Zhang, P. K. Liaw, J. T. Uhl, and K. A. Dahmen, Scientific Reports 4, 4382 (2014b).
- Liu et al. (2016) C. Liu, E. E. Ferrero, F. Puosi, J.-L. Barrat, and K. Martens, Phys. Rev. Lett. 116, 065501 (2016), URL http://link.aps.org/doi/10.1103/PhysRevLett.116.065501.
- Lin et al. (2015) J. Lin, T. Gueudre, A. Rosso, and M. Wyart, Phys. Rev. Lett. 115, 168001 (2015), URL http://link.aps.org/doi/10.1103/PhysRevLett.103.065501.
- Sandfeld et al. (2015) S. Sandfeld, Z. Budrikis, S. Zapperi, and D. Fernandez Castellanos, Journal of Statistical Mechanics: Theory and Experiment 2015, P02011 (2015), URL http://stacks.iop.org/1742-5468/2015/i=2/a=P02011.
- Martens et al. (2012) K. Martens, L. Bocquet, and J.-L. Barrat, Soft Matter 8, 4197 (2012).
- Zaiser and Moretti (2005) M. Zaiser and P. Moretti, Journal of Statistical Mechanics: Theory and Experiment 2005, P08004 (2005), URL http://stacks.iop.org/1742-5468/2005/i=08/a=P08004.
- Sandfeld and Zaiser (2014) S. Sandfeld and M. Zaiser, Journal of Statistical Mechanics: Theory and Experiment 2014 (2014), ISSN 17425468, URL http://iopscience.iop.org/1742-5468/2014/3/P03014/.
- Bulatov and Argon (1994) V. V. Bulatov and A. S. Argon, Modelling and Simulation in Materials Science and Engineering 2, 167 (1994), URL http://stacks.iop.org/0965-0393/2/i=2/a=001.
- Anand and Su (2005) L. Anand and C. Su, Journal of the Mechanics and Physics of Solids 53, 1362 (2005).
- Su and Anand (2006) C. Su and L. Anand, Acta Materialia 54, 179 (2006).
- Yang et al. (2006) Q. Yang, A. Mota, and M. Ortiz, Computational Mechanics 37, 194 (2006).
- Homer and Schuh (2009) E. R. Homer and C. A. Schuh, Acta Materialia 57, 2823 (2009), ISSN 1359-6454, URL http://www.sciencedirect.com/science/article/pii/S1359645409001311.
- Schuh and Lund (2003) C. Schuh and A. Lund, Nature materials 2, 449 (2003).
- D. (1957) E. J. D., Proceedings of the Royal Society of London. Series A, Mathematical and Physical Sciences 241, pp. 376 (1957), ISSN 00804630, URL http://www.jstor.org/stable/100095.
- Vaidyanathan et al. (2001) R. Vaidyanathan, M. Dao, G. Ravichandran, and S. Suresh, Acta Materialia 49, 3781 (2001), ISSN 1359-6454, URL http://www.sciencedirect.com/science/article/pii/S1359645401002634.
- Ramamurty et al. (2005) U. Ramamurty, S. Jana, Y. Kawamura, and K. Chattopadhyay, Acta Materialia 53, 705 (2005), ISSN 1359-6454, URL http://www.sciencedirect.com/science/article/pii/S1359645404006329.
- Shi and Falk (2007) Y. Shi and M. L. Falk, Acta Materialia 55, 4317 (2007), ISSN 1359-6454, URL http://www.sciencedirect.com/science/article/pii/S135964540700239X.
- Maloney and Robbins (2009) C. E. Maloney and M. O. Robbins, Phys. Rev. Lett. 102, 225502 (2009), URL http://link.aps.org/doi/10.1103/PhysRevLett.102.225502.
- Chen and Lin (2010) K. Chen and J. Lin, Int. J. Plasticity 26, 1645 (2010).
- Le Doussal and Wiese (2012) P. Le Doussal and K. J. Wiese, Phys. Rev. E 85, 061102 (2012), URL http://link.aps.org/doi/10.1103/PhysRevE.85.061102.
- Dobrinevski et al. (2014) A. Dobrinevski, P. L. Doussal, and K. J. Wiese, EPL (Europhysics Letters) 108, 66002 (2014), URL http://stacks.iop.org/0295-5075/108/i=6/a=66002.
- Durin et al. (2016) G. Durin, F. Bohn, M. Correa, R. Sommer, P. L. Doussal, and K. Wiese, arXiv preprint arXiv:1601.01331 (2016).
- Le Doussal et al. (2002) P. Le Doussal, K. J. Wiese, and P. Chauve, Phys. Rev. B 66, 174201 (2002), URL http://link.aps.org/doi/10.1103/PhysRevB.66.174201.