DPF2015-350
Performance of Wavelength-Shifting Fibers for the Mu2e Cosmic Ray Veto Detector
on behalf of the Mu2e Collaboration
The Mu2e experiment will search for a neutrino-less muon-to-electron conversion process with almost four orders of magnitude of sensitivity improvement relative to the current best limit. One important background is caused by cosmic ray muons, and particles produced by their decay or interactions, mimicking the conversion electron signature. In order to reach the design sensitivity, Mu2e needs to obtain a cosmic ray veto (CRV) efficiency of 99.99%. The CRV system consists of four layers of plastic scintillating counters read out by silicon photo-multipliers (SiPM) through wavelength shifting fibers. The CRV counters must produce sufficient photo statistics in order to achieve the required veto efficiency. We study the light properties of several wavelength shifting fiber sizes in order to optimize the total light yield for the CRV system. The measurements are performed using a scanner designed to ensure fiber quality for the CRV.
PRESENTED AT
DPF 2015
The Meeting of the American Physical Society
Division of Particles and Fields
Ann Arbor, Michigan, August 4–8, 2015
1 Introduction
The Mu2e experiment [1] proposes a search for neutrino-less conversion of a muon into an electron in the presence of a nucleus. In the Standard Model(SM) this process can occur due to neutrino oscillations but at a rate approximately thirty orders of magnitude below the current best experimental limits. However, many SM extensions suggest that this process will occur at an enhanced rate that would be observable experimentally. An observation of this conversion at Mu2e would be an unambiguous sign of physics beyond the SM. The total background budget at Mu2e is less than 0.4 events after three years of data taking. However, with out a veto system one background event will be produced per day at Mu2e due to cosmic ray muons. So, in order to achieve the required sensitivity, Mu2e needs to suppress the cosmic ray background by four orders of magnitude. The cosmic ray veto (CRV) system has been designed to cover the Mu2e apparatus and veto cosmic ray background with 99.99% efficiency. The CRV consists of plastic scintillator counters read out through wavelength shifting (WLS) fibers. The CRV efficiency critically depends on the light yield emission from the WLS fibers. We have designed and built a WLS fiber scanner to measure the light properties and ensure the quality of the fiber used in the CRV.
2 Wavelength shifting fiber
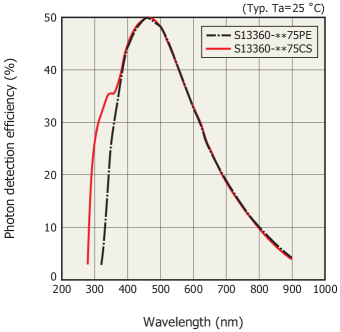
The Mu2e experiment plans to use Kuraray [2] Y11 WLS fibers for the CRV system. The fluorescent dye, K27, in the Kuraray Y11 fibers traps the blue light (425 nm) from the scintillating counters and re-emits the light in the green (500-600 nm) spectral region (Figure 1). The fibers are read out by silicon photomultipliers (SiPM). The spectral photon detection efficiency response of the chosen SiPM [3] type has is well match to the emission spectrum of Kuraray Y11 fiber. We have selected multi-clad and non-S type fiber due to the enhanced light yield that it provides [4]
3 Fiber scanner
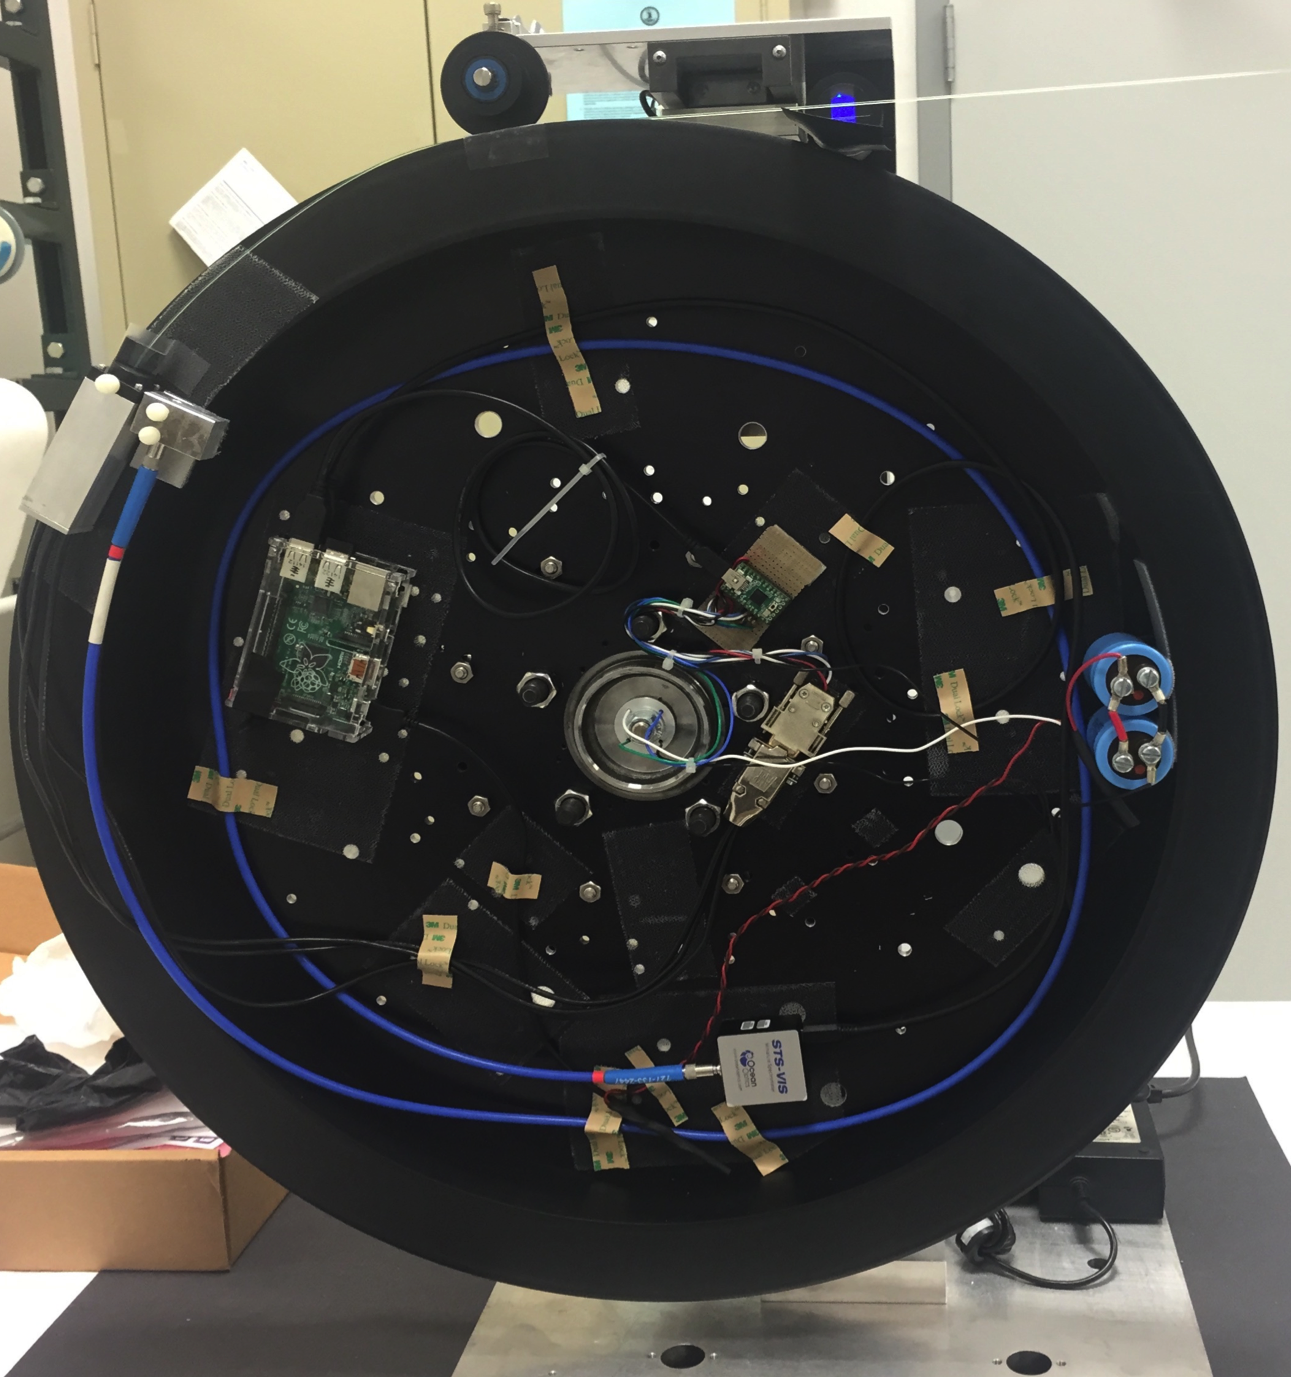
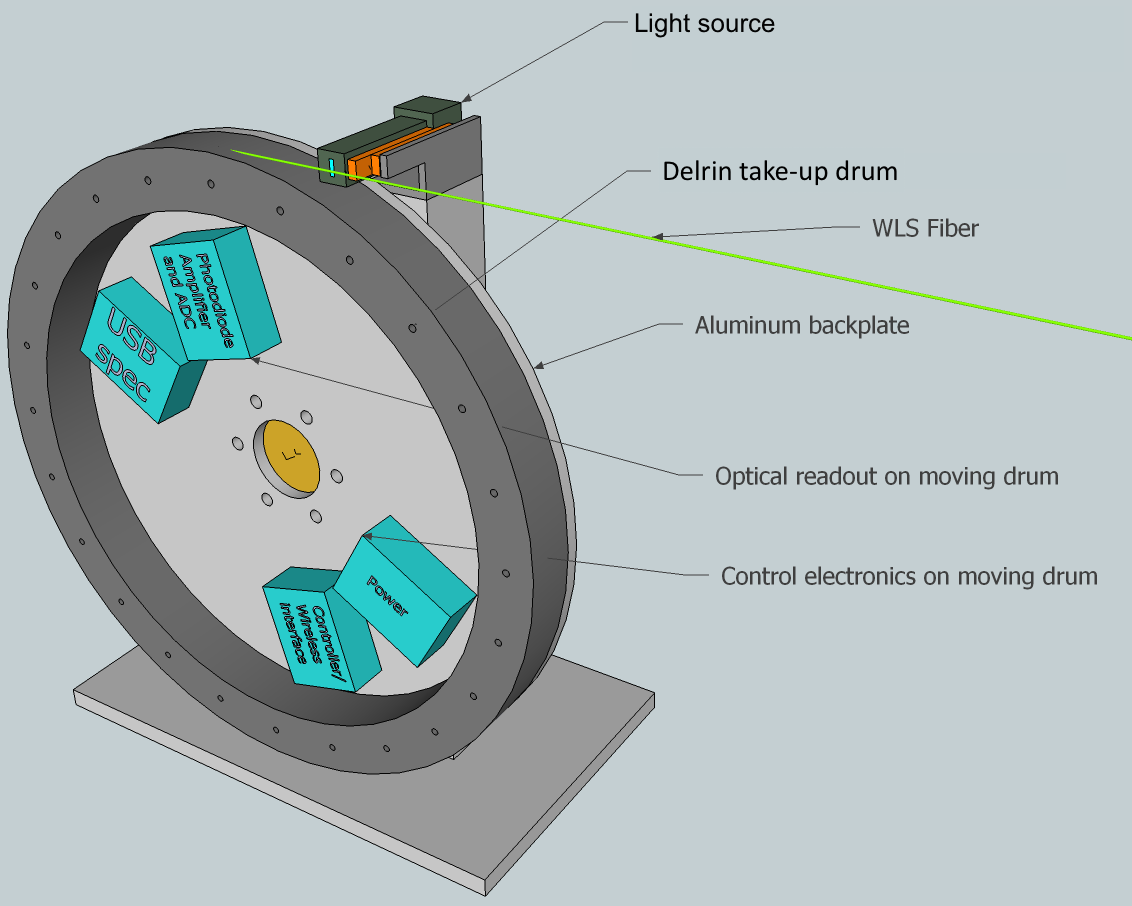
We designed and produced a fiber scanner to study the fiber properties and to assure the quality of the fibers used for the CRV system (see a photo in schematic drawing in Figures LABEL:fig:scanner,fig:schematics) . The fiber scanner consists of a large diameter ( = 62 cm) take-up drum carrying the optical readout hardware. The large diameter of the take-up drum was selected to accomodate the large-diameter ( 0.2 cm) WLS fibers that we are considering for the CRV system. The recommended minimum bending diameter [4] for this type of fiber is below the diameter of the take-up drum.
A blue LED light source excites the WLS fiber and is read out by a large area Hamamatsu S1227-1010BR photodiode [5] and STS-VIS USB Ocean Optics spectrophotometer [6]. The take-up drum is driven by a stepping motor and controlled for gentle acceleration and deceleration. The fiber is delivered by the manufacturer on 90 cm diameter cardboard spools. The fiber end is connected to one of the readout devices during the winding process. The take-up drum can increment at any predetermined distance, stopping for measurements of the light spectra and intensity. A fiber scan procedure is performed remotely through a web interface on a Raspberry Pi mounted on the take-up drum. During data taking the Raspberry Pi controls the step motor, and collects and stores the data from the photodiode and spectrometer.
4 Results
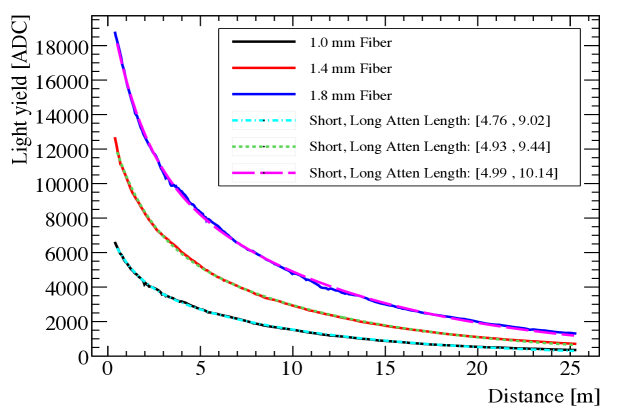
The photodiode measures the absolute value of the light yield. The large photodiode area provides stable measurements, which are not sensitive to the effects from a fiber misalignment or orientation. The photodiode yields a uniform response [5] in the wavelength spectral region of the WLS fiber emission. The spectral response of the SiPM used in the CRV system features a peak sensitivity at 450 nm (Figure 1). Therefore, the light attenuation measured in the CRV system slightly differs from the one measured with the photodiode. Even though the light attenuation measurements using the photodiode and SiPM can not be directly compared, a photodiode scan can identify compromised fiber with sharp drops in the light yield or poor attenuation. The result of the photodiode scan is presented in Figure 4 and shows the light yield measurements at 5 cm increments over 25 m of fiber. The short and long attenuation components are extracted from the fit to a double exponential decay function: . We have examined 1.0, 1.4 and 1.8 mm diameter fibers. We have observed that the light yield for 1.4 and 1.8 mm fiber is higher than the light yield from 1.0 mm fiber by factors of 2 and 3 respectively. In addition to better light yield, thicker diameter fibers provide slightly better attenuation as shown in Figure 4.
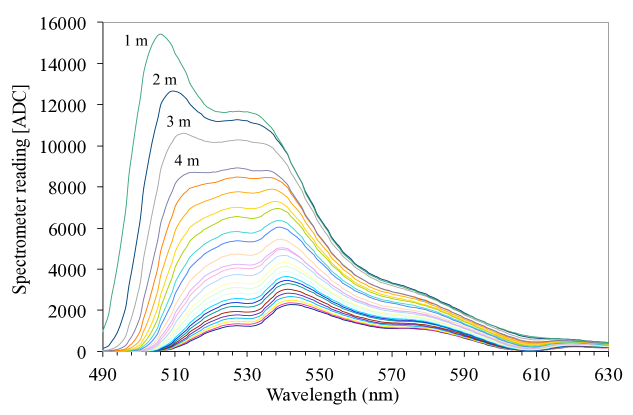
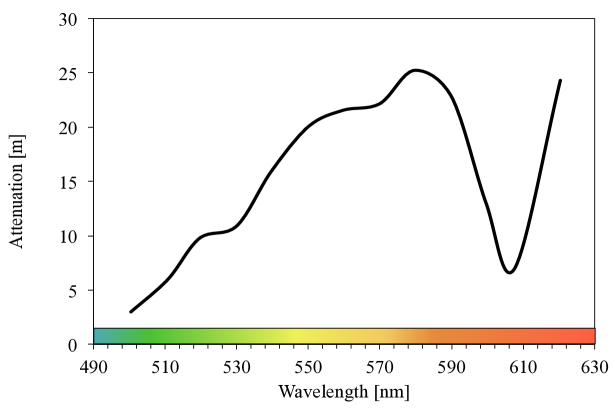
The spectrometer provides spectral measurements of the light emission from the fiber. Model STS-VIS features a high spectral resolution and high signal to noise ratio in the wide (350-800 nm) spectral region. The spectral response from the fiber is obtained at several points along the fiber. The result from a scan is shown on Figure 5 and suggests that the shorter wavelength spectrum is attenuated at a significantly higher rate. The spectrum at nm is absorbed and re-emitted by the fluorescent dye as this light component propagates along the fiber. We extract the attenuation length values for various wavelengths (Figure 6) by employing a single exponential fit of the spectral light intensity as a function of distance to the readout end.
5 Conclusion
We report the measurements of the light yield and attenuation of Kuraray Y11 WLS fibers. We performed the using a fiber scanner designed for the CRV system of the Mu2e experiment. The fiber scanner features a fast and reliable data acquisition system, and it will be an essential component for fiber quality assurance during the production phase of the CRV. In addition, the fiber scanner has been successfully used to study the properties of the fibers. The results suggest a significant light yield gain from larger diameter fibers. Kuraray Y11 WLS fibers yield long ( m) light attenuation values for the 520 - 600 nm wavelength spectrum. Photo detectors with high sensitivity in this spectral region are preferable for long scintillating detectors with WLS fibers.

ACKNOWLEDGMENTS
I am grateful to Don Alfonso d’Alba for certain services essential to this investigation.
References
- [1] L. Bartoszek et al, “Mu2e Technical Design Report (TDR)”, arXiv:1501.05241.
- [2] Kuraray America, Inc., 200 Park Ave., NY 10166 USA; 3-1-6, NIHONBASHI, CHUO-KU, TOKYO 103-8254, JAPAN.
- [3] Hamamatsu Photonics K.K., 325-6 Sunayama-cho, Naka-ku, Hamamatsu City, Shizuoka Pref., 430-8587, Japan. Hamamatsu Corp., 360 Foothill Rd., Bridgewater, NJ 08807.
- [4] http://kuraraypsf.jp/psf/
- [5] http://www.hamamatsu.com/us/en/product/alpha/P/4103/S1227-1010BR/index.html
- [6] http://oceanoptics.com/product/sts-vis-microspectrometer/
- [7] A. L. di Cenzo, Trans. Acad. Ducal. Milan., 23, 2647 (1771).