QCD Evolution of Superfast Quarks
Abstract
Recent high-precision measurements of nuclear deep inelastic scattering at high and moderate GeV2 give a rare opportunity to reach the quark distributions in the superfast region, in which the momentum fraction of the nucleon carried by its constituent quark is larger than the total fraction of the nucleon at rest, . We derive the leading-order QCD evolution equation for such quarks with the goal of relating the moderate- data to the two earlier measurements of superfast quark distributions at large GeV2. Since the high- measurements gave strongly contradictory estimates of the nuclear effects that generate superfast quarks, relating them to the high-precision, moderate- data through QCD evolution allows us to clarify this longstanding issue. Our calculations indicate that the moderate- data at are in better agreement with the high- data measured in (anti)neutrino-nuclear reactions which require substantial high-momentum nuclear effects in the generation of superfast quarks. Our prediction for the high- and region is somewhat in the middle of the neutrino-nuclear and muon-nuclear scattering data.
I Introduction
With the operation of the Large Hadron Collider (LHC), the high-energy upgrade of Jefferson Lab (JLab), and the anticipation of the future electron-ion collider (EIC), the issue of understanding the partonic structure of nuclei is currently a very important topic. Several collaborations are working on the development of comprehensive parameterizations for nuclear partonic distributions (nPDFs) covering the widest possible range of invariant momentum transfer and Bjorken variable (see. e.g. Refs.Eskola et al. (2017); Kovarik et al. (2016); Owens et al. (2013)).
From the viewpoint of nuclear physics, partons in nuclei present a very interesting dynamical construction as they are constrained to be in nucleons, which represent the apparent degrees of freedom in nuclei. Due to the large difference between the excitation energy scales of the nucleon (100s of MeV) and the nucleus (10s of MeV), it was initially believed that the nuclear medium should play a non-essential role in the partonic dynamics of bound nucleons. Studies during the last several decades, however, discovered a host of effects which are genuinely related to nuclear dynamics interfering with the QCD dynamics of partonic distributions in bound nucleons. The most prominent of these effects is the suppression of nPDFs in the region (EMC effect) Aubert et al. (1983); Frankfurt and Strikman (1988); Geesaman et al. (1995), nuclear anti-shadowing at Arneodo et al. (1988); Frankfurt et al. (1990); Brodsky and Lu (1990), and finally the shadowing effects observed at Arneodo et al. (1988); Frankfurt et al. (2012); Frankfurt and Strikman (1988).
While there have been significant experimental and theoretical efforts in understanding the above mentioned effects, one effect which is less explored is the dynamics of superfast quarks. Superfast quarks are quarks in nuclei possessing momentum fractions and represent one of the most elusive degrees of freedom in nuclei. Here is the mass of the nucleus A, and and are the square of invariant momentum transfer and the energy transferred to the nucleus in its rest frame. Since no such quark can be produced by QCD dynamics confined to a single nucleon without inter-nucleon interactions, probing superfast quarks requires direct interplay between QCD and nuclear dynamics. One of the earliest theoretical studies of superfast quarks Frankfurt and Strikman (1988) showed that the nuclear dynamics responsible for the generation of such quarks is significantly short-range, thus opening a new window into the high-density realm of nuclear forces. Such dynamics include multi-nucleon short-range correlations Frankfurt and Strikman (1988); Sargsian et al. (2003); Freese et al. (2015); Fomin et al. (2017), explicit quark degrees of freedom such as 6-quark clusters Pirner and Vary (1981); Carlson and Lassila (1995), or single-quark momentum exchanges between strongly correlated nucleons Sargsian (2007).
One way of probing superfast quarks experimentally is the extraction of the nuclear structure function in deep inelastic scattering (DIS) from nuclei at Frankfurt and Strikman (1988); Sargsian et al. (2003); Pirner and Vary (1981). Such studies are part of the physics program of the 12 GeV energy upgraded Jefferson Lab Arrington et al. (2006). Superfast quarks can also be probed in more unconventional processes such as semi-inclusive nuclear DIS processes with tagged spectator nucleons Melnitchouk et al. (1997); Cosyn and Sargsian (2011, 2017), DIS production in the forward direction with or, large transverse momentum dijet production in reactions at LHC kinematics Freese et al. (2015). All such processes will probe QCD dynamics in extreme nuclear conditions with the potential of opening up uncharted territory for nuclear QCD.
So far only three experiments have attempted to probe nuclear quark distributions at . The first was carried out by the BCDMS collaboration at CERN Benvenuti et al. (1994), which measured the inclusive deep-inelastic scattering cross section on 12C at GeV2. The second experiment was performed by the CCFR collaboration at Fermi Lab Vakili et al. (2000), measuring neutrino and antineutrino charged current interactions from a 56Fe target at GeV2. Finally, the third experiment was performed more recently at Jefferson Lab Fomin et al. (2010), where inclusive scattering cross section was measured at moderate values of GeV2.
With the data of these experiments available, the main motivation of our work is to investigate how these three results are related to each other through the QCD evolution equation of nuclear partonic distribution functions. To carry out this study, we derive the QCD evolution equation for the nuclear structure function and calculate the evolution of the Jefferson Lab data up to the range of the BCDMS and CCFR experiments.
The outline of the paper is as follows: in Sec. II we first give a brief description of the available experiments and quantify the existing discrepancy between the BCDMS and CCFR data. Since the JLab data was taken at moderate values of , an important issue in the analysis in the high- region is the accounting of finite target mass (TM) and higher twist (HT) effects. Therefore, the TM and HT corrections procedure adopted by the JLab experiment is also described in Sec. II. In Sec. III, we present the derivation of the QCD evolution equation for nuclear targets and obtain the self-consistent integro-differential equation for the nuclear structure function of . Then in Sec. IV, the numerical solution of the evolution equation is obtained for the structure function parameterization obtained in Ref. Fomin et al. (2010) from the JLab data. In Sec. V, we return to the issue of TM and HT corrections presenting a different approach in accounting for these effects and presenting a new fit for the JLab structure function. Our new fit indicates surprisingly small HT effects which we attribute to quark-hadron duality effects amplified by the Fermi motion of bound nucleons in the nucleus. Our new fit does not alter the conclusion we obtained in Sec. IV using the parametrization from Ref. Fomin et al. (2010). However, it provides an improved description of the experimental data for over a wide range. For practical purposes in Sec.VI we present a simple parameterization of the parameters that allows estimation of the structure function over a wide range of relevant to LHC and EIC kinematics. In Sec. VII, we check the accuracy of our calculations against next-to-leading order corrections, and finally Sec .VIII states the summary and conclusion of our work.
II Experimental Evidence for Superfast Quarks
The first attempt to probe superfast quarks was made by the BCDMS collaboration Benvenuti et al. (1994) in measuring the nuclear structure function in deep-inelastic scattering of 200 GeV muons from a 12C target. The experiment covered the region of GeV2 and , for the first time extracting the structure function for values of , and GeV2 at , , , , and . For these regions the per-nucleon was fit to the form
| (1) |
obtaining for the slope factor. Such an exponent required a larger strength in the high momentum distribution of nucleons in nuclei than the simple mean-field Fermi momentum distribution can provide. However the amount of short-range correlations (that generate the high momentum strength) needed to agree with the data was very marginal.
The second experiment was done by the CCFR collaboration Vakili et al. (2000) using neutrino and antineutrino beams and measured the per nucleon structure function for 56Fe in the charged current sector for GeV2 and . The experiment did not measure the absolute magnitudes of , but obtained the slope of the distribution in the form of Eq. (1), with the exponent being evaluated as . This result was in clear contradiction with the BCDMS result, requiring a much larger high-momentum component in the wave function of the 56Fe nucleus. The required high-momentum component was much larger than the one deduced from quasi-elastic electroproduction in the region Frankfurt et al. (1993); Egiyan et al. (2003, 2006); Fomin et al. (2012); Sargsian (2014); McGauley and Sargsian (2011).
Recently, at JLab, the structure function has been measured for a set of nuclei (2H, 3He, 4He, 9Be, 12C, 63Cu, and 197Au) over a wide range of (including ) and (- GeV2) Fomin et al. (2010). The extracted for the highest (- GeV2) data for the 12C target in these measurements were used to check their relation to the BCDMS and CCFR structure functions. For this, in Ref. Fomin et al. (2010) the extracted per nucleon was corrected for target mass (TM) effects using the relation Schienbein et al. (2008):
| (2) |
where and , with the Nachtmann variable and . Here, is the corrected structure function for which the -dependence within the partonic model should come from the evolution equation. The and factors have been evaluated assuming a common dependence of for all nuclei and simple fit for at GeV2.
To relate the extracted at large to the BCDMS and CCFR results, in Ref. Fomin et al. (2010) the -dependence of was fit to the world data, including JLab’s high- GeV2 data, at several values of . The functional form of the fit was chosen to have a term to be consistent with QCD evolution. Then, using this fit, the extracted at GeV2 was extrapolated to the BCDMS and CCFR kinematics at large . This extrapolation Fomin et al. (2010) resulted in the slope factor of for the 12C target indicating that the JLab data are consistent with the BCDMS results, with the latter showing only marginal strength of high-momentum component in the nuclear wave function Benvenuti et al. (1994) (see above discussion).
However, to have the final answer on the relation of the JLab structure functions to the higher- BCDMS and CCFR data, one needs a full account of QCD evolution. To do so, we derive in the following section the QCD evolution equation for superfast quarks in leading order approximation and apply it to , to evolve it to BCDMS and CCFR kinematics.
III Evolution Equation
We start with the leading order evolution equation for quarks in nuclei:
| (3) | |||||
with the goal of calculating the evolution for the per nucleon structure function , defined at leading order as:
| (4) |
where one sums over the flavors of active (anti)quarks. Note that in Eq. (3) the upper limit of the integration is , and thus the integrand in the range of accounts for the contribution of the superfast quarks to the evolution of the partonic distribution probed at a given .
Above, the functions are the -flavor quark and antiquark distributions in nuclei, while represents the nuclear gluon distribution. The splitting functions are:
| (5) |
with and . Here the denominator is the Altarelli-Parisi function, defined as Altarelli and Parisi (1977):
| (6) |
We proceed by changing the integration variable in Eq. (3) to which yields
| (7) | |||||
Substituting the splitting functions of Eq. (5) into the above equation results in:
| (8) | |||||
where
| (9) |
Applying the rule of Eq. (6) into the second integral of Eq. (8), one obtains the final expression for the evolution equation of quarks in the nucleus in the form:
| (10) |
This equation can be used to obtain the evolution equation for the structure function defined according to Eq. (4). Multiplying both sides above by and summing by contribution of all (anti)quarks one obtains the evolution equation for the nuclear structure function in the form
| (11) |
where and . One interesting property of the above equation which has a nuclear origin is the factor which introduces a non-trivial A dependence into the evolution equation. The effect of this term can be observed for light nuclei at large kinematics.
IV Evolution of from moderate to high
At large , we can safely neglect the gluonic distribution in Eq. (11), after which the evolution of the structure function at given (,) will be defined by the same structure function at and some initial . Such a situation allows us to relate the structure functions at high (BCDMS and CCFR) kinematics to the same structure function at moderate- (JLab) kinematics using Eq. (11), without requiring the knowledge of the nuclear gluonic distribution .
To do so, first, we use as an input to Eq. (11) the same parametrization of at GeV2 J. Arrington and N Fomin, Private Communcation for the 12C nucleus that was used in the high- and high- extrapolation of Ref. Fomin et al. (2010) (referred to hereafter as QCD evolution with F-A fit). With this input, Eq. (11) is solved numerically, covering the range of - GeV2. The TM-uncorrected is then obtained from by reintroducing target mass effects according to Eq. (2).
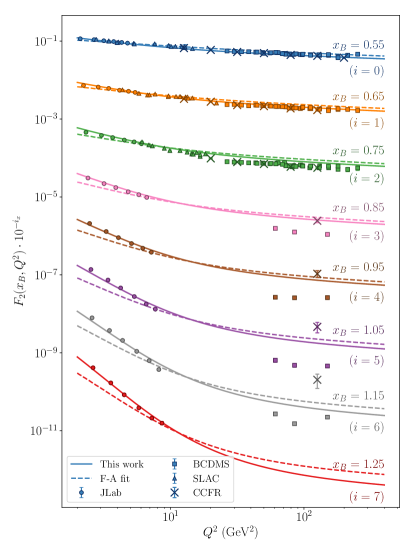
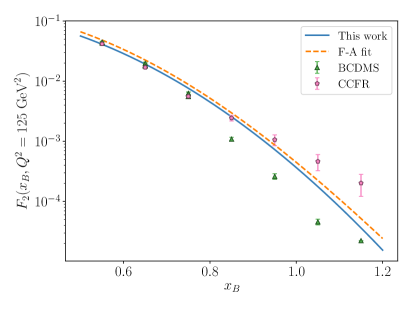
The result of the calculations is given by the dashed curves in Figs. 1 and 2, along with experimental data and SLAC “pseudodata.” The JLab Fomin et al. (2010) and BCDMS Benvenuti et al. (1987, 1994) data are measurements of the structure function per nucleon, whereas the SLAC pseudodata are obtained according to Ref. Fomin et al. (2010) by multiplying deuteron measurements Whitlow et al. (1992) by the EMC ratio measured in Ref. Gomez et al. (1994). The CCFR data at were given without an absolute normalization Vakili et al. (2000), so in Fig. 1 the point was normalized to the previous CCFR measurement at , for which the absolute values have been measured Seligman et al. (1997). Note that the discrepancy between the dashed curves in Fig. 1 and the low- JLab data is due to the fact that F-A parameterization is fitted in the GeV2 region only.
As the figure shows, the F-A parameterization extended to the high- domain of the CCFR and BCDMS experiments ( GeV2) through QCD evolution does not prefer the BCDMS data as the phenomenological extrapolation of Ref. Fomin et al. (2010) had indicated. In fact, QCD evolution of JLab data shows better agreement with the CCFR data at , and results in a slope factor for the range of .
V The Parameter Fitting of JLab Data
Even though QCD evolution of the F-A parameterization predicts a softer dependence for at GeV2 than the extrapolation quoted in Ref. Fomin et al. (2010) (, compared to ), it overestimates the data at and GeV2 where structure functions are reliably measured (see the three data sets and the dashed curves in the upper part of Fig. 1). Additionally the QCD evolution underestimates the data at higher and GeV2 (see dashed curves in Fig. 1). In the latter case, the underestimation at low is due to the fact that only GeV2 data have been used to fit the extracted structure function in the F-A parameterization. The other discrepancies can be attributed to the specific model of target mass corrections adopted in Ref. Fomin et al. (2010) (cf. Eq. (2), as well as Ref. Schienbein et al. (2008)). As was discussed in the previous section, after applying QCD evolution to the structure function the target mass effects are reapplied to compare the evolved results with the empirical data. We find that the dependence introduced by the factor of in Eq. (2) partially cancels out the dependence introduced by evolution, thus giving the final result a softer dependence.
To address the problem of these discrepancies we consider a different approach to target mass corrections. In the new approach the Nachtmann variable is treated as a scaling parameter, representing the light cone momentum fraction variable instead of . Within such an approach, enters into the QCD evolution equations, and no additional target mass corrections are applied to the data. It is worth mentioning that such an approach is justified at leading order, where -scaling corresponds to the target mass correction in the collinear approximation Aivazis et al. (1994). That such an approach is justified follows also from the empirical observation in Ref. Fomin et al. (2010) that the raw (uncorrected) data plotted as a function of exhibit better scaling properties than the data corrected according to Eq. (2).
Within such an approach we analyzed the uncorrected JLab data considering the structure function as a function of and attempting to parameterize it in the form Accardi et al. (2010):
| (12) |
where the ”LT” indicates the leading twist contribution to the structure function, which can be used as an input for the evolution equation. The latter is parametrized at an initial scale as
| (13) |
in the range of . The value of at other scales is obtained by applying the evolution equation of Eq. (11) to Eq. (13). To fit the parameters of Eqs. (12) and (13), we used all the JLab data with .
We employed three different strategies to perform the fit. The first was to use differential evolution Storn and Price (1997), a multidimensional optimization method in which a population of candidate solutions can mutate and evolve, and in which the population members with the best “fitness” (e.g., the lowest values) are combined to produce new candidate solutions. In this, we use the of the fit as the fitness function. The second strategy was to use the standard MINUIT2 library functions with a fit function. Lastly, the third was a bootstrap method, in which we generated populations by sampling the data points from a Gaussian with a center and width determined by their experimental values and statistical errors. For each of these populations, a fit was performed using MINUIT2, and subsequently the distributions of the fit parameters were used to determine their averages and standard deviations. In all three cases, the fitness parameter () was determined using only the statistical, and not the systematic, errors of the data reported in Ref. Fomin et al. (2010), as the systematic errors are dominated by beam energy and detector setting uncertainties, and are hence expected to be highly correlated.
Using all three strategies, we first performed fits to the full six-parameter form of Eq. (12). We then performed fits without a higher-twist correction, i.e., with the form of Eq. (13) only. We found with all three strategies that the six-parameter fit did not yield significant improvement in the value compared to the three-parameter fit. Moreover, in the six-parameter fit, the central parameter values varied wildly with small changes in the data set used for the fit, but generally preferred small values of . On the other hand, the three-parameter fit without the HT factor yielded very robust results for the parameters, with central values, standard errors, and covariances comparable between the three approaches. We therefore select the three parameter fit as the optimal one.
| Diff. Evol. | |||
|---|---|---|---|
| MINUIT2 | |||
| Bootstrap |
The results for the parameters for GeV2, along with their standard errors are presented in Tab. 1.
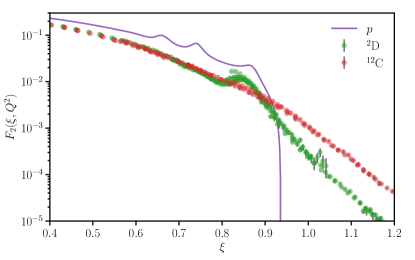
Our observation of the negligible contribution from the higher twist effects can be understood based on a combination of quark-hadron duality and Fermi motion effects which results in a nearly-complete cancellation of the higher-twist effects for the 12C nucleus (see also Ref.Moffat et al. (2019)). Usually, quark-hadron duality for the proton structure function is observed when the structure function is smeared over some range of final produced mass (see e.g. Melnitchouk et al. (2005)). For a nuclear target, this smearing is inherently accomplished by the Fermi motion of the nucleons within the nucleus. To demonstrate this, we compare in Fig. 3 the structure functions for GeV2 (which is close to our choice of ) for the deuteron, 12C, and a phenomenological parametrization of the proton Bodek et al. (1979). While one observes resonance structures in the proton and deuteron structure functions, these effects are significantly suppressed in the 12C data. We expect that this effect will be even more significant for heavier nuclei, which gives a new possibility for quality fitting of nuclear DIS structure functions at high .
With the parameters quoted in Tab. 1, we have reconstructed the leading-twist structure function according to Eq. (13) at GeV2, and evolved it to all other using the evolution equation (11). With this procedure, we calculate the structure function at CCFR and BCDMS kinematics. In Figs. 1 and 2, the solid curves represent the results of this calculation. The parameter errors were also propagated into at these kinematics and included as shaded bands in the plot, but these bands cannot be seen because they are smaller than the line width of the curves. (Note the small standard errors quoted in Tab. 1). As the comparison shows, QCD evolution now describes the and data at high very well, while slightly overestimating the data at high . Note that the dashed curves in Figs. 1 and 2 represent the result of QCD evolution in which as an input we used the F-A fit at GeV2 from Ref.Fomin et al. (2010).
For the slope factor, we obtain for and GeV2. This result is practically the same one obtained from evolution of the F-A parametrization. Thus one concludes that our overall result for the nuclear structure function is somewhat between the CCFR () and BCDMS () estimates, while the absolute magnitude of is closer to the CCFR data at . Remind that phenomenological extrapolation of parameterizationFomin et al. (2010) resulted in the slope factor favoring the BCDMS result.
VI QCD Evolution Based Fit of
The success of the QCD evolution equation in describing the structure function data below and above GeV2 motivates us in presenting in a parametric form that covers the whole considered range starting GeV2 and . Such a fit can be used for evaluating nuclear DIS cross sections in a wide range of kinematics relevant for 12 GeV JLab and EIC physics.
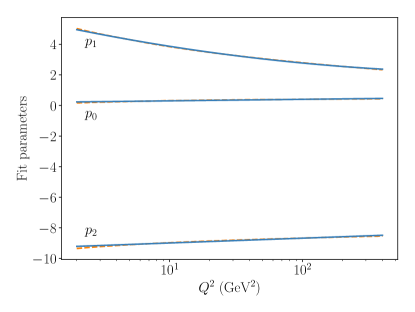
In performing such a fit we again used the analytic form of Eq. (13), where the parameters , and are determined on a per value basis by fitting the values of as determined by QCD evolution. Because of the QCD evolution, these parameters are inherently dependent, and we express this dependence in a simple polynomial fit in the variable as follows:
| (14) |
The central values of the and parameters are presented in Table 2. Fig. 4 also shows both the dependence of the , and parameters and the results of the polynomial fit.
| 0.201 | 0.043 | 5.504 | - 0.828 | 0.051 | -9.309 | 0.137 |
Here one observes very smooth dependence consistent with the above observation of negligible higher twist effect for nuclear . We expect this parametrization of to be valid for up to 400 GeV2, the maximum value to which we performed QCD evolution, and it gives a simple way of estimating cross sections for deep inelastic scattering in the superfast quark region.
VII NLO Corrections
To estimate the accuracy of the leading order (LO) evolution equation presented in Figs. 1 and 2, we have also evolved the fit of obtained in Sec. V at next-to-leading order (NLO).
To perform NLO evolution, we make similar approximations to those described in Sec. III. We neglect the gluon distribution, since this is small at . At NLO, the quark splitting functions have non-diagonal terms, and the splitting functions for singlet and non-singlet mixtures become different (see, e.g., Ellis et al. (1996)). We take advantage of the fact that 12C is isospin symmetric, and evolve as a singlet distribution (within the approximation where gluons are neglected).
Additionally, at NLO, Eq. (4) is no longer exact, but must be determined from the quark distributions through a Mellin convolution with the NLO Wilson coefficients. One can still evolve directly, however, by folding these Wilson coefficients into the splitting functions. In Ref. Miyama and Kumano (1996), this is described as a “one-step” method. We perform such a one-step method in our NLO evolution of .
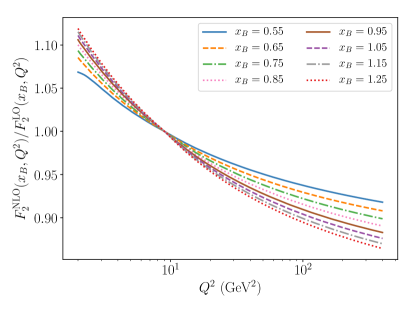
Since we are using NLO evolution primarily to estimate the accuracy of LO evolution, we present in Fig. 5 the ratio of NLO-evolved to LO-evolved , with the parametrization (13) and the parameters in Tab. 2 at GeV2 as a common starting point. The choice of is justified by the fact that it corresponds to the largest data measured at JLab experiment and we achieved a reasonable description of the extracted from these data. All lines thus intersect in the figure at , with a ratio of . One can see from this figure that the amount of evolution that occurs is enhanced by NLO corrections, and this enhancement results in a greater suppression of for larger . In fact, when GeV2, NLO corrections are as much as . Such a correction however does not alter our conclusion that the QCD evolution of JLAB data results in a that favors CCFR at and predicts magnitudes somewhat in the middle of CCFR and BCDMS data at .
However, NLO corrections can be sizable enough that they will be necessary to account for to make precision predictions in larger- regions relevant to the LHC and the anticipated EIC kinematics. A detailed study of NLO evolution to such high- regimes will be performed in a future work.
VIII Summary and Conclusions
We derived the evolution equation for superfast quarks in nuclei in the leading order approximation. For the structure function at high , in an approximation in which the gluon distribution is neglected, QCD evolution allows high- values of to be determined by the same measured at some initial value of . Using this property and the parameterization of at moderate GeV2, we fit a parametric form to the Jefferson Lab data and used the evolution equation to calculate in the range of GeV2, at which the previous measurements of superfast quark distributions have been made. Our approach uses the QCD evolution equation directly to determine nuclear structure functions at large . This approach has an advantage over modeling of nuclear structure functions based on a convolution of the free nucleon structure function and nuclear dynamics. In the latter case one deals with uncertainties inherent to the models, where different nuclear effects such as Fermi motion of nucleons, medium modification of nucleon PDFs and possible final state interactions should be taken into account.
Our calculation demonstrates that the JLab high-precision, moderate- measurement of the 12C structure function is in better agreement with the CCFR data at GeV2 and with the slope factor indicating a sizable contribution of the high-momentum nuclear component in the generation of superfast quarks. Our results at is somewhat in the middle of CCFR and BSDMS results of nuclear structure function data.
Acknowledgements.
We are thankful to Drs. John Arrington and Nadia Fomin for numerous discussions and providing results of their analysis and the fit of the Carbon structure function of their Jefferson Lab experiment, and to Drs. Matthew Dietrich and Jannes Nys for discussions on fitting strategies. This work is supported by U.S. DOE grant under contract DE-FG02-01ER41172. Also, AF was supported by the U.S. Department of Energy, Office of Science, Office of Nuclear Physics, contract no. DE-AC02-06CH1135 and an LDRD initiative at Argonne National Laboratory under Project No. 2017-058-N0.References
- Eskola et al. (2017) K. J. Eskola, P. Paakkinen, H. Paukkunen, and C. A. Salgado, Eur. Phys. J. C77, 163 (2017), eprint 1612.05741.
- Kovarik et al. (2016) K. Kovarik et al., Phys. Rev. D93, 085037 (2016), eprint 1509.00792.
- Owens et al. (2013) J. F. Owens, A. Accardi, and W. Melnitchouk, Phys. Rev. D87, 094012 (2013), eprint 1212.1702.
- Aubert et al. (1983) J. J. Aubert et al. (European Muon), Phys. Lett. 123B, 275 (1983).
- Frankfurt and Strikman (1988) L. L. Frankfurt and M. I. Strikman, Phys. Rept. 160, 235 (1988).
- Geesaman et al. (1995) D. F. Geesaman, K. Saito, and A. W. Thomas, Ann. Rev. Nucl. Part. Sci. 45, 337 (1995).
- Arneodo et al. (1988) M. Arneodo et al. (European Muon), Phys. Lett. B211, 493 (1988).
- Frankfurt et al. (1990) L. L. Frankfurt, M. I. Strikman, and S. Liuti, Phys. Rev. Lett. 65, 1725 (1990).
- Brodsky and Lu (1990) S. J. Brodsky and H. J. Lu, Phys. Rev. Lett. 64, 1342 (1990).
- Frankfurt et al. (2012) L. Frankfurt, V. Guzey, and M. Strikman, Phys. Rept. 512, 255 (2012), eprint 1106.2091.
- Sargsian et al. (2003) M. M. Sargsian et al., J. Phys. G29, R1 (2003), eprint nucl-th/0210025.
- Freese et al. (2015) A. J. Freese, M. M. Sargsian, and M. I. Strikman, Eur. Phys. J. C75, 534 (2015), eprint 1411.6605.
- Fomin et al. (2017) N. Fomin, D. Higinbotham, M. Sargsian, and P. Solvignon, Ann. Rev. Nucl. Part. Sci. 67, 129 (2017), eprint 1708.08581.
- Pirner and Vary (1981) H. J. Pirner and J. P. Vary, Phys. Rev. Lett. 46, 1376 (1981).
- Carlson and Lassila (1995) C. E. Carlson and K. E. Lassila, Phys. Rev. C51, 364 (1995), eprint hep-ph/9401307.
- Sargsian (2007) M. M. Sargsian, Nucl. Phys. A782, 199 (2007).
- Arrington et al. (2006) J. Arrington, D. Day, N. Fomin, and P. Solvignon (spokespersons) (2006), pR12-06-105, URL https://www.jlab.org/exp_prog/proposals/06/PR12-06-105.pdf.
- Melnitchouk et al. (1997) W. Melnitchouk, M. Sargsian, and M. I. Strikman, Z. Phys. A359, 99 (1997), eprint nucl-th/9609048.
- Cosyn and Sargsian (2011) W. Cosyn and M. Sargsian, Phys. Rev. C84, 014601 (2011), eprint 1012.0293.
- Cosyn and Sargsian (2017) W. Cosyn and M. Sargsian, Int. J. Mod. Phys. E26, 1730004 (2017), eprint 1704.06117.
- Benvenuti et al. (1994) A. C. Benvenuti et al. (BCDMS), Z. Phys. C63, 29 (1994).
- Vakili et al. (2000) M. Vakili et al. (CCFR), Phys. Rev. D61, 052003 (2000), eprint hep-ex/9905052.
- Fomin et al. (2010) N. Fomin et al., Phys. Rev. Lett. 105, 212502 (2010), eprint 1008.2713.
- Frankfurt et al. (1993) L. Frankfurt, M. Strikman, D. Day, and M. Sargsian, Phys.Rev. C48, 2451 (1993).
- Egiyan et al. (2003) K. S. Egiyan et al. (CLAS), Phys. Rev. C68, 014313 (2003), eprint nucl-ex/0301008.
- Egiyan et al. (2006) K. S. Egiyan et al. (CLAS), Phys. Rev. Lett. 96, 082501 (2006), eprint nucl-ex/0508026.
- Fomin et al. (2012) N. Fomin, J. Arrington, R. Asaturyan, F. Benmokhtar, W. Boeglin, et al., Phys.Rev.Lett. 108, 092502 (2012), eprint 1107.3583.
- Sargsian (2014) M. M. Sargsian, Phys. Rev. C89, 034305 (2014), eprint 1210.3280.
- McGauley and Sargsian (2011) M. McGauley and M. M. Sargsian (2011), eprint 1102.3973.
- Schienbein et al. (2008) I. Schienbein et al., J. Phys. G35, 053101 (2008), eprint 0709.1775.
- Altarelli and Parisi (1977) G. Altarelli and G. Parisi, Nucl. Phys. B126, 298 (1977).
- (32) J. Arrington and N Fomin, Private Communcation.
- Benvenuti et al. (1987) A. C. Benvenuti et al. (BCDMS), Phys. Lett. B195, 91 (1987).
- Whitlow et al. (1992) L. W. Whitlow, E. M. Riordan, S. Dasu, S. Rock, and A. Bodek, Phys. Lett. B282, 475 (1992).
- Gomez et al. (1994) J. Gomez et al., Phys. Rev. D49, 4348 (1994).
- Seligman et al. (1997) W. G. Seligman et al., Phys. Rev. Lett. 79, 1213 (1997), eprint hep-ex/9701017.
- Aivazis et al. (1994) M. A. G. Aivazis, F. I. Olness, and W.-K. Tung, Phys. Rev. D50, 3085 (1994), eprint hep-ph/9312318.
- Accardi et al. (2010) A. Accardi, M. E. Christy, C. E. Keppel, P. Monaghan, W. Melnitchouk, J. G. Morfin, and J. F. Owens, Phys. Rev. D81, 034016 (2010), eprint 0911.2254.
- Storn and Price (1997) R. Storn and K. Price, Journal of Global Optimization 11, 341 (1997), ISSN 1573-2916, URL https://doi.org/10.1023/A:1008202821328.
- Schutz et al. (1977) W. P. Schutz et al., Phys. Rev. Lett. 38, 259 (1977).
- Rock et al. (1992) S. Rock et al., Phys. Rev. D46, 24 (1992).
- Lung (1992) A. Lung, Ph.D. thesis, American University (1992), uMI-AAT 9322579.
- Arrington et al. (1999) J. Arrington et al., Phys. Rev. Lett. 82, 2056 (1999), eprint nucl-ex/9811008.
- Bodek et al. (1979) A. Bodek et al., Phys. Rev. D20, 1471 (1979).
- Moffat et al. (2019) E. Moffat, T. C. Rogers, W. Melnitchouk, N. Sato, and F. Steffens (2019), eprint 1901.09016.
- Melnitchouk et al. (2005) W. Melnitchouk, R. Ent, and C. Keppel, Phys. Rept. 406, 127 (2005), eprint hep-ph/0501217.
- Ellis et al. (1996) R. K. Ellis, W. J. Stirling, and B. R. Webber, Camb. Monogr. Part. Phys. Nucl. Phys. Cosmol. 8, 1 (1996).
- Miyama and Kumano (1996) M. Miyama and S. Kumano, Comput. Phys. Commun. 94, 185 (1996), eprint hep-ph/9508246.