Method for detection and reconstruction of gravitational wave transients
with networks of advanced detectors.
Abstract
We present a method for detection and reconstruction of the gravitational-wave (GW) transients with the networks of advanced detectors. Originally designed to search for transients with the initial GW detectors, it uses significantly improved algorithms, which enhances both the low-latency searches with rapid localization of GW events for the electro-magnetic followup and high confidence detection of a broad range of the transient GW sources. In the paper we present the analytic framework of the method. Following a short description of the core analysis algorithms, we introduce a novel approach to the reconstruction of the GW polarization from a pattern of detector responses to a GW signal. This polarization pattern is a unique signature of an arbitrary GW signal that can be measured independent from the other source parameters. The polarization measurements enable rapid reconstruction of the GW waveforms, sky localization and helps identification of the source origin.
pacs:
04.80.Nn, 07.05.Kf, 95.55.Ym, 04.30.Db]Dated:
I Introduction
Advanced LIGO detectors TheLIGOScientific:2014jea has started their operation at unprecedented sensitivity targeting first detection of gravitational waves from astrophysical sources. A more robust detection of gravitational waves is anticipated in the next few years as the advanced LIGO reaches its designed sensitivity and the other advanced detectors Virgo Virgo , Kagra kagra and LIGO-India LIGOIndia come online. Numerous GW signals, expected to be observed by the advanced detectors ( binary neutron star and possible black hole mergers per year ExpRates ) will begin our exploration of the gravitational-wave sky and start the era of the gravitational wave astronomy.
The advanced detectors target detection of GW transients for a wide range of promising astrophysical sources including: various types of gamma-ray bursts, core-collapse supernovae, soft-gamma repeaters, cosmic strings, late inspiral and mergers of compact binaries, ring-downs of perturbed neutron stars or black holes, and as-yet-unknown systems. Most of these sources are difficult to model, due to their complicated dynamics and because the equation of state of matter at neutron star densities is not known. Therefore, the search algorithms have been developed klimenko:2008kymm ; Xpipeline ; STAMP ; oLIB for detection of GW transients, or bursts of GW radiation in the detector bandwidth, with no or little assumptions on the source models.
There are two different ways the GW searches are conducted: in real time and searches on the archived data. The objective of the real time burst search is the identification and reconstruction of significant event candidates with low latency (within few minutes). The reconstructed sky location can be promptly shared with the partner telescopes, which search for a coincident electromagnetic (EM) counterpart Abbott:2011ys ; Aasi:2013sna . A prominent source for such join observation is a merger of compact binary objects where one of the companions (or both) is a neutron star. Such mergers may produce several EM signals: gamma-ray busts (GRB), GRB afterglow, kilonova, etc, which will fade away with the time scales ranging from seconds to days kilonova:2012mb . A small fraction of such mergers (when the GRB beam is pointing at us) can be independently detected by the gamma-ray telescopes and associated with a GW signal by the time of the event. However, most of the compact binary mergers require a prompt sky localization with the GW detectors and follow-up EM searches for possible afterglow. Similar observations can be performed for the galactic events such as supernovae or soft-gamma-repeaters, which may produce both the EM and neutrino counterparts. On contrary, the objective of the archived burst analysis is to establish a significance of observed events and identify their progenitors. Such analysis requires detail background studies and accurate reconstruction of the source parameters, which may not be readily available with low latency.
Both types of searches and the sky localization studies have been performed with the baseline burst algorithm coherent WaveBurst (cWB) klimenko:2008kymm used in the analysis of data form the initial instruments Online1 ; IMBBH0 ; Burst1 ; IMBBH1 ; Burst2 ; IMBBH2 ; Klimenko:2011sky . In this paper we describe the improvements of the cWB algorithm, which is currently used both for the real time burst search and several archived searches with the networks of advanced detectors. This second generation cWB algorithm includes several novelties. The time-frequency analysis has been updated with a novel time frequency transform WDM , which improved the waveform reconstruction. It also significantly improved the computational performance of the algorithm, enabling a robust low latency operation. The data conditioning (whitening, removal of the spectral artifacts, etc) has been enhanced with the data regression algorithms Tiwari:2015tkm . Fast reconstruction of the chirp mass Tiwari:2015chirp has been introduced to enable rapid identification of the compact binary coalescence (CBC) sources. The extensive sky localization studies have been performed aLIGOskyloc .
In this paper we focus on the cWB analytic framework enhanced with a novel method for reconstruction of the GW polarization from the pattern of detector responses to a GW signal. It significantly simplifies the solution of the inverse problem in the burst analysis and enables weakly modeled burst searches with the polarization constraints.
The paper is organized as follows. Section II gives introduction into the coherent network analysis, required to introduce in section III the dual stream likelihood analysis and the polarization pattern. In sections IV we describe how it can be used to construct network regulators - the model independent constraints used in the cWB analysis.
II Overview
A data from a network of detectors is presented as discrete series in the most general time-frequency (TF) domain, where is the detector index in the network and is the data sampling (TF pixel) index. The real TF series are obtained from the detector time series with the WDM transform WDM . The data is conditioned to remove spectral features, such as violin, power and mechanical lines Tiwari:2015tkm .
A detector noise (assuming to be Gaussian) is described by the WDM power spectral density estimated for every data sample. Therefore, is a TF series as well, which is convenient for the characterization of a quasi-stationary noise typical for real detectors. The noise-scaled (whitened) data is defined as .
The whitened TS series from all detectors are combined to obtain the energy TF maps , where are maximized over all possible time-of-flight delays in the network. The energy maps are used to identify TF areas (cluster , ) with the excess energy above the baseline detector noise. The TF clusters, identified with an appropriate clustering algorithm, define the burst events, which are analyzed to extract the signal waveform, polarization and sky location (inverse problem).
II.1 Formulation of the inverse problem for bursts
The data vector recorded by a network of GW detectors at the time of a gravitational-wave signal with the source sky location at and is a superposition of the network response and noise :
| (1) |
where the and are the amplitudes of the two GW polarization components and is the network antenna pattern matrix
| (2) |
The antenna patterns often include a transformation by the polarization angle . But this transformation is equivalent to a rotation of the wave frame where the vector is defined. The network response is -invariant and, therefore, the polarization angle can be included in the definition of .
To solve the inverse problem one should find the amplitudes of the GW polarization components and the sky coordinates from a coincident output of several GW detectors. Initially this problem was considered by Gursel and Tinto GT for a network of three detectors. A more solid statistical foundation of the problem was presented by Flanagan and Hughes FH , who considered a likelihood method for the estimation of the signal parameters. They define the likelihood ratio
| (3) |
where is a parameter set describing the signal, the is the joint probability that the data is only instrumental noise, and is the joint probability that a GW signal is present in the data . The sample index is omitted to stress that , where is a collection of the TF pixels (cluster).
The explicit form of the likelihood ratio is determined by the noise model and by the signal model . For un-modeled burst signals , which can be found by analytical or numerical variation of . The advantage of the likelihood method is that it allows introduction of the signal and noise models, and can be applied to an arbitrary detector network.
II.2 Un-constrained likelihood analysis
This section presents the solution of the inverse problem assuming that the burst parameter set is not constrained by a source model and the noise of detectors in the network is quasi-stationary and Gaussian with the power spectral densities . The noise-scaled data vector is than
| (4) |
where the detector amplitudes take into account the time-of-flight delays depending upon the source coordinates and . Respectively, the noise-scaled network response vector is
| (5) |
where is the noise-scaled antenna pattern matrix
| (6) |
We also introduce the network matrix , which is obtained from by the transformation to the Dominant Polarization Frame (DPF) introduced by Klimenko et al klimenko:2005kmrm .
The likelihood functional is defined as twice the logarithm of the likelihood ratio
| (7) |
where the inner products and are calculated over the TF cluster.
The solution for the GW waveforms is found by variation of the likelihood functional L[h]. It is convenient to introduce the antenna pattern vectors and , which are simply the columns of the matrix and satisfy the DPF conventions: and . These two vectors define a network plane where the GW response vector must be located. The likelihood variation gives a system of linear equations for the amplitudes and (also defined in the DPF)
| (8) |
where and are the unit vectors along and respectively. Note, the matrix in Eq. 8 characterizes the network sensitivity to the two GW polarizations. The maximum likelihood ratio statistic is calculated by substituting the solutions into . The result can be written as
| (9) |
where the matrix is the projection constructed from the components of the unit vectors and :
| (10) |
The kernel of the projection is the network plane defined by these two vectors. The null space of the projection defines the residual detector noise, which is referred to as the null stream.
II.3 Reconstructed network response
The maximum likelihood ratio statistic is a quadratic form (see Eq. 9), which can be split into the incoherent and coherent parts
| (11) | |||
| (12) |
These coherent statistics, together with the energy of the null stream , are widely used in the burst searches for the construction of the event selection cuts. For example, the network correlation coefficient klimenko:2008kymm
| (13) |
provides a powerful event consistency test to distinguish genuine GW events () from spurious events () produced by the detectors. The statistic (coherent energy) is particularly important because it depends on the cross-correlation terms between the detector pairs. It is used for the construction of the burst detection statistic
| (14) |
which is an estimator of the network coherent signal-to-noise ratio for correlated GW signals recorded by different detectors.
The coherent statistics are very beneficial for the burst analysis, provided they are correctly constructed to address the “two-detector paradox” 2Dparadox . Namely, for any network of two detectors the cross terms of the projection operator (Eq. 10) are always equal to zero, or . Clearly, for two co-aligned detectors with the identical detector responses this is not true, which constitutes the two-detector paradox.
The origin of the “two-detector paradox” is the ambiguity of the projection operator. The likelihood is invariant with respect to the rotation in the network plane where any two orthogonal unit vectors can be used for the construction of the projection . Therefore, we select two such unit vectors and that the likelihood component corresponding to the vector vanishes and the projection can be omitted. The and the coherent statistics are given by the projection
| (15) |
which resolves the two-detector paradox. The vectors define the reconstructed network response
| (16) |
which components are the un-constrained likelihood estimators of the noise-scaled detector responses.
III Dual stream likelihood analysis
As defined in section II a network noise-scaled data stream is . Additionally a quadrature data stream is used. It can be obtained from the original detector data, which is phase-shifted by . The data () defines the network dual data stream conveniently provided by the WDM transform: applied to the detector time-series it generates both data streams. For the un-modeled reconstruction (see section II.2) the analysis can be performed individually for each data stream resulting in the likelihood statistics and . Formally, the quadrature data stream does not contain any new information, nevertheless . This is because for a given time-frequency cluster the quadrature counterparts may have different contributions both from the signal and noise. Therefore, the inclusion of the quadrature stream can improve the collection of the signal energy and, respectively, improve the reconstruction. Also the dual data stream is required for the inclusion of the signal polarization models into the analysis.
III.1 Phase transformation
Each dual data stream sample is presented by the data vectors and . We define a phase transformation to calculate the amplitudes for an arbitrary phase shift :
| (17) | |||
| (18) |
where the individual phase shift is applied to each data sample. In the likelihood functional the same transformation should be applied to the detector responses and . The quadrature likelihood functionals and
| (19) | |||
| (20) |
vary as the phase transformation is applied, however the total likelihood is the phase invariant. There are several distinct phase transformations, two of which are considered below.
In the orthogonal phase transformation (OPT) the phase shift is selected such that the network responses and in the network plane become orthogonal to each other. The OPT pattern is used for calculation of dual stream coherent statistics in Section IV.1.
The polarization phase transformation (PPT) is defined by the scalar products of the network response and the antenna pattern vectors
| (21) |
The purpose of the phase transformations is to obtain the signal polarization patterns. Namely, the wave polarization is captured by the network as a distinct pattern of the GW responses in the network plane, which is revealed when a particular phase transformation is applied.
III.2 Polarization pattern
To describe the polarization state of a generic GW signal the following parameterization of the wave is used:
| (22) | |||
| (23) |
where the instantaneous parameters of the signal are: and are the strain amplitudes, is the polarization angle and is the wave ellipticity. Here and below in the text we omit the sample index . In general, these are the ad-hoc wave parameters, however, they can be related to the astrophysical wave parameters as described in section III.3. For this particular convention, the and are the -phase and -phase network responses and the sign of defines the wave chirality or the sign of the quadruple product . The antenna pattern vectors and are related to the DPF vectors and
| (24) | |||
| (25) |
where and is the DPF angle. The PPT pattern is obtained by application of the transformation 21 to the vectors 22-23. The resulting PPT pattern is described by the following tree vectors oriented along the and
| (26) | ||||
| (27) | ||||
| (28) |
where is the wave amplitude and
| (29) |
The product is the norm of and in Equation 21. The vectors and describe the -phase network response, and the vector describes the -phase network response. By measuring these three vectors for each network data sample, the instantaneous signal parameters , and can be determined.
 |
 |
 |
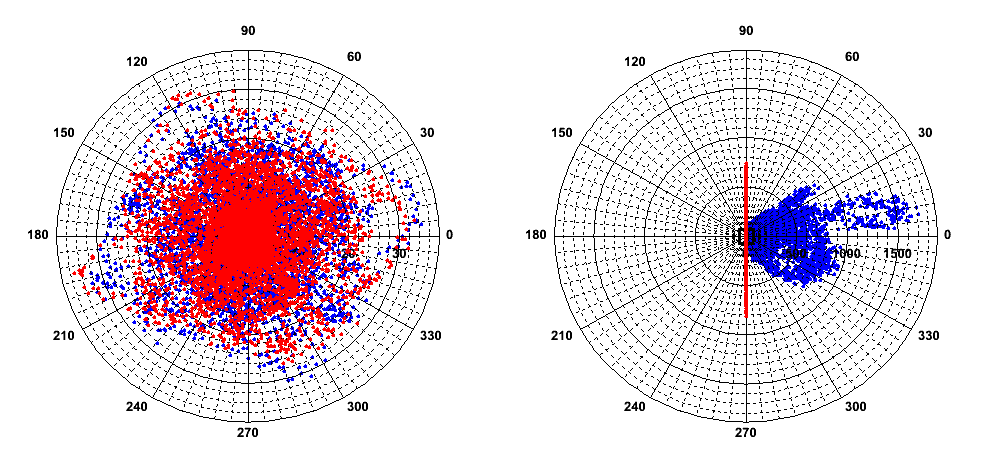 |
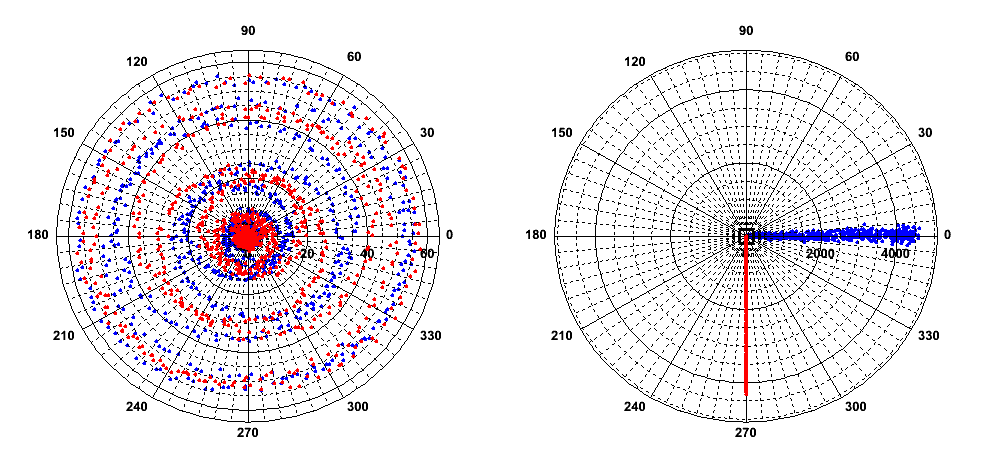
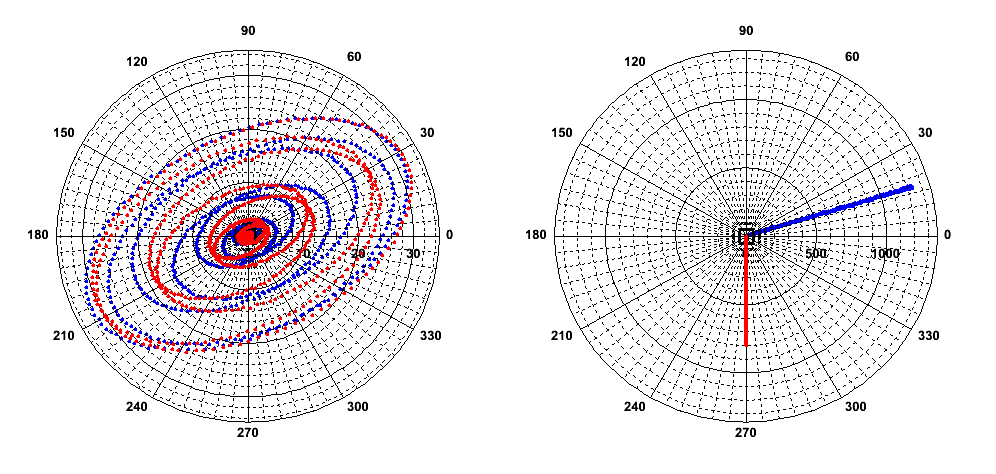
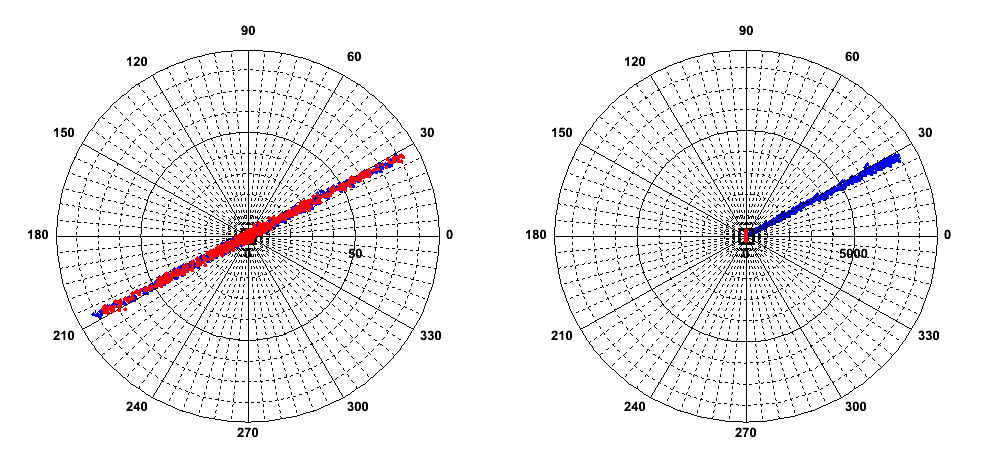
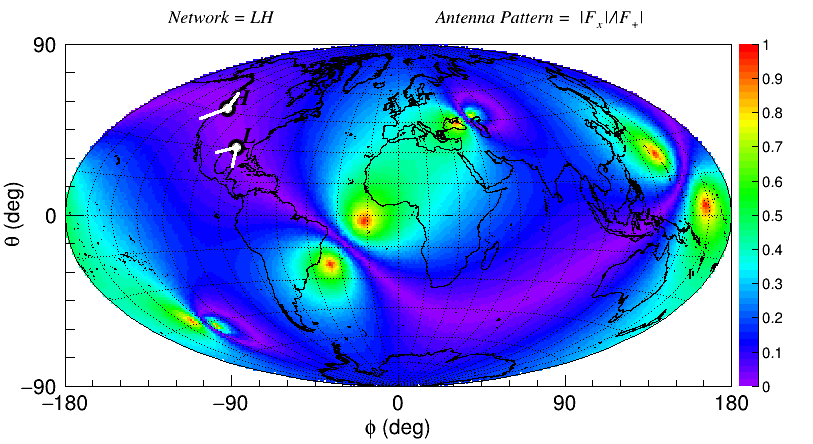
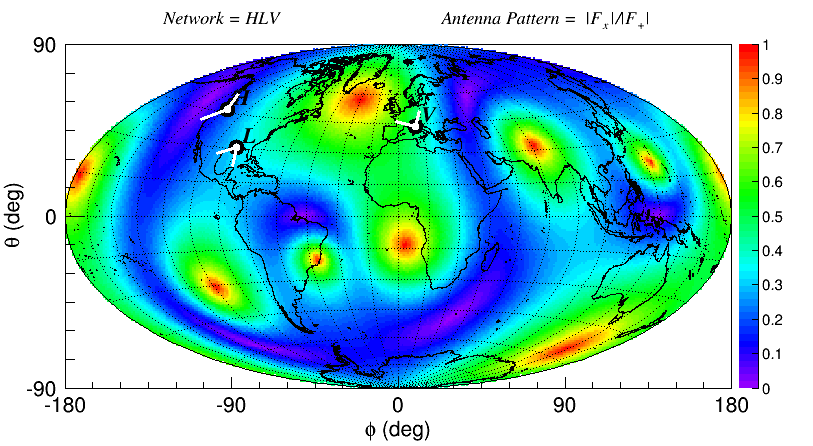
For a given GW event, the collection of vectors {,,} describes its unique polarization pattern. Figure 1 shows the examples of the polarization patterns. However, this pattern can be significantly distorted by the network. For example, the detector noise adds random vectors to the GW responses and randomizes the polarization patterns for a weak GW signal. Also the measured polarization pattern strongly depends on the network alignment factor: . For any practical network , therefore the polarization pattern is always distorted (biased) by the network. The bias correction is straightforward, however, it becomes increasingly inaccurate when . When only the vector can be measured regardless what is the GW polarization state. Namely, the original GW polarization can not be reconstructed from such pattern of the network responses. The network of LIGO detectors has for a significant fraction of the sky (see top Figure 2).
 |
 |
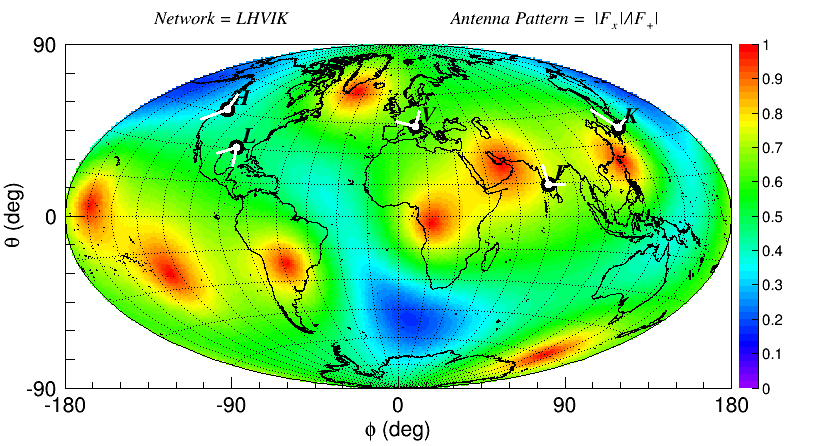 |
Therefore, in most cases the polarization state of a GW signal can not be measured. To improve the polarization coverage, one has to increase the alignment factor by adding more detectors to the network with optimally oriented detector arms (see bottom Figure 2). The full polarization coverage is achieved when is close to unity, which greatly improves and simplifies the reconstruction. In this case, the polarization state of arbitrary GW signal can be un-ambiguously identified from the pattern of the network responses in the network plane. Also, a more complete polarization coverage helps reconstruction of the sky coordinates and other source parameters.
III.3 Polarization constraints
The wave parameters and describe the polarization pattern. In some case they can be related to the astrophysical source parameters. In this section we explicitly use the sample index to demonstrate that the event parameter may vary during its time-frequency evolution. For example, for binary systems are defined by the inclination angle of the source and are defined by the polarization angle. The parameters and can be constrained when sources with a certain polarization state are considered. For un-modeled signals all and are free parameters or, in other words, the wave polarization is random (-waves). In this case, the solution for the network responses has been already described in the previous section. By imposing constraints on and , the -waves can be divided into sub-classes with more definite polarization states. For example, most GW signals should produce patterns with fixed chirality (all or all ). Therefore, the vectors can be constrained to have the same chirality (-waves). A more narrow sub-class of -waves are non-precessing binary systems, where the parameters are related to the inclination angle of the source and therefore . The angles define the orientation of the reconstructed response vectors in the network plane. Assuming that the parameters are free, the constraint describes a particular class of GW signals with the same direction of the network response vectors (-waves). The elliptical, linear and circular waves are defined when both angles and are constrained. The constraints for the -waves and -waves, and their combinations characterizing different polarization models are summarized in Table 1.
| pattern | polarization | ||
| constraint | constraint | constraint | state |
| - | - | - | r-waves |
| - | - | -waves | |
| - | - | -waves | |
| - | elliptical | ||
| - | linear | ||
| - | - | loose linear | |
| - | - | circular | |
| - | - | loose circular |
The simplest solution is for the waves with the circular polarization: . A less strict (loose) circular polarization constraint is when . In this case the network responses are defined by the vectors and and the condition is not enforced. For linear waves and all -phase response vectors are co-aligned, or . Respectively, a less strict (loose) linear polarization constraint is defined by the condition when the condition is not enforced. The polarization constraints can be used to construct weakly modeled burst searches targeting broad classes of GW transients. The -wave constraint can be applied to any rotating source. The elliptical, circular and the -wave constraints can be used to search for compact binary sources with different spin configurations.
III.4 Likelihood solutions
The solution for the wave parameters , and , and hence, the waveforms and , can be obtained by maximizing the likelihood functional in Equations 19-20. For un-constraints case when all the wave parameters are free, it is straightforward to show that the solutions for the network responses are given by the projections of the data vectors (,) on the network plane. As described above the un-modeled burst analysis can be constrained to search for GW signals with various polarization states. In general case, the constrained likelihood problem is hard to solve analytically and the numerical solutions are computationally prohibitive. To solve this problem, we apply the phase transformation in Equation 21 to the data vectors and . This transformation reveals the underlying polarization pattern {,,} smeared by the detector noise. The detector responses can be reconstructed directly from this pattern. The solutions for different polarization states can be obtained by imposing the polarization constraints in Table 1. As follows from Equations 26-28, for linear () and circular () waves the components and respectively. Therefore, the reconstructed responses for the loose linear polarization constraint are () and for the loose circular polarization constraint they are (). The solution for linear waves is () where are the projections of on their average vector. The analytic solutions for the other polarization constraints are straightforward to find and we do present them here. Such significant simplification of the inverse problem is possible due to the polarization transformations introduced in this paper. It enables rapid searches over the entire sky and reconstruction of source coordinates in real time.
III.5 Sky localization
As described in Section II.2 the maximum likelihood and other coherent statistics are functions of the sky coordinates and . They are sensitive to the arrival time of a GW signal at the detector sites and can be used for the source localization. The reconstructed source location is defined at the maximum of the likelihood statistic or the sky statistic
| (30) |
The statistic has better performance than for networks with two detectors and both statistics have comparable performance for larger networks. The probability distribution over the sky is calculated as
| (31) |
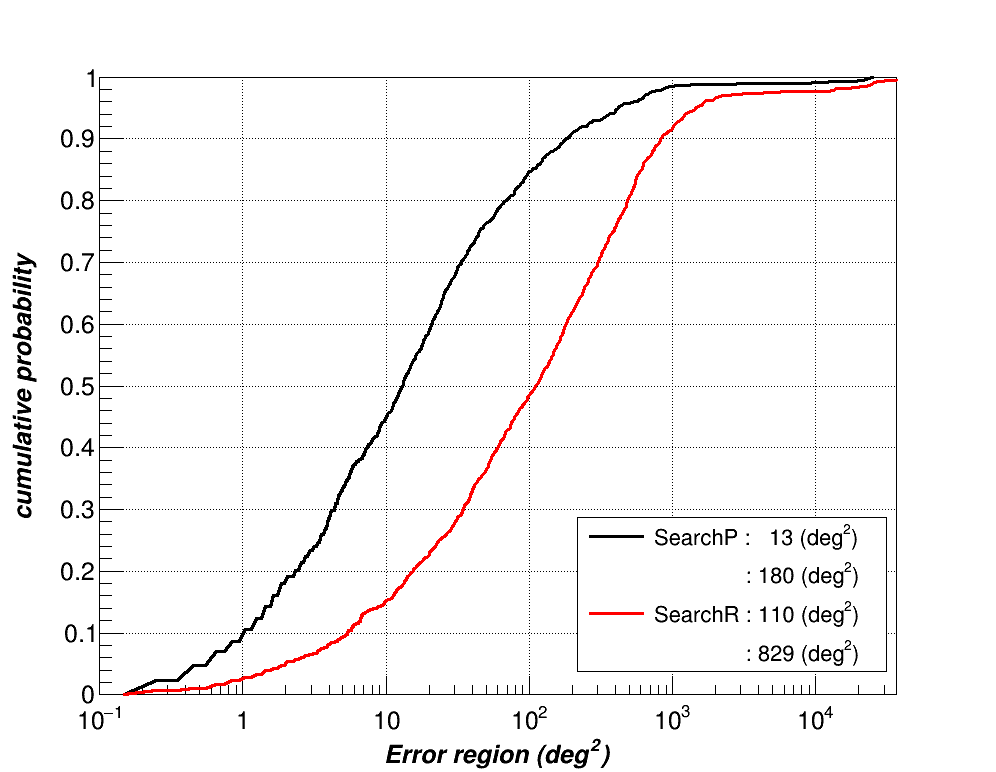
where is either or , is the maximum of in the sky and is the scaling parameter close to unity. The parameter invokes the antenna pattern prior function used for networks with two detectors. For the prior is not used. The scaling parameter could vary depending on the network and used to calibrate the probability , so it correctly represents the fraction of sources found in a given error region. Figure 3 shows the sky localization performance of the advanced Livingston-Hanford-Virgo network for a population of simulated signals expected from mergers of compact binary sources. It is characterized by the median search area defined as the size of the error region in the sky containing of sources. Also Figure 3 shows that the -wave constraint significantly improves the source localization. This is an expected improvement for sky localization constrained by the source models Singer:2014qca . Of course, any modeled sky localization can be biased when the model does not accurately match the observation. However, the -wave constraint uses a very general assumption about the compact binary sources and no significant bias is expected.
 |
IV Network constraints
The polarization constraints should be distinguished from the network constraints (or regulators), which give a model-independent way to constrain the wave parameters , and . Main purpose of the regulators is to eliminate unlikely solutions of the likelihood functional and, therefore, reduce the false alarm rates due to the instrumental and enviromental artifacts in the data. The first network regulators were introduced by Klimenko et al klimenko:2005kmrm to utilize the network properties in the likelihood analysis. Depending on the configuration, detector noise and sky location, the detector network may have much lower sensitivity to the second GW component: . In this case most of the network SNR is produced by the response (see Eq. 8.) The network response is likely to yield low SNR and therefore may not be reconstructed from the noisy data. Such a priori knowledge can be used in the analysis to constrain the likelihood solutions and reduce the number of free parameters in the wave model.
IV.1 Network and event index
The weight of each detector in the network is defined by its noise-scaled response (Eq. 5). Depending on the spectral characteristics of the detector noise and the source sky location, the detector can be a key player in the network or just a spectator. The detector role varies from event to event and with time, depending on the run conditions. The quality of the network depends on how many detectors can contribute to the measurement. It is characterized by the network index
| (32) |
where for any unit vector . The network index is distributed between 1 and K representing the effective number of detectors available for the measurement. It is useful to introduce also the event index
| (33) |
where the unit vectors and are along the OPT vectors and respectively (see Section III.1). The event index is representing the effective number of coincident detectors participating in the measurement. Usually, a low value of or a significant difference between and is an indication of a spurious event produced by the detector noise.
Note, for calculation of the event index and the other coherent statistics, the reconstructed responses should be transformed to the OPT pattern {}, where the vectors and are orthogonal. They define the projection operators and respectively (see Equation 15). The coherent statistics 11-12 are calculated individually for the -phase and -phase data and combined together.
IV.2 Regulators
As prescribed by the un-constrained likelihood analysis, the orientation of the reconstructed response is always along the unit vector (see Eq. 16.) However, when , which is the case for detectors with co-aligned arms, the true network response must be pointing along the vector . Therefore, instead of the vector , the unity vector along must be selected for the projection. This constitutes the hard regulator, which constrains the likelihood analysis to ignore the -response of the network. This and several other regulators have been used to analyze data collected by the initial LIGO and Virgo detectors.
Given a network of detectors, in some cases it is possible to predict the distributions of the wave parameters and anticipated network responses to a generic GW signal. The polarization transformation significantly simplifies the construction of regulators. After substituting the left side of the Equations 26-28 with the data pattern vectors {,,} we obtain the following identities
| (34) | ||||
| (35) | ||||
| (36) | ||||
| (37) |
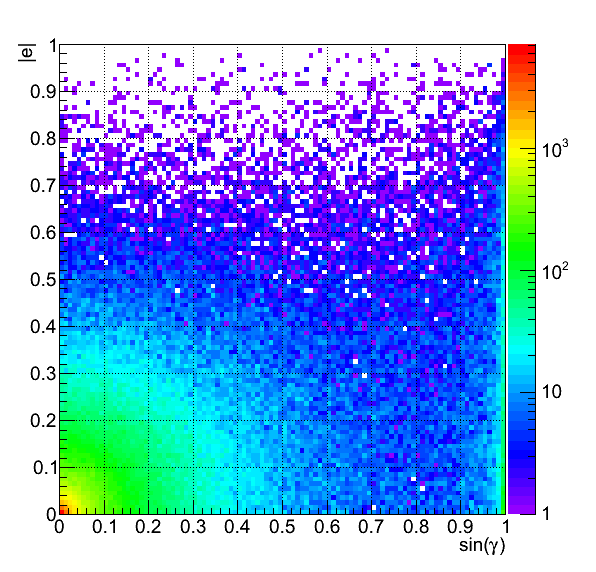
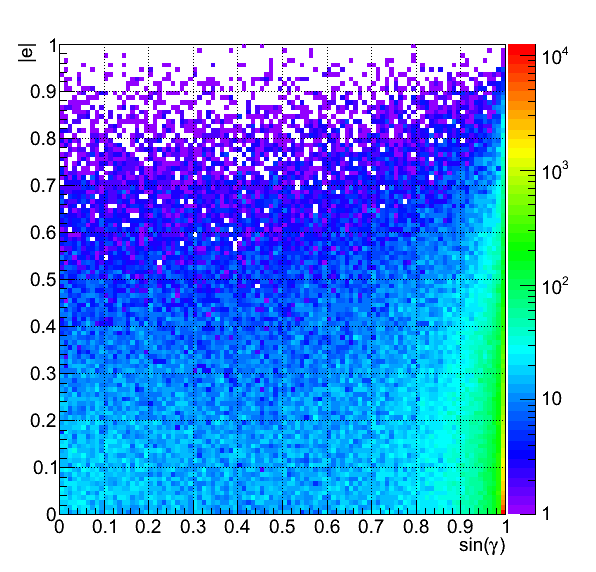
that can be solved for and . As prescribed by Equations 27-28, the responses and vanish when and respectively. Figures 4 show the distributions of the reconstructed and for noise and signal, and the Livingston-Hanford network. Unlike the signal, the noise is clustering at the low values of and . The noisy data can be identified by the regulator
| (38) |
when is below some threshold . For appropriately selected , the regulator identifies data pixels with the marginal signal components and and zeroes them. The regulated responses () are biased: a small fraction of events can be miss-reconstructed and excluded from the analysis. Despite this relatively small (and controlled) loss, the regulator otherwise is very efficient in reducing the false alarm rates, with a typical reduction factor of . It entirely eliminates the single detector FAR and significantly suppresses FAR from the accidental coincident events produced by the detector pairs. To further reduce the double coincidence FAR, we introduce the second regulator, which utilizes the network and the event indexes
| (39) |
The condition is used to identify the situation when two or less detectors are used in the measurement. In this case the reconstructed responses are constrained to be (). Both regulators can be used to constrain the detector networks when either the network alignment coverage is insufficient, or the effective number of detectors is less than 2.
 |
 |
V Conclusion
In the paper we present the improved analytic framework of the cWB analysis algorithm. The objective of this analysis is the detection and reconstruction of un-modeled GW transients. It is achieved by solving the burst inverse problem - reconstruction of the signal waveforms, wave polarization and the sky coordinates of the source. The reconstruction is performed by using the likelihood formalism with the signal waveforms as free parameters. The waveforms can be described with the wave parameters and constrained, which enable a range of weakly modeled burst searches. The likelihood analysis yields a number of detection statistics used for the ranking of detected events (the network coherent SNR), the rejection of background events (the network correlation coefficient) and for the sky localization.
The novelty of the paper is in the introduction of the polarization patterns. By imposing a simple phase transformation to the network data, a characteristic pattern emerges revealing the polarization state of an arbitrary GW signal. This unique signature of the signal can be measured independent from the other source parameters. The polarization transformation significantly simplifies the solution of the inverse problem: the detector responses can be reconstructed directly from the pattern. The polarization constraints can be imposed, which enable weakly modeled burst searches. The reconstruction is computationally efficient allowing for rapid searches over the entire sky and the reconstruction of source coordinates in real time with a few minutes latency. We also identify factors limiting reconstruction and how the polarization measurements are affected by the network. A simple metric (network alignment factor ) determines the network ability to capture polarizations. The network of LIGO and Virgo detectors has a low alignment coverage for a significant fraction of the sky. Therefore, in most cases, the polarization state of a weak GW signal can not be measured. Adding Kagra and LIGO-India detectors to the advanced network will significantly improve the alignment coverage and, hence, the reconstruction of the signal parameters.
VI Acknowledgements
We are thankful to the National Science Foundation for support under grants PHY 1205512 and PHY 1505308. This document has been assigned LIGO Laboratory document number P1500206.
References
References
- (1) B.P. Abbott et al, Class. Quant. Grav. 32 (2015) 074001
- (2) F. Acernese et al. (Virgo Collaboration) Class. Quantum Grav. 32 (2015) 024001
- (3) http://gwcenter.icrr.u-tokyo.ac.jp/en/
- (4) https://dcc.ligo.org/LIGO-M1100296/public
- (5) J. Abadie et al, Class. Quantum Grav. 27 (2010) 173001
- (6) S. Klimenko, I. Yakushin, A. Mercer, G. Mitselmakher Class. Quantum Grav. 25 (2008) 114029
- (7) P. J. Sutton, G. Jones, S. Chatterji, P. Kalmus, I. Leonor, S. Poprocki, J. Rollins, A. Searle, L. Stein, M. Tinto New Journal of Physics 12 (2010) 053034
- (8) E. Thrane et al, Phys. Rev. D 83 (2011) 083004
- (9) R. Lynch, S. Vitale, R. Essick, E. Katsavounidis arXiv:1511.05955 (2015)
- (10) B. P. Abbott et al. [LIGO Scientific and VIRGO Collaborations], Astron. Astrophys. 539, A124 (2012)
- (11) J. Aasi et al. [LIGO Scientific and VIRGO Collaborations], Astrophys. J. Suppl. 211, 7 (2014)
- (12) B. D. Metzger and E. Berger, The Astrophysical Journal 746 (2012) 48
- (13) J. Abadie et al. (The LIGO Scientific Collaboration and The Virgo Collaboration) Astronomy and Astrophysics, 539 (2012) A124
- (14) C. Pankow, S. Klimenko, G. Mitselmakher, I. Yakushin, G. Vedovato, M. Drago, R. A. Mercer, P. Ajith Class. Quantum Grav. 26 (2009) 204004
- (15) J. Abadie et al. (The LIGO Scientific Collaboration and The Virgo Collaboration) Phys. Rev. D 81, (2010) 102001
- (16) J. Abadie et al. (LIGO Scientific Collaboration, Virgo Collaboration) Phys. Rev. D 85 (2012) 102004
- (17) J. Abadie et al. (The LIGO Scientific Collaboration and The Virgo Collaboration) Phys. Rev. D 85 (2012) 122007
- (18) J. Abadie et al. (LIGO Scientific Collaboration, Virgo Collaboration) Phys. Rev. D 89 (2014) 122003
- (19) S. Klimenko et al, Phys.Rev.D 83 (2011) 102001
- (20) V. Necula, S. Klimenko, G. Mitselmakher J. Phys. Con. Ser. 363 (2012) 012032
- (21) V. Tiwari et al, Class. Quantum Grav. 32 (2015) 165014
- (22) V. Tiwari, S. Klimenko, V. Necula, G. Mitselmakher arXiv:1510.02426 [astro-ph.IM] 2015
- (23) R. Essick, S. Vitale, E. Katsavounidis, G. Vedovato, S. Klimenko Astrophys.J., 800 2,81 (2015)
- (24) Y. Gürsel and M. Tinto, Phys. Rev. D 40 (1989) 3884
- (25) É.E. Flanagan and S.A. Hughes, Phys. Rev. D 57 (1998) 4566
- (26) S. Klimenko, S. Mohanty, M. Rakhmanov and G. Mitselmakher, Phys. Rev. D, 72 (2005) 122002
- (27) S. D. Mohanty, M. Rakhmanov, S. Klimenko, G. Mitselmakher Class. Quantum Grav. 23 (2006) S4799
- (28) L. P. Singer et al., Astrophys. J. 795, no. 2, 105 (2014)