The contribution of host galaxies to the infrared energy output of quasars
Abstract
The infrared spectral energy distributions (SEDs) of quasars can be reproduced by combining a low-metallicity galaxy template with a standard AGN template. The host galaxy is represented by Haro 11, a compact, moderately low metallicity, star-bursting galaxy that shares typical features of high- galaxies. For the vast majority of quasars, the AGN contribution is well modeled by a standard empirical template with the contamination of star formation in the infrared subtracted. Together, these two templates can separate the contributions from the host galaxy and the AGN even in the case of limited data points, given that this model has only two free parameters. Using this method, we re-analyze 69 quasars with extensive Herschel observations, and derive their AGN luminosities in a range , the infrared luminosities from star formation , and the corresponding star formation rates . The average infrared luminosity from star formation and the average total AGN luminosity of the quasar sample follows the correlation defined by quasars at . We assume these quasar host galaxies maintain a constant average SFR () during their mass assembly and estimate the stellar mass that could form till to be . Combining with the black hole (BH) mass measurements, this stellar mass is adequate to establish a BH-galaxy mass ratio at 0.1-1%, consistent with the local relation.
Subject headings:
galaixies: active – infrared: galaxies – quasars: general – galaxies: dwarf1. Introduction
Over 150 quasars with black hole masses of the order of have been discovered beyond , less than a billion years after the Big Bang (e.g., Fan et al., 2006; Jiang et al., 2008; Mortlock et al., 2009; Willott et al., 2010a; Morganson et al., 2012; McGreer et al., 2013; Bañados et al., 2014). In the local Universe, the masses of supermassive black holes (SMBHs) are correlated with the properties of their host galaxies, suggesting galaxies and SMBHs possibly coevolve (Kormendy & Ho, 2013, and references therein). Since star formation (SF) enables the buildup of galaxies and active galactic nuclei (AGN) trace the growth of SMBHs, the so-called SF-AGN relation has come under intense scrutiny for decades (Heckman & Best, 2014, and references therein). With the use of ground- and space-based facilities, similar research can be extended to , allowing the preliminary examination of both the stellar and SMBH growth at very early stages in galaxy evolution (e.g., Walter et al., 2004, 2009; Maiolino et al., 2005; Riechers et al., 2006; Jahnke et al., 2009; Wang et al., 2010b, 2013; Willott et al., 2013, 2015).
However, observing the AGN host galaxy in a quasar is challenging, since the bright continuum emission from the active nucleus overpowers the light from the galaxy from the UV through the near-infrared (near-IR or NIR). At , the situation is even more extreme: the AGN tend to be the most luminous because of the evolution of the quasar luminosity function and selection effects (e.g., Fan et al., 2004; Jiang et al., 2008; Willott et al., 2010b; McGreer et al., 2013); the host galaxies are found to be compact and small (e.g., Jiang et al., 2013; Wang et al., 2013); and the presence of copious amounts of dust (e.g., Wang et al., 2008b; Leipski et al., 2014) may also obscure the galaxy light. To study these very distant AGN host galaxies, attention has turned to the emission in longer wavelengths (e.g., Wang et al., 2010b, 2011b, 2013; Leipski et al., 2013, 2014), where the AGN is less dominant.
A promising tool to probe the stellar activity in a quasar is analyzing its infrared (IR) spectral energy distribution (SED). For galaxies, most of the radiation from the recently formed stars is absorbed and re-emitted at IR wavelengths. However, in quasars, the central AGN may also heat the dust (e.g., Haas et al., 2003; Netzer et al., 2007). Since spatially resolving the IR emission at high-redshift is impossible with current facilities, we have to rely on SED models to distinguish star formation and nuclear activity (e.g., Marshall et al. 2007; Mullaney et al. 2011; Mor & Netzer 2012; Magdis et al. 2013; Netzer et al. 2014; Xu et al. 2015b, a).
The UV-to-NIR SEDs of AGN seem to have little evolution with redshift and Eddington-ratio (e.g., Hao et al. 2014; Wang et al. 2008b). However, at , the far-IR SEDs of quasars seem to include a warm (40-60 K) dust component (e.g., Beelen et al., 2006; Wang et al., 2008a; Leipski et al., 2014), which is not commonly found in the local quasars. It is intriguing to check if such behavior is due to the evolution of the AGN host galaxies, since the IR SEDs of galaxies do change at high- (see Lutz 2014 for a review). Compared with local nuclear-concentrated ULIRGs, intermediate redshift () dusty star-forming galaxies (DSFGs) are more extended, resulting in cooler SEDs than those locally with similar IR luminosities (Rujopakarn et al., 2011). Meanwhile, galaxies at higher redshifts have more gas (e.g., Carilli & Walter, 2013) to supply the star formation, boosting their IR luminosities (e.g., Daddi et al., 2005, 2007; Rodighiero et al., 2011; Magnelli et al., 2014; Schreiber et al., 2015). Moreover, both observations and theories suggest galaxies in the early Universe are generally metal poor (e.g., Madau & Dickinson, 2014, and references therein), which could also have detectable effects on their SEDs, such as weak aromatic features, featureless mid-IR (MIR) continuum, and higher dust temperatures (e.g., Galliano et al., 2005; Rémy-Ruyer et al., 2013). At extremely high redshift (e.g., ), direct constraints on metallicity in galaxies are rare; however, indirect evidence supporting low-metallicity comes from the failed detection of the dust continuum for nearly all galaxies (e.g., Ouchi et al. 2013; Maiolino et al. 2015, but see Watson et al. 2015). It is likely that galaxies, in general, including those quasar host galaxies, are of relatively low-metallicity when the Universe age is within 1 Gyr.
Because of these issues, fits to the SEDs of high redshift quasars are unsuccessful using conventional quasar templates plus those for typical normal (e.g., solar metallicity) SF galaxies, a method that works well for low-to-intermediate redshift quasars (e.g., Mullaney et al. 2011; Magdis et al. 2013; Xu et al. 2015b). In this paper, we demonstrate that the SEDs of quasars can be modeled using a moderately low-metallicity galaxy template to represent the AGN host galaxy. We combine a galaxy template derived from Haro 11 and a modified AGN template based on Elvis et al. (1994) to provide physically-motivated fits that successfully reproduce these quasar infrared SEDs. This simple model can be used to probe the relation between the AGN activity and host star formation in quasars with very limited observations.
Throughout this paper, we adopt cosmology , and km s-1Mpc-1.
2. Selection of SED templates
In modeling the SEDs of quasars at 5.0, the dearth of data points at long wavelengths requires minimizing the number of free parameters in SED fitting. While more precise fittings may be achieved by adding more free parameters, the scientific interpretation is then more subject to model degeneracy. To first order, the SED of a quasar should consist of an AGN component, and a host galaxy component. If suitable SED templates can be found, we only need two free parameters to normalize their contributions. Such a two-parameter model can be used to retrieve information from sources with less complete observations and make the interpretation less ambiguous.
2.1. Host Galaxy Template: Why Haro 11?
Galaxies at are of relatively low-metallicity (e.g., Cullen et al., 2014; Maier et al., 2014). Confirming the trend toward lower metallicity to is difficult with current capabilities. Recently, some groups have tried to detect the dust continua of normal galaxies using the Atacama Large Millimeter/Sub-millimeter Array (ALMA). The unexpected failures of almost all of these efforts have led to the interpretation that these galaxies may be scaled-up versions of local very metal-poor dwarf galaxies (e.g., Ouchi et al., 2013; Maiolino et al., 2015). As Fisher et al. (2014) pointed out, it would be almost impossible to observe the dust emission of any galaxies with extreme low metallicity like the local dwarf galaxy 1 Zw 18. For the most luminous systems, however, the change in metallicity seems to be modest (e.g., Rawle et al., 2014). As a result, the ideal sample to draw a representative template for IR observable high- galaxies is the moderately low-metallicity galaxies in the local Universe.
In addition, AGN host galaxies at are found to be compact with typical sizes 1-3 kpc, from observations at rest-frame UV (Jiang et al., 2013), deep -band images (Targett et al., 2012), dust continuum maps (Wang et al., 2013), submm fine structure line maps (e.g., Wang et al., 2013; Willott et al., 2013, 2015), molecular gas distributions (e.g., Walter et al., 2004, 2009; Wang et al., 2013), and from SED analysis (Greve et al., 2012). Compared with extended galaxies of the same infrared luminosity, they are expected to have hotter far-IR SEDs due to compact star forming regions (Groves et al., 2008). Thus, we are motivated to search for a moderately low-metallicity galaxy with a high surface density of star formation to provide a SED analogous to that we expect for the star formation in the host galaxies of high- quasars.
Appendix A presents the procedure to derive low-metallicity galaxy templates. To summarize briefly, we began with the sample of the Dwarf Galaxy Survey (DGS; Madden et al. 2013), which includes the largest metallicity range observable in the local Universe, with 12+log(O/H) ranging from 7.14 to 8.43, and spans four orders of magnitude in star formation rates. Combining their Herschel far-IR data (Rémy-Ruyer et al., 2013) and archival WISE mid-IR photometry, we fit the broad-band SEDs with a far-IR modified blackbody plus a mid-IR power-law component, and replaced the mid-IR fit SEDs with the corresponding Spitzer spectra. Among the 19 dwarf galaxies studied in detail, Haro 11 is the best candidate analog for high-z galaxies. Haro 11 is a moderately low-metallicity (, James et al. 2013) dwarf (, Östlin et al. 2001) galaxy in the nearby Universe ( Mpc, Bergvall et al. 2006). It shows substantial star formation activity (, Grimes et al. 2007, see also Appendix B.2) and emits strongly in the infrared (, Adamo et al. 2010). Haro 11 also contains an extremely young stellar population with age Myr (Adamo et al., 2010). Some authors suggest it is a local analogue of the high- Lyman break galaxies (LBGs) or Lyman- emitters (Hayes et al., 2007; Leitet et al., 2011).
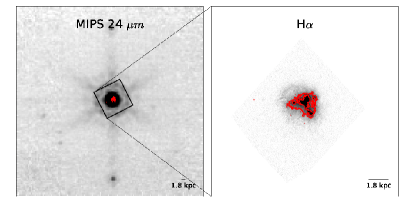
Besides low metallicity, the most important two features of Haro 11 are its high star formation rate and compact size, indicating a very high star formation surface density. From our estimation, the star formation rate of Haro 11 can be as high as (based on and , see Appendix B.2), which is significantly higher than the vast majority of dwarf galaxies in the literature (Hopkins et al., 2002). Meanwhile, Haro 11 has a compact size. Its MIPS 24 image is perfectly diffraction-limited (see Figure 1), which puts an upper-limit on its IR emitting region size ( or 1.2 kpc). The size of the star formation region of Haro 11 constrained from high-resolution H images (Östlin et al., 2009) is also small ( kpc from measuring 50% total flux, and 2.7 kpc from measuring 90% total flux). The IR luminosity surface density, , of Haro 11 is , which approaches the values in galaxies at (e.g., GN20 has , Hodge et al. 2015). The high star formation rate surface density and infrared luminosity surface density of Haro 11 are exceptional among dwarf galaxies, making it the most suitable local analog to high- quasar host galaxies.
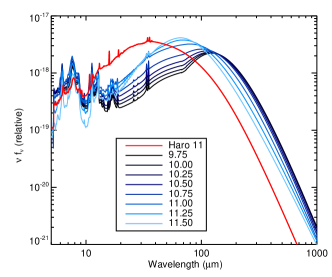
In Figure 2, we compare the derived Haro 11 template with a number of normal solar-metallicity star-forming (SF) templates in Rieke et al. (2009). Haro 11 has a larger mid-IR slope with (), in contrast with normal galaxies with (e.g., Blain et al., 2003; Casey, 2012). The derived dust temperature is T = 46.5 K with emissivity index . Haro 11 also presents very weak aromatic features compared with normal galaxies. All these characteristics are commonly seen for other dwarf galaxies (see Appendix A.3). Compared with the Rieke et al. (2009) SED templates with , which are representative for galaxies (see Section 3.1), Haro 11 has similar surface densities but higher dust temperature. We suggest the low-metallicity of Haro 11 is the most likely reason for its warmer SED.
2.2. AGN Continuum Template
Candidate AGN templates can be derived from either numerical models (e.g., Fritz et al., 2006; Hönig & Kishimoto, 2010) or semi-analytic models (e.g., Mullaney et al., 2011; Sajina et al., 2012). However, such models always have many free parameters, which need to be optimized to fit real AGN behavior. Hence the starting point for determining AGN templates needs to be an accurate empirical version.
Elvis et al. (1994) built an X-ray to radio SED template for a sample of 47 well-defined optically selected quasars and subtracted the host galaxy emission in the UV/optical and near-IR bands. This template has become the classic representation of Type 1 AGN SEDs in the ultraviolet, visible, near, and mid-infrared. Many studies based on larger samples and modern data have closely reproduced the Elvis template (e.g., Richards et al., 2006; Shang et al., 2011; Runnoe et al., 2012; Elvis et al., 2012; Hanish et al., 2013; Scott & Stewart, 2014). The remarkable similarity of these results to the Elvis template is demonstrated by the comparisons in Scott & Stewart (2014) (their Figure 5). The success of the Elvis template is also demonstrated by its broad application, for example, to study the SEDs of type-1 AGN in XMM-COSMOS (Elvis et al., 2012) and decompose the SEDs of intermediate-redshift quasars in Xu et al. (2015b). The template shape appears to vary little with cosmic evolution or other characteristics such as the Eddington ratio (e.g., Hao et al., 2011, 2014). In particular, this template appears to work equally well to z 6. Jiang et al. (2006) demonstrated that the rest-frame SEDs of 13 z 6 quasars can be matched with the Elvis et al. (1994) template. Wang et al. (2008b) demonstrated that the average optical-to-near-IR SED of 33 z 6 quasars is consistent with the Elvis template. Jiang et al. (2010) find that the near infrared and optical-to-NIR colors of hundreds of quasars are virtually the same from the local epoch to z 6, i.e., they are consistent with a common SED shape, which must therefore be consistent with the Elvis template. Therefore, the Elvis template is a useful metric for testing more complex models and is currently the most suitable approach for SED decompositions involving UV-luminous Type-1 AGNs.
There are two issues in applying the Elvis template. The first is that it is likely to have a residual contribution in the far infrared from dust heated by star formation, a possibility that has hindered its application in using the far infrared to measure star formation rates in quasar host galaxies (e.g., Barnett et al., 2015). However, a version of the template corrected for this effect is now available (Xu et al., 2015b). Based on the analysis of the Spitzer and IRAS data of the Elvis et al. (1994) sample, these authors found a tight correlation between the strength of the 11.3 m aromatic feature and the infrared 60 to 25 m flux ratio. They concluded that star formation, as traced by the aromatic feature, boosted the infrared flux ratio in the template by a factor of 1.27. A scaled Rieke et al. (2009) star-forming galaxy template (log = 11.0) was subtracted from the Elvis et al. (1994) template to remove this contribution. The second issue is that of order 10% of quasars have SEDs similar to the Elvis template in the UV and optical, but are relatively weak in the near and mid-infrared, a behavior attributed to a relative lack of hot dust (Hao et al., 2010, 2011). The exact SED shape of these dust-poor quasars requires future work to address.
Leipski et al. (2013) used three components to represent the AGN SEDs for their high redshift quasar sample: a UV/optical power-law, a NIR dust emission component, and a torus model. They adjusted the relative contributions of these components to optimize their SED fits. However, all three components are implicitly embedded in the Elvis template. Any adjustments in relative strengths should only be made after it has been demonstrated that the Elvis template (or similar ones) gives an unsatisfactory fit. In this work, we use the Elvis template for our SED decomposition. When combined with the Haro 11 template, we find that its fits are of comparable quality to the relatively unconstrained fits used by Leipski et al. (2013, 2014) in the sense of chi-square tests. There is thus no advantage for our study in using those more complex and less constrained models for the quasar SEDs - they introduce additional free parameters without improving the fits correspondingly (see Section 3.3).
2.3. Fitting Procedure
To compare the templates described above to observations, we used a fitting procedure that takes into account upper-limit data points where available. For measurements of with uncertainties and non-detections with ( confidence level), we define the fitting chi-square as (Isobe et al., 1986):
| (1) |
where
| (2) |
| (3) |
which is the error function, and is the modeled value. In Equation 1, the first term on the right-hand side is the classical definition of chi-square, and the second term introduces the error function to quantify the fitting of upper-limits. We use Markov Chain Monte Carlo (MCMC) methods to find the parameter set to minimize . 3 upper limits are adopted for all non-detections. To compare the fitting quality of different fitting methods, the total should be normalized by the degrees of freedom, . In our case, , where is the number of free parameters in the model. We will use to represent the reduced chi-square, i.e., .
To deal with the trade-off between the goodness of fit and the complexity of the model, we use the corrected Akaike Information Criterion (AICc) test (Sugiura, 1978), which is defined by
| (4) |
where is the maximum likelihood achievable by the model, and is the number of data points used in the fit, . The likelihood of a model to fit data satisfies
| (5) |
where the constant is related to the errors, , and the binning, , of the data points, which are fixed at the time of observations. We can ignore when comparing different models to fit the same observations, and finally have
| (6) |
3. Tests of the templates
3.1. Template Fits for High- Galaxies
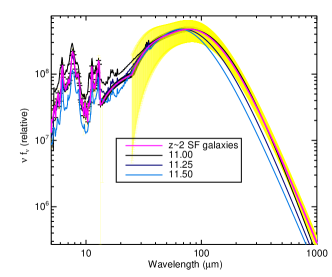
We now discuss alternative SF template candidates to be used at high-. Rieke et al. (2009) derived templates for local normal star-forming galaxies with different infrared luminosities (). Although carefully calibrated in the local Universe, these templates may not apply at high redshift. The star formation in luminous galaxies at high- has been found to be more physically extended than that in local galaxies with similar (local LIRGs and ULIRGs are sub-kpc, whereas high- DSFGs are kpc in size, see Rujopakarn et al. 2011). Rujopakarn et al. (2011, 2013) found that the Rieke et al. (2009) =11.00-11.50 SED templates are representative of galaxies found at due to their similar surface densities. This argument is supported by the consistency between the empirical average SED of galaxies derived in Kirkpatrick et al. (2012) and the =11.00-11.50 SED templates from Rieke et al. (2009) (Figure 3). In fact, Figure 3 shows the progressively poorer correspondence of the Rieke et al. (2009) templates with the empirical one with increasing . It is also consistent with the finding of a shift toward colder FIR SEDs at high redshift by Symeonidis et al. (2009, 2013). Greve et al. (2012) found evidence of extended structures in DSFGs out to redshift , based on analysis of their infrared SEDs. With this evidence, we focus on Rieke et al. (2009) SED templates with luminosity in the following comparisons. These normal SF templates represent galaxies that are almost certainly more metal-rich than is appropriate for . We will therefore compare them with fits using a template derived from Haro 11.
We test the Rieke et al. (2009) and Haro 11 template fittings to extremely high- galaxies, as examples of potential host galaxies for high redshift quasars. Due to the lack of data available for star-forming galaxies at , we extend our redshift range down to . We find 8 galaxies (see Table 1) with multiple constraints on their rest-frame infrared SEDs, suitable for comparison with these templates. By selection, these highest- DSFGs are limited to a handful of submillimeter galaxies (SMGs), which were originally discovered in the submm and relatively bright in the far-IR. The identification technique of SMGs could bias their SEDs to be relatively cold compared with high- galaxies selected in other ways (Le Floc’h et al., 2004), whereas the SEDs of low-metallicity galaxies tend to be relatively hot (e.g., Rémy-Ruyer et al., 2013). As a result, the high- galaxy examples studied here might be biased against typical low metallicity galaxies, which, as in the case of Haro 11, tend to have SEDs dropping rapidly toward the submm.
Table 1 summarizes the fitting results for the galaxies. We limit the fits to rest-frame 8-1000 , where the emission is purely from dust. Although a few examples, e.g., GN20, have a cold far infrared SED matched better by the Rieke et al. (2009) templates, in general the fits with the Haro 11 SED are at least as good. We conclude that it is as good as the local higher metallicity templates in fitting the SEDs of these extreme SMGs. That is, even given the selection bias against it, the Haro-11-based template can be used without a substantial loss of accuracy.
| Source | R09 best | Ref. | |||
|---|---|---|---|---|---|
| (1) | (2) | (3) | (4) | (5) | (6) |
| HFLS 3 | 6.34 | 13.1 | 11.50 | 30.9 | 1 |
| AzTEC 3 | 5.30 | 1.5 | 11.50 | 2.3 | 2, 3 |
| HLS J0918+5142 | 5.24 | 18.1 | 11.50 | 18.4 | 3 |
| AzTEC 1 | 4.64 | 6.9 | 11.50 | 2.0 | 3 |
| Capak4.55 | 4.55 | 0.6 | 11.50 | 2.1 | 3 |
| ID 141 | 4.24 | 5.7 | 11.50 | 17.9 | 5 |
| GN10 | 4.05 | 3.2 | 11.50 | 1.5 | 3 |
| GN20 | 4.05 | 23.1 | 11.25 | 0.2 | 3 |
Note. — Col. (1): Source names sorted by their redshifts; Col. (3): of Haro 11 template fitting; Col. (4): the Rieke et al. (2009) template which has the minimum ; Col. (5): minimum among tested Rieke et al. (2009) templates; Col. (6): references for photometric data.
References. (1) Riechers et al. (2013); (2) Dwek et al. (2011); (3) Huang et al. (2014); (4) Rawle et al. (2014); (5) Cox et al. (2011)
3.2. Template Fits for High- Quasars
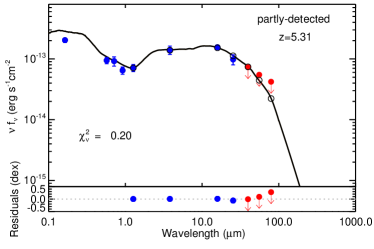
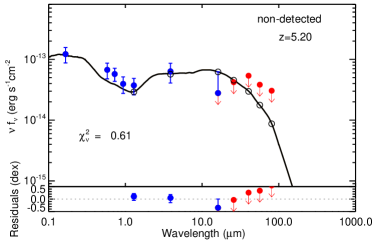
The Elvis et al. (1994) template has been shown to match type-1 quasar SEDs for redshifts up to and for wavelengths (Hao et al. 2014; Xu et al. 2015b). An issue in applying it, or the similar template of Richards et al. (2006), in the far-IR is the uncertain contribution of host galaxy star formation (e.g., Barnett et al., 2015). However, Xu et al. (2015b) were able to correct for this effect. In Figure 4, we compare this corrected template with the stacked SEDs from Leipski et al. (2014). While the UV-to-optical parts of all three SEDs are well matched with the AGN continuum template, differences emerge in the infrared. The stacked SED of quasars detected in at least 3 Herschel bands has a substantial excess over the AGN template in the far-IR, which we attribute to host galaxy star formation (see Section 5.1). The stacked SED of quasars not detected with Herschel is not matched as well in the infrared although the reduced chi-square is still acceptable. This behavior could be due to the unsuitability of a classical AGN template to represent the hot-dust-free (Jiang et al., 2010) or hot-dust-poor (Hao et al., 2010, 2011) quasars (hereafter hot-dust-deficient quasars, or HDD quasars) as pointed out by Leipski et al. (2014). The fit to the Herschel partly-detected (detected in only 1-2 Herschel bands) stacked SED is virtually perfect over the entire wavelength range. The agreement of the template with both the Herschel-undetected and Herschel partly-detected stacked SEDs suggests that the star-formation corrected Elvis SED is a good choice to fit the high-redshift AGN continua. More discussion will be provided in Section 5
3.3. SED Fitting with Well-measured High- Quasars
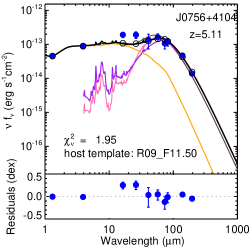
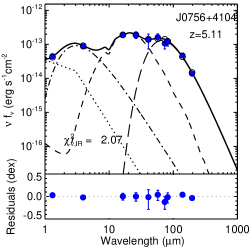
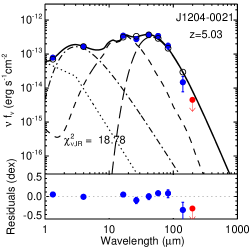
To test further whether the Haro 11 template as well as the AGN (modified Elvis et al. (1994)) template are reasonable choices to decompose quasar SEDs, we focus on 5 quasars with the most complete infrared SEDs. Besides SDSS J12040021, the SEDs of all the other quasars were studied in Leipski et al. (2013)111Among the five millimeter-detected quasars with at least two Herschel observations in Leipski et al. (2013), SDSS J10440125 is excluded since the number of detected data points at rest-frame is smaller than the number of free parameters of the Leipski et al. (2013) model. This hinders the computation of a reduced chi-square of the Leipski et al. (2013) model for only the IR data points to be compared with the two-component fits.. We model the observed rest-frame 1-1000 SED as a linear combination of the Haro 11 template and the AGN template with two free normalizing factors. These two templates are taken to be independent. To compare the Haro 11 template with the normal SF templates, we replace the Haro 11 template by the normal SF templates in Rieke et al. (2009), and redo the fit. We also apply the Leipski et al. (2013) model to the UV-to-IR SED of these quasars and compare the fits of the IR SED with those from our two-component models.
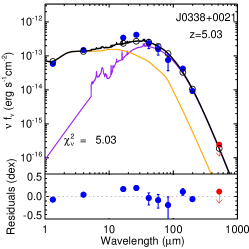
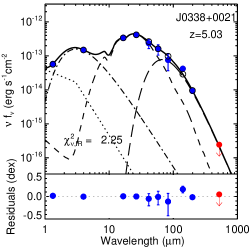
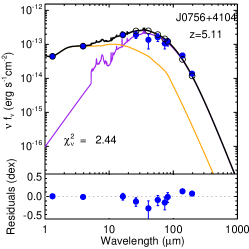
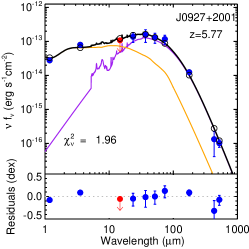
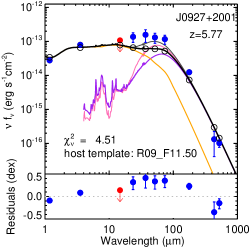
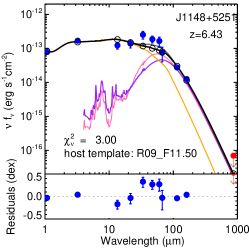
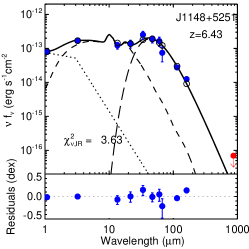
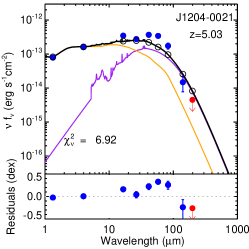
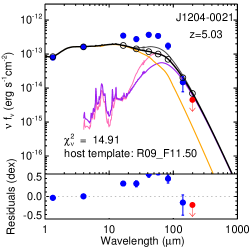
In Figure 5, we present the SED decomposition results. In general, the Haro 11 template fits have smaller residuals ( 0.3 dex) compared with the best-fit222We fit these quasars with normal SF templates in Rieke et al. (2009) with , and pick the one that has the lowest as the best. The normal SF templates do not yield any better results, especially in the mid-IR, as shown in Figure 5. normal SF template. In particular, the Haro 11 template yields much better fits in representing the warm dust component from the two-component decomposition. We comment on the two-component fits (left and middle columns of Figure 5) for each SED below:
J0338+0021 (or SDSS J033829.31+002156.3; we use JHHMM DDMM for brevity). The Haro 11 template is better than the best normal SF template in decomposing the SED. Fitting the mid-IR at and the far-IR drop beyond results in the normal SF template model underestimating the flux at . We note an excess between 10 and over the normal SF template fitting model SED, which could be the warm excess seen in relatively low- AGN SEDs reported by Xu et al. (2015b). In contrast, such an excess is not strong in the Haro 11 template fits.
J0756+4104. Judging from the fit , the normal SF template seems better. However, of the of the Haro 11 template fit is contributed by the data point at the longest wavelength (), whereas the contribution of the same data point in the normal SF template fitting is minimal. Again, the normal SF template fitting underestimates the SED at . We conclude the normal SF template and the Haro 11 template yield fits of similar quality.
J0927+2001. The Haro 11 template is much better than the normal SF template in reproducing the observed SED. The maximum deviation of the dwarf galaxy model and observed SEDs is less than 0.3 dex. In the case of this quasar, the normal SF template underestimates the SED at .
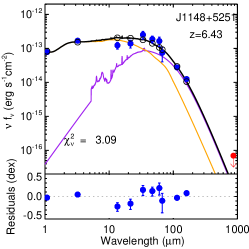
J1148+5251. For this well-studied quasar, the Haro 11 template fitting is almost the same as the best normal SF template fitting when comparing . Interestingly, our estimation of the host contribution of this quasar is consistent with result based on the theoretical analysis by Schneider et al. (2014) .
J12040021. This is the only case where the Haro 11 template fitting has one data point with fitting residual (slightly) greater than 0.3 dex. Both two-component fits underestimate the observed flux. However, the residual from the Haro 11 template fitting is much smaller than the normal SF one.
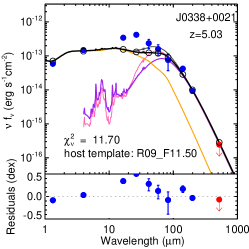
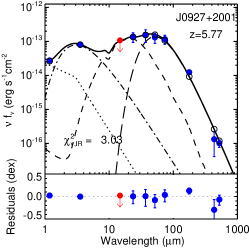
For the Leipski et al. (2013) model (right column of Figure 5), we only apply the fit to the detected data points in the UV-to-IR, in the same fashion as Leipski et al. (2013), and compute the for the detected data points at rest-frame 1-1000. Since it has more components, especially a torus component selected from a large model library, small details of the observed SED can be reproduced. Thus, the residuals are generally smaller. However, our two-parameter fit has similar reduced chi-square compared with the Leipski et al. (2013) model, despite its simplicity. To judge which fit is preferred, we have used the AICc test (see Section 2.3). Since the slope of the power law component is not useful in fitting the infrared data, we have assumed that the Leipski et al. (2013) fits had six free parameters over 1-1000 . As shown in Table 2, the value of AICc is lower in all five cases for the 2-parameter fits, indicating that they are indeed preferred. That is, even for these quasars with the maximum number of measurements, the Leipski et al. (2013) model over-fits the data compared with our two-parameter one.
 |
 |
 |
 |
 |
 |
 |
 |
 |
 |
 |
 |
 |
 |
 |
| Source | Redshift | / | AICc | R09 best | AICcL13 | ||||
|---|---|---|---|---|---|---|---|---|---|
| (1) | (2) | (3) | (4) | (5) | (6) | (7) | (8) | (9) | (10) |
| SDSS J0338+0021 | 5.03 | 4.01 | 0.57 | 5.03 | 45.95 | 11.50 | 11.70 | 2.25 | 49.00 |
| SDSS J0756+4104 | 5.11 | 3.77 | 0.69 | 2.44 | 25.26 | 11.50 | 1.95 | 2.07 | 48.28 |
| SDSS J0927+2001 | 5.77 | 3.21 | 0.64 | 1.96 | 21.39 | 11.50 | 4.51 | 3.03 | 52.12 |
| SDSS J1148+5251 | 6.43 | 5.31 | 0.34 | 3.09 | 33.31 | 11.50 | 3.00 | 3.63 | 51.10 |
| SDSS J12040021 | 5.03 | 3.79 | 0.46 | 6.92 | 54.44 | 11.50 | 14.91 | 18.78 | 110.34 |
Note. — Results of full IR fits. Upper-limit data points are included in the evaluation process. Col. (3): the total infrared luminosity (8-1000 ) estimated from the “Haro 11 + AGN” two-component SED fit; Col. (4): the fraction of luminosity of host template contribution to the whole fit SED, based on result from the “Haro 11 + AGN” decomposition; Col. (5): reduced chi-square from the “Haro 11 + AGN” decomposition; Col. (6): the AICc test value of the “Haro 11 + AGN” two-component model; Col. (7): log of the Rieke et al. (2009) template which has the minimum ; Col. (8): the minimum of the “normal SF galaxy + AGN” decomposition with all tested Rieke et al. (2009) templates; Col. (9): reduced chi-square from the Leipski et al. (2013) model, only counting data points at rest-frame 1-1000 ; Col. (10): the AICc test value of the Leipski et al. (2013) model, assuming 6 free parameters.
In summary, we find that the Haro 11 galaxy template and the modified Elvis AGN template are at least as good at fitting the overall high- quasar SEDs as the fits using templates for local star forming galaxies of solar metallicity. The Haro 11 template fits better in the rest-frame mid-IR, but may be slightly worse in the far-IR range. Though the Leipski et al. (2013) model could reproduce more details of the observed SED, our two-component model yields fits of comparable overall quality and is preferred in model selection due to its simplicity.
4. AGN and host galaxy decomposition for quasars at
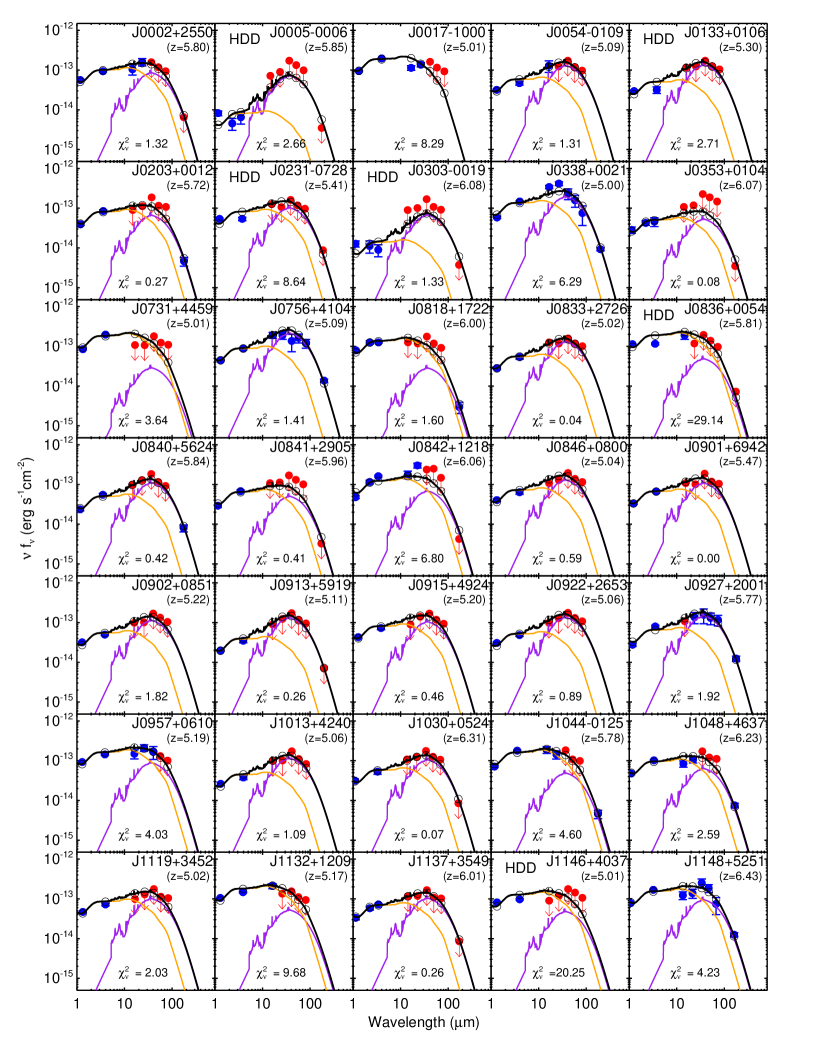
Combining Herschel, Spitzer and ground-based 250 GHz observations, we apply the “Haro 11 + AGN” two-component fit to the observed SEDs of all 69 quasars in Leipski et al. (2014) (hereafter, sample-A). Since our interest is the infrared output, we again limit the fit to rest-frame . The fits are presented in Figure 6. We can confirm again the suitability of the modified Elvis et al. (1994) AGN template: the near-IR to mid-IR SEDs of these quasars are well-matched with our empirical AGN template in 58 cases. Combining with the Haro 11 template, this modified Elvis et al. (1994) AGN template provides reasonably good fittings to all these quasars, which suggests the Elvis et al. (1994) AGN template derived on local quasars is suitable for vast majority of quasars. There are 11 cases where the Elvis template overestimates the mid-infrared, which is the signature of HDD quasars: the incidence of this behavior () is similar to that observed at lower redshift (Mor & Trakhtenbrot, 2011). The , derived total infrared luminosities (), and host component contributions from the fits are listed in Table 3. We also calculate the star formation rates using the method described in Section 5.3
We can compare the results of the host galaxy far-IR luminosity with other works. It is frequently assumed that the far-IR SED of high- quasars can be described as a K and modified black body (Beelen et al., 2006) and the infrared luminosity of this component is used to estimate their star formation rates (e.g., Omont et al., 2013; Leipski et al., 2013, 2014; Calura et al., 2014; Willott et al., 2015). However, real galaxies have strong mid-infrared emission that is under-represented by a single (modified) black body SED (e.g., Dunne & Eales, 2001; Willmer et al., 2009; Galametz et al., 2012; Kirkpatrick et al., 2012). With the inclusion of the mid-IR energy contribution from star formation, the Haro 11 template yields an infrared luminosity 1.5-2.0 times larger than the infrared luminosity of the Beelen et al. (2006) modified back body template , depending on the exact far-IR constraints to the galaxy component. Compared with the Leipski et al. (2014) results from the four-component decomposition on 19 quasars with most complete IR SED observations, our results are different, especially for the host galaxy far-IR luminosity. For a quasar with strong host galaxy far-IR emission, its mid-IR emission will be dominated by star formation. Since the modified black body misses significant luminosity at shorter wavelengths, the Leipski et al. (2013) model has to scale up the torus component to fit the rest-frame mid-IR data, ending with an overestimated fraction of the far-IR emission due to the AGN (the torus) and an underestimated host galaxy contribution. Consequently, the star formation rates derived by the Leipski et al. (2013) model in such cases (like SDSS J0756+4104, J0927+2001, J1202+3235, J1340+2813, which have ) are much lower than our values. For a quasar without strong host galaxy far-IR emission, however, the Leipski et al. (2013) model gives a higher than our . Examples are SDSS J0842+1218, J1044-0125, J1048+4637, J1148+5251, J1659+2709, with . This discrepancy is still due to the template differences. The torus templates used in Leipski et al. (2013, 2014) by themselves generally underpredict the far-IR emission compared with our AGN template. As a result, the far-IR modified black body has to be scaled up to match the far-IR observations. We believe the star formation rate based on the from our model is more reliable, since 1) the host galaxy template is based on a real galaxy that includes the mid-IR star formation contribution; 2) the relative contributions of the torus and near-IR component are fixed in our AGN template that is based on real observations. In addition, thanks to the simplicity of the two-component model, we can place constraints on the host galaxy star formation for the other 50 quasars in Leipski et al. (2014), which only have upper-limits for the MIR-FIR SEDs and the Leipski et al. (2013) model can not fit. We will discuss our model results in Section 5.
| Source | () | SFR() | |||||
|---|---|---|---|---|---|---|---|
| (1) | (2) | (3) | (4) | (5) | (6) | (7) | (8) |
| SDSS J000239.39+255034.8 | 5.80 | 19.0 | 1.32 | 3.18 | 0.44 | 0.88 | 2394 |
| SDSS J000552.34000655.8* | 5.85 | 20.8 | 2.66 | 1.34 | 0.89 | 0.61 | 1408 |
| SDSS J001714.67100055.4 | 5.01 | 19.4 | 8.29 | 2.39 | 0.00 | 1.00 | 0.20(?) |
| SDSS J005421.42010921.6 | 5.09 | 20.5 | 1.31 | 2.32 | 0.68 | 1.00 | 3006 |
| SDSS J013326.84+010637.7* | 5.30 | 20.7 | 2.71 | 2.49 | 0.72 | 1.00 | 3425 |
| SDSS J020332.35+001228.6 | 5.72 | 20.9 | 0.27 | 2.44 | 0.43 | 1.00 | 2028 |
| SDSS J023137.65072854.5* | 5.41 | 19.5 | 8.64 | 2.66 | 0.54 | 1.00 | 2750 |
| SDSS J030331.40001912.9* | 6.08 | 21.3 | 1.33 | 1.51 | 0.82 | 0.62 | 1467 |
| SDSS J033829.31+002156.3 | 5.00 | 20.0 | 6.29 | 3.93 | 0.57 | 1.00 | 4305 |
| SDSS J035349.72+010404.4 | 6.07 | 20.2 | 0.08 | 1.97 | 0.49 | 0.69 | 1281 |
| SDSS J073103.12+445949.4 | 5.01 | 19.1 | 3.64 | 2.63 | 0.13 | 1.00 | 643 |
| SDSS J075618.14+410408.6 | 5.09 | 20.1 | 1.41 | 3.73 | 0.69 | 1.00 | 4964 |
| SDSS J081827.40+172251.8 | 6.00 | 19.3 | 1.60 | 3.13 | 0.16 | 1.00 | 971 |
| SDSS J083317.66+272629.0 | 5.02 | 20.3 | 0.04 | 2.20 | 0.69 | 1.00 | 2901 |
| SDSS J083643.85+005453.3* | 5.81 | 18.8 | 29.14 | 4.19 | 0.19 | 1.00 | 1544 |
| SDSS J084035.09+562419.9 | 5.84 | 20.0 | 0.42 | 2.72 | 0.67 | 1.00 | 3504 |
| SDSS J084119.52+290504.4 | 5.96 | 19.6 | 0.41 | 2.10 | 0.42 | 0.69 | 1167 |
| SDSS J084229.23+121848.2 | 6.06 | 19.9 | 6.80 | 3.66 | 0.34 | 0.61 | 1448 |
| SDSS J084627.85+080051.8 | 5.04 | 19.6 | 0.59 | 2.44 | 0.63 | 1.00 | 2938 |
| BWE 910901+6942 | 5.47 | 19.8 | 0.00 | 2.58 | 0.60 | 1.00 | 2979 |
| SDSS J090245.77+085115.8 | 5.22 | 20.6 | 1.82 | 2.20 | 0.66 | 1.00 | 2785 |
| SDSS J091316.56+591921.5 | 5.11 | 21.5 | 0.26 | 2.12 | 0.76 | 0.97 | 2996 |
| SDSS J091543.64+492416.7 | 5.20 | 19.3 | 0.46 | 2.43 | 0.55 | 1.00 | 2557 |
| SDSS J092216.82+265359.1 | 5.06 | 20.4 | 0.89 | 2.27 | 0.71 | 1.00 | 3099 |
| SDSS J092721.82+200123.7 | 5.77 | 19.9 | 1.92 | 3.51 | 0.68 | 1.00 | 4561 |
| SDSS J095707.67+061059.5 | 5.19 | 19.0 | 4.03 | 3.35 | 0.33 | 1.00 | 2151 |
| SDSS J101336.33+424026.5 | 5.06 | 19.4 | 1.09 | 1.95 | 0.71 | 1.00 | 2647 |
| SDSS J103027.10+052455.0 | 6.31 | 19.7 | 0.07 | 3.35 | 0.63 | 0.78 | 3165 |
| SDSS J104433.04012502.2 | 5.78 | 19.2 | 4.60 | 3.64 | 0.22 | 1.00 | 1530 |
| SDSS J104845.05+463718.3 | 6.23 | 19.2 | 2.59 | 3.23 | 0.38 | 1.00 | 2360 |
| SDSS J111920.64+345248.2 | 5.02 | 20.2 | 2.03 | 2.26 | 0.53 | 1.00 | 2278 |
| SDSS J113246.50+120901.7 | 5.17 | 19.4 | 9.68 | 3.10 | 0.21 | 1.00 | 1262 |
| SDSS J113717.73+354956.9 | 6.01 | 19.6 | 0.26 | 3.18 | 0.58 | 0.90 | 3207 |
| SDSS J114657.79+403708.7* | 5.01 | 19.7 | 20.25 | 2.16 | 0.26 | 1.00 | 1072 |
| SDSS J114816.64+525150.3 | 6.43 | 19.0 | 4.23 | 5.48 | 0.36 | 1.00 | 3801 |
| RD J1148+5253 | 5.70 | 23.1 | 0.00 | 2.58 | 0.93 | 0.96 | 4406 |
| SDSS J115424.74+134145.8 | 5.08 | 20.9 | 1.76 | 2.29 | 0.59 | 1.00 | 2571 |
| SDSS J120207.78+323538.8 | 5.31 | 18.6 | 2.93 | 4.79 | 0.44 | 1.00 | 4046 |
| SDSS J120441.73002149.6 | 5.03 | 19.1 | 4.33 | 4.42 | 0.54 | 1.00 | 4547 |
| SDSSp J120823.82+001027.7* | 5.27 | 20.5 | 0.29 | 1.99 | 0.91 | 0.90 | 3125 |
| SDSS J122146.42+444528.0 | 5.19 | 20.4 | 6.62 | 2.35 | 0.37 | 1.00 | 1683 |
| SDSS J124247.91+521306.8* | 5.05 | 20.6 | 3.97 | 1.82 | 0.67 | 1.00 | 2344 |
| SDSS J125051.93+313021.9 | 6.13 | 19.6 | 21.44 | 4.08 | 0.25 | 1.00 | 1954 |
| SDSS J130608.26+035626.3 | 6.02 | 19.6 | 0.04 | 2.76 | 0.70 | 0.81 | 2992 |
| SDSS J133412.56+122020.7 | 5.14 | 19.5 | 1.05 | 2.65 | 0.37 | 1.00 | 1869 |
| SDSS J133550.81+353315.8 | 5.90 | 19.9 | 2.12 | 2.41 | 0.60 | 1.00 | 2762 |
| SDSS J133728.81+415539.9 | 5.03 | 19.7 | 0.33 | 2.09 | 0.56 | 1.00 | 2261 |
| SDSS J134015.04+392630.8 | 5.07 | 19.6 | 5.46 | 2.89 | 0.37 | 1.00 | 2031 |
| SDSS J134040.24+281328.2 | 5.34 | 19.9 | 0.09 | 5.03 | 0.46 | 1.00 | 4404 |
| SDSS J134141.46+461110.3 | 5.01 | 21.3 | 0.01 | 2.08 | 0.64 | 1.00 | 2558 |
| SDSS J141111.29+121737.4* | 5.93 | 20.0 | 7.51 | 2.21 | 0.64 | 0.68 | 1827 |
| SDSS J142325.92+130300.7 | 5.08 | 19.6 | 0.12 | 2.47 | 0.37 | 1.00 | 1740 |
| FIRST J142738.5+331241 | 6.12 | 20.3 | 2.20 | 2.22 | 0.69 | 0.65 | 1910 |
| SDSS J143611.74+500706.9 | 5.83 | 20.2 | 0.01 | 2.83 | 0.72 | 0.86 | 3346 |
| SDSS J144350.67+362315.2 | 5.29 | 20.3 | 40.79 | 4.85 | 0.00 | 1.00 | 1.6(?) |
| SDSS J151035.29+514841.0 | 5.11 | 20.1 | 0.14 | 2.34 | 0.44 | 1.00 | 1976 |
| SDSS J152404.10+081639.3 | 5.08 | 20.6 | 0.02 | 2.22 | 0.75 | 1.00 | 3196 |
| SDSS J160254.18+422822.9 | 6.07 | 19.9 | 2.62 | 3.25 | 0.32 | 0.68 | 1341 |
| SDSS J161425.13+464028.9 | 5.31 | 20.3 | 7.25 | 3.20 | 0.28 | 1.00 | 1729 |
| SDSS J162331.81+311200.5 | 6.25 | 20.1 | 1.46 | 2.59 | 0.43 | 0.99 | 2107 |
| SDSS J162626.50+275132.4 | 5.30 | 18.7 | 7.64 | 5.35 | 0.03 | 1.00 | 292 |
| SDSS J162629.19+285857.6 | 5.02 | 19.9 | 0.95 | 1.32 | 0.20 | 1.00 | 503 |
| SDSS J163033.90+401209.6 | 6.07 | 20.6 | 0.49 | 1.87 | 0.78 | 0.63 | 1752 |
| SDSS J165902.12+270935.1 | 5.32 | 18.8 | 11.12 | 3.76 | 0.21 | 1.00 | 1547 |
| SDSS J205406.49000514.8 | 6.04 | 20.6 | 1.47 | 3.15 | 0.41 | 1.00 | 2501 |
| SDSS J211928.32+102906.6 | 5.18 | 20.6 | 1.49 | 1.40 | 0.32 | 1.00 | 857 |
| SDSS J222845.14075755.2* | 5.14 | 20.2 | 6.81 | 1.34 | 0.62 | 1.00 | 1593 |
| WFS J2245+0024* | 5.17 | 21.8 | 2.38 | 2.15 | 0.89 | 1.00 | 3685 |
| SDSS J231546.57002358.1 | 6.12 | 21.3 | 1.41 | 1.94 | 0.76 | 0.61 | 1741 |
Note. — Col. (1): Object name with a * is identified as a hot dust deficient (HDD) quasar; Col. (2): Redshift; Col. (3): Rest-frame 1450Å apparent magnitudes, or mag(1450Å); Col. (4): Reduced chi-square, as defined in 2.3; Col. (5): The integrated infrared luminosity (8-1000 ) from the fitted two-component SED models; if there are no any detections with , the derived AGN contribution is put as an upper limit; the host galaxy contribution is treated as an upper limit if there is no detection at ; Col. (6): Relative contribution of the galaxy component to . Col. (7): Correction of the host IR luminosity for the derivation of SFR; Col. (8): Star formation rate estimated from the galaxy component luminosity, assuming the Haro 11 star formation law; a question mark indicates the quasar has a minimal host contribution in the IR, in which case the derived SFR is dubious and not used in the analysis.
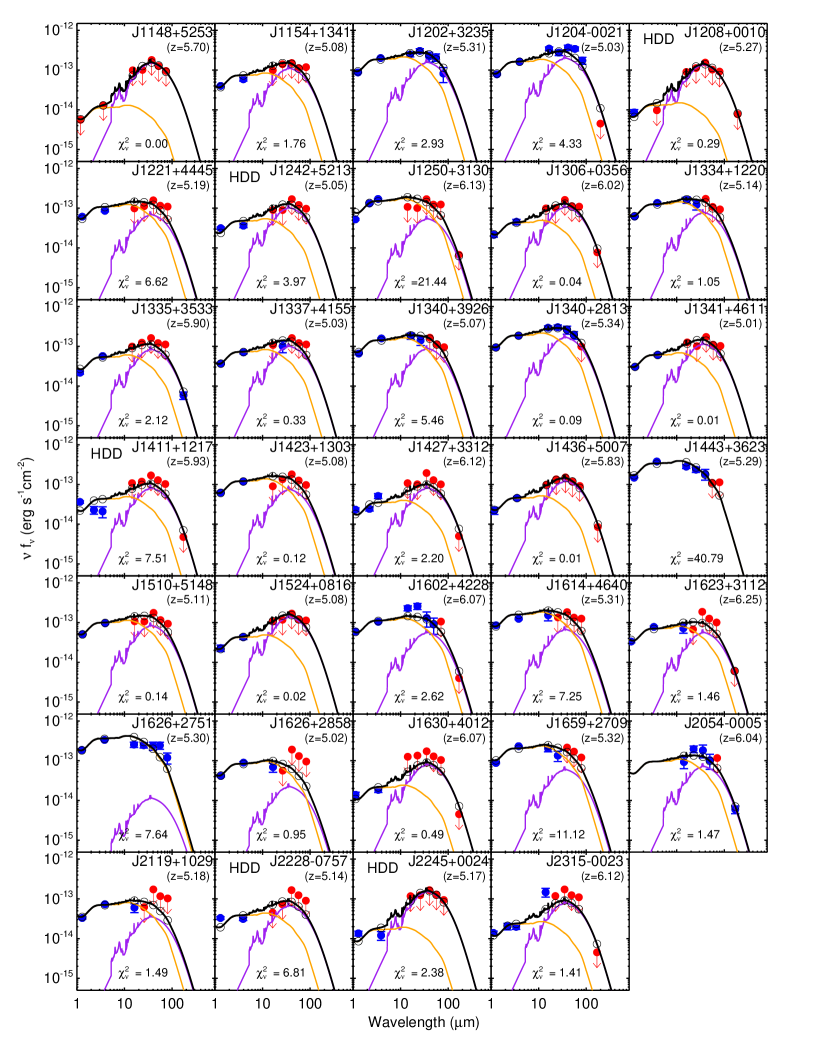
We also searched for other quasars with rest-frame far-IR observations in the literature and found 33 more quasars not included in Leipski et al. (2014) (hereafter sample B). The majority of them have been listed in Calura et al. (2014), except for RD J0301+0020 and TN J0924-2201. We collected all available observations on dust continuum as well as the UV/optical continuum (Bertoldi & Cox, 2002; Petric et al., 2003; Wang et al., 2008b, 2011b, 2011c, 2013; Omont et al., 2013; Willott et al., 2013, 2015; Barnett et al., 2015). Because of the lack of constraints on the near-IR and mid-IR bands, we did not make full fits as for the cases in sample-A, but scaled the templates to some specific data points. For the AGN component, considering the potential extinction effect and possible lack of hot dust emission (to be discussed in Section 5), we scale the template to the data point at , which yields a maximum AGN luminosity. For the host component, we scale the Haro 11 template to the data point at , which yields a minimum IR luminosity. Then we calculated their total infrared luminosities, the fraction of host contribution, and star formation rates, as summarized in Table 4. Compared with sample-A, sample-B contains less-luminous quasars (mainly contributed by the Canada-France High-z Quasar Survey, see Omont et al. 2013 and references therein), and consists almost entirely of quasars at .
In the following discussion, we will mainly focus on sample-A, whose data points are more uniformly collected and have the same detection limits. We will discuss sample-B only as a complement to conclusions based on sample-A.
| Source | () | fhost,IR | SFR() | ||
|---|---|---|---|---|---|
| (1) | (2) | (3) | (4) | (5) | (6) |
| SDSS J003311.40-012524.9 | 6.13 | 21.53 | 0.81 | 0.69 | 1079 |
| CFHQS J005006+344522 | 6.25 | 19.84 | 2.99 | 0.46 | 2643 |
| CFHQS J005502+014618 | 6.02 | 21.82 | 0.28 | 0.33 | 179 |
| CFHQS J010250-021809 | 5.95 | 22.02 | 1.27 | 0.88 | 2141 |
| SDSS J012958.51-003539.7 | 5.78 | 22.28 | 1.16 | 0.90 | 2013 |
| CFHQS J013603+022605 | 6.21 | 22.04 | 3.09 | 0.65 | 3852 |
| CFHQS J021013-045620 | 6.44 | 22.25 | 0.19 | 0.25 | 92 |
| CFHQS J021627-045534 | 6.01 | 24.15 | 1.11 | 0.98 | 2082 |
| CFHQS J022122-080251 | 6.16 | 21.98 | 2.26 | 0.93 | 4016 |
| CFHQS J022743-060530 | 6.20 | 21.41 | 1.08 | 0.73 | 1522 |
| SDSS J023930.24-004505.4 | 5.82 | 22.28 | 1.66 | 0.93 | 2945 |
| RD J0301+0020 | 5.50 | 23.40 | 0.52 | 0.91 | 906 |
| CFHQS J031649-134032 | 5.99 | 21.72 | 3.89 | 0.95 | 7077 |
| TN J0924-2201 | 5.20 | – | 1.04 | 0.84 | 1659.35 |
| CFHQS J105928-090620 | 5.92 | 20.75 | 2.06 | 0.60 | 2377 |
| ULAS J1120+0641 | 7.08 | – | 0.42 | 0.63 | 513 |
| ULAS J131911.29+095051.4 | 6.13 | 19.65 | 3.47 | 0.59 | 3927 |
| SDSS J142516.30+325409.0 | 5.85 | 20.62 | 1.89 | 0.50 | 1810 |
| CFHQS J142952+544717 | 6.21 | 20.59 | 2.68 | 0.63 | 3246 |
| SDSS J150941.78-174926.8 | 6.12 | 19.63 | 2.52 | 0.43 | 2057 |
| SDSS J162100.70+515544.8 | 5.71 | 19.89 | 4.21 | 0.18 | 1438 |
| SDSS J164121.64+375520.5 | 6.04 | 21.19 | 1.17 | 0.71 | 1603 |
| SDSS J205321.77+004706.8 | 5.92 | 21.20 | 1.34 | 0.76 | 1946 |
| CFHQS J210054-171522 | 6.09 | 21.37 | 3.46 | 0.24 | 1604 |
| SDSS J214755.40+010755.0 | 5.81 | 21.65 | 1.44 | 0.65 | 1782 |
| CFHQS J222901+145709 | 6.15 | 21.90 | 0.19 | 0.06 | 22 |
| CFHQS J224237+033421 | 5.88 | 22.09 | 1.48 | 0.90 | 2561 |
| SDSS J230735.35+003149.4 | 5.87 | 21.73 | 1.68 | 0.45 | 1460 |
| SDSS J231038.88+185519.7 | 6.00 | 19.30 | 6.07 | 0.69 | 7996 |
| CFHQS J231802-024634 | 6.05 | 21.55 | 1.38 | 0.82 | 2178 |
| SDSS J232908.28-030158.8 | 6.43 | 21.53 | 1.38 | 0.00 | 0.0(?) |
| CFHQS J232914-040324 | 5.90 | 21.96 | 1.14 | 0.86 | 1886 |
| SDSS J235651.58+002333.3 | 6.00 | 21.77 | 1.06 | 0.81 | 1653 |
Note. — Col. (1): Quasar name; Col. (2): Redshift; Col. (3): Rest-frame 1450Å AB apparent magnitudes, or mag(1450Å); Col. (4): The integrated infrared luminosity (8-1000 ) from the fit two-component SED models; if there is no detection with , the derived AGN contribution is put as an upper limit; the host contribution is treated as an upper limit if the quasar is not detected at ; Col. (5): Relative contribution of the galaxy component to ; Col. (6): Star formation rate estimated from the galaxy component luminosity, assuming the Haro 11 star formation law; a question mark indicates the quasar has a minimal host contribution in the IR, in which case the derived SFR is dubious and not used in the analysis.
5. Discussion
5.1. Heating Sources for the Infrared Energy Output
To study the host galaxies of high- quasars from infrared SEDs, the heating sources of the infrared-emitting dust and the contribution from the host star formation should be examined first. Previously, a number of papers made the assumption that the heating process for the FIR-emitting warm dust is dominated by host star formation (e.g., Leipski et al., 2014), or assumed some conservative fraction of host star formation heating (e.g., Wang et al., 2011c). From a theoretical point of view, Li et al. (2008) and Schneider et al. (2014) studied the heating of the observed SED of J1148+5251, an archetypal high-luminosity high-redshift quasar. They argued that the heating of the dust in the host galaxy could be dominated by processes related to the central engine, rather than the host star formation. This field is quite controversial.
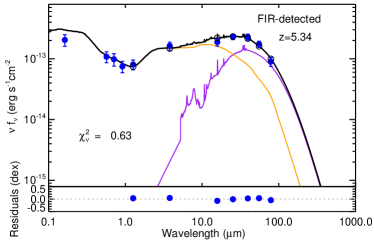
As shown in Figure 6, the AGN template from Xu et al. (2015b) is not sufficient to reproduce the far-IR SED of many quasars with rest-frame far-IR detections. To investigate the average infrared properties of these quasars, we fit the three stacked SEDs in Leipski et al. (2014), shown in Figure 4. For the FIR-detected SED (from objects detected at least three Herschel bands), we can see a clear contribution in the far-IR from the host galaxy. For the partly detected SED (from objects with significant PACS 100 and/or 160 flux), the AGN template alone is enough to reproduce the SED. For the objects without any Herschel detections, there are some HDD quasars with SEDs deviating from normal AGNs, as indicated by the low ratio of rest 24 to optical. The stacked SEDs for the 14 partly Herschel detected and the 33 non-detected systems show no evidence for significant far-IR output over that of typical quasar templates. It would be difficult to understand why just 10 of this sample had strong heating of the host galaxy ISM by the quasar. A plausible explanation is that these 10 Herschel-detected systems have high levels of star formation, while for the other quasars the star formation is weak.
| Source | N | Redshift | LIR/L⊙ | fhost,IR | SFR() | |
|---|---|---|---|---|---|---|
| (1) | (2) | (3) | (4) | (5) | (6) | (7) |
| FIR-detected | 10 | 5.34 | 4.08 | 0.47 | 0.63 | 3666 |
| partly-detected | 14 | 5.31 | 2.04 | 0.00 | 0.20 | (?) |
| non-detected | 33 | 5.20 | 0.87 | 0.00 | 0.61 | (?) |
Note. — Results of full IR fits. Upper-limit data points are included in the evaluation process.
Col. (1): Type of stacked SED; Col. (2): The number of stacked quasars; Col. (3): Average redshift; Col. (4): The total infrared luminosity (8-1000 ) estimated from the “Haro 11 + AGN” two-component SED fit; Col. (5): The fraction of luminosity of host template contribution to the whole fit SED, based on result from the “Haro 11 + AGN” decomposition; Col. (6): Reduced chi-square from the “Haro 11 + AGN” decomposition; Col. (7): Estimation of the star formation rate.
At very high redshift, cosmic microwave background (CMB) is also a source for dust heating (da Cunha et al., 2013). However, since the dust temperatures in high- quasar host galaxies are typically 35-50K (e.g., Xu et al. 2015b; Leipski et al. 2014), at least twice the CMB temperature for the relevant redshift range (K at ), a correction is not significant compared with the other uncertainties in our derivations.
5.2. Are AGN Host Galaxies at Low-metallicity?
For quasars at , emission line ratios are found to trace (super-)solar gas metallicities (up to ) in broad line regions (BLRs) without any strong indication of redshift evolution (Nagao et al., 2006, 2012; Jiang et al., 2007; Juarez et al., 2009). However, the mass of the BLRs is small (), and might not be representative of the overall formation history of the galaxy. Wang et al. (2010a, 2011a) showed that the star formation can be enhanced in the accretion flow of the AGN, possibly resulting in locally increased metallicity. The narrow-line regions (NLRs) of quasars at are also found to be around solar-metallicity without strong evolution (Matsuoka et al., 2009). In contrast with the BLRs, the typical size of the NLRs ( pc, Bennert et al. 2006b, a) is comparable to the size of the host galaxies. The only quasar beyond with a NLR metallicity constraint is TN J09242201, a type-2 radio galaxy at (Matsuoka et al., 2011). Considering the small sample size and uncertainty of the metallicity calibration, the result for TN J09242201 does not provide much knowledge of the metallicity in the quasars. We do not have observational constraints on the metallicity of these quasar hosts from emission line analysis.
Another possible approach to get metallicity constraints on (or near) distant quasar hosts is from analyzing the absorbers with high H I content (), or so-called damped Lyman-alpha (DLA) systems, at the redshift of the quasar (Hennawi et al., 2009; Zafar et al., 2011). Hennawi et al. (2009) reported the discovery of a bright Lyman- blob associated with the quasar SDSS J124020.91+145535.6 and gave a lower limit to the gas metallicity . Zafar et al. (2011) studied a physical quasar pair Q0151+048 () and suggested an overall metallicity of for a DLA associated with one member. The redshifts of these two quasars are relatively low. It is also not clear if they are representative of the general population. As argued by Finley et al. (2013), statistical study shows the absorption of the associated DLAs is more likely to happen in the galaxies neighboring the quasar, rather than in the AGN host galaxy. Further detailed studies on larger samples are needed to make any conclusive argument.
Several works argued that some massive galaxies at high- have solar metallicity (e.g., Maiolino et al., 2008; Mannucci et al., 2009; Rawle et al., 2014). It is possible that these objects are mature and highly evolved. However, we should be cautious about the derived metallicity with very limited data points for individual sources. Convincing measurements of metallicity at high- require more understanding of the ISM in these systems. For galaxies, statistical studies based on multiple metallicity tracers show that their metallicities drop at large masses (Maier et al., 2014; Cullen et al., 2014). For the very early Universe, simulations suggest population III stars contribute little to the chemical enrichment of the ISM (Valiante et al., 2009). The existence of a huge population of low-metallicity systems between the cosmic reionization and should be expected. Since high- quasars are originally identified by their AGN features, the properties of their host galaxies should not be much biased by the selection. It is therefore plausible that the high- quasar host galaxies have metallicities moderately, if not substantially, below solar.
In this work, hints for the low-metallicity of the AGN host galaxies at are from the successful reproduction of the observed SEDs based on two-component fits, as shown in Section 3.3. The high dust temperature and boosted mid-IR emission are two major features of the IR SED of Haro 11, a dwarf galaxy with metallicity . For the IR SED of these quasars, the low-metallicity Haro 11 template works significantly better than the normal SF templates.
Xu et al. (2015b) discovered a warm mid-IR component of some type-1 quasars at , which can not be reproduced by the combination of the AGN template and normal SF template. This warm excess is found to be more prominent at higher redshifts in their sample. As shown in Section 3.3, a strong mid-IR SED excess also does exist when fitting the host galaxy with normal SF templates for the quasars. In contrast, by introducing the Haro 11 template, the mid-IR part of the SED of the quasars is reproduced better: there is no strong hint of the warm excess for the majority of the quasars. The low-metallicity of the host galaxy is a possible explanation for many such warm excesses at high-: the dust population in the low-metallicity environment tends to be dominated by small-size grains, which would result in substantial emission in the mid-infrared. Due to the increase of the mid-IR emission, the effective dust temperature fit from the whole infrared SED is also boosted. Nonetheless, a small number of quasars still show a mid-IR warm excess, such as J0338+0021 and J1602+4228, even with the Haro 11 template fitting. We suggest that such additional warm excess not reproduced by the “Haro 11 + AGN” SED model could be due to an extreme circumnuclear starburst or that the host galaxy has a much lower metallicity.
5.3. The Star Formation Rates of Quasars at
In estimating a SFR, the largest uncertainty comes from the assumed star formation calibration. In Appendix B, the star formation determination for the low-metallicity dwarf galaxies is discussed. We show that the Kennicutt (1998) IR star formation law is still valid to roughly estimate the obscured star formation rates for the low-metallicity dwarf galaxies, including Haro 11. Besides the obscured star formation, we also consider the unobscured star formation as revealed by the UV emission. As shown in Appendix B.2, Haro 11 has a low UV star formation rate estimate, which is only 10% of that deduced from the far-IR. For a infrared SFR, the corresponding UV SFR would be , consistent with the upper limit given for the archetypal quasar J1148+5251 (Mechtley et al., 2012). The UV star formation of high-luminosity quasar host galaxies at is also found to be quite weak (Cai et al., 2014). These examples indicate that a low contribution to the estimated SFR from the UV is appropriate for quasar host galaxies identical to those for J1148+5251 and the Cai et al. (2014) quasar sample. However, we can not rule out the possibility that some of the host galaxies at the epoch of reionization have larger escape fractions than Haro 11 and hence a large fraction of UV emission, causing us to underestimate their total SFRs.
Many censored data points also make the SFR estimation difficult. For the quasars with at least two detections in the far-IR, the host galaxies are reasonably well fit. The derived star formation rates are on the order of , a typical value also found by other authors (e.g., Wang et al., 2008b; Leipski et al., 2014). For quasars without any far-IR detections, we could only determine the upper-limits of their SFRs. As described in Section 2.3, we consider all the censored data points during the fitting process. For sources without far-IR detections, the fitted upper limits on the SFRs are based on templates constrained by multiple 3- non-detections and result in overestimated SFR constraints. To solve this problem, we scale the host template to each non-detected 3-limit observation, derive the respective SFR, and pick the lowest one as the final constraint on the quasar host SFR. During this process, the contribution of the fitted AGN component is fixed and subtracted when deriving the SFR.
For the HDD quasars, the AGN template fails at . In addition, none of them are detected in the far-IR. To derive conservative upper limits for their SFRs, we assume that all their far-IR emission comes from the host galaxy. Consequently, we ignore the fitted AGN component when we scale the host template to the observations.
We ignore the results for J00171000 and J1443+3623 of sample-A, whose host contribution is too minimal to be evaluated. From Kaplan-Meier analysis333As implemented in the Astronomy Survival Analysis Package (ASURV, Lavalley et al. 1992), the mean infrared host galaxy luminosity of the sample-A is
| (sample A) |
which corresponds to an average star formation rate
| (sample A) |
Another approach to compute the average star formation rate is to analyze the stacked SEDs. As shown in Figure 4 and Table 5, the fraction of the host contribution is too small to give any physical constraints on the SFR of the stacked SEDs of Herschel partly- and non-detected quasars. We simply conclude substantial star formation only happens in the Herschel FIR-detected stacked SED, whereas the star formation in other stacked SEDs is minimal and set to be zero. Then an arithmetic mean of sample-A is
| (A-stacked) |
This result is almost the same as that from the Kaplan-Meier analysis for individual sources, confirming the validity of the result from the Kaplan-Meier estimator.
For sample-B, after rejecting SDSS J2329-0301 due to its minimal host contribution, we use the Kaplan-Meier approach to derive a mean infrared luminosity for 32 quasars
| (sample B) |
which corresponds to an average star formation rate
| (sample B) |
This estimate is subject to systematic errors because the majority of the sample-B members only have submillimeter measurements at 1.2 mm, and these fall well beyond the peaks of their far-IR SEDs. Therefore, any deviation of the SED from the template will result in significant errors in the estimate of infrared luminosity. Nonetheless, within the errors, this is similar to that from sample-A. In fact, we will show in Section 5.5 that the indicated slightly lower SFRs for sample-B is as might be expected from the generally lower luminosities of their AGNs.
We believe that the average SFR estimated above is robust even if Haro 11 is not representative for some quasar host galaxies. As shown in Section 3.1, the results from the Haro 11 template are not substantially different from the normal SF templates in Rieke et al. (2009). In fact, the AGN template is principally fixed by data points at , leaving the SF template to be matched to the mid-IR to far-IR SED. The large range between the maximum star formation rates and the averages suggests that star formation is very “bursty” in the host galaxies, and that the averages can be considered to represent the rates integrated over time. These issues are discussed in Section 5.5.
5.4. AGN Luminosity
The total AGN luminosity can be estimated from integrating the Elvis template (e.g., Hao et al. 2014, Xu et al. 2015b. Since our fits are limited to the infrared (1-1000 ), the total AGN luminosity can be derived by scaling an infrared-to-bolometric correction of 5.28 (Xu et al., 2015b) to the AGN total infrared luminosity 444For quasars with upper limits in Table 3, we can still get their AGN total infrared luminosities: , where is the host galaxy contribution upper limit.. Before that, we check the validity of the Elvis template in the UV/optical bands. As shown in Figure 4, the Elvis et al. (1994) template reproduces the UV to mid-IR stacked SED of these quasars well. For individual sources, although there are some detailed offsets, the Elvis template generally matches the observations. The monochromatic flux at rest frame 1450Å is a frequently used indicator of AGN UV continuum brightness in the literature. By applying a scaling factor of 4.65555This value is derived based on the Richards et al. (2006) template. on the (1450Å), the AGN bolometric luminosity can be estimated. Taking mag(1450Å) in the literature as a crude but independent tracer of AGN bolometric luminosity, in Figure 7, we plot the mag(1450Å)-based AGN bolometric luminosities against the -based ones. There is a small offset from 1:1 on the correlation between the AGN luminosities from mag(1450Å) and from the infrared bolometric correction, which can be explained by possible UV extinction. In summary, though the normalization of the AGN template is constrained by the rest-frame near-IR to mid-IR data points, the residuals of observed UV/optical SEDs from the IR fit to the Elvis template are generally small.
Leipski et al. (2014) pointed out 11 quasars with a dearth of very hot dust. We confirm their peculiarity by comparing their observed SEDs with the Elvis template. If normalized at UV/optical wavelengths, the Elvis template clearly overestimates the observed SED beyond rest frame 1 . Since we do not have a clear picture of the full wavelength SED of these HDD objects, their luminosities are hard to derive. We still rely on the -based luminosity, rather than UV-based luminosity, for two reasons: (1) the UV-optical SED could suffer extinction, thus underestimating the total bolometric luminosity; (2) the UV emission is not isotropic while the sources are optically thin in the near- and mid-IR (Marconi et al., 2004). Judging by the UV/optical observation, we do not expect the template-derived luminosity has more than one order of magnitude deviation from the observed one. In Figure 7, it is interesting to note the HDD quasars in this work generally follow the same trend as normal quasars.
Finally, we can derive the average AGN bolometric luminosity of sample-A with standard error to be:
| (sample A) |
Similarly, sample-B has
| (sample B) |
This value is of sample-A
5.5. Implications for BH-galaxy Evolution
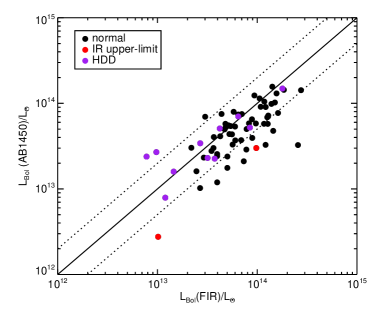
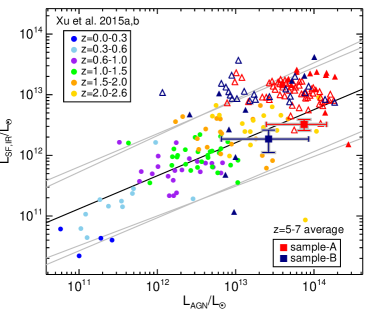
We now compare the relative strength between SF activities and AGN luminosities of quasars with that of relatively low- and intermediate- quasars. In Figure 8, we put the average values for quasars on the relation between SF IR luminosity, , and AGN luminosity, , for the Xu et al. (2015b) type-1 quasar sample. The average properties of the quasars fall along the fit relation. This is unexpected, however, since quasars at and those at should be in different star formation phases. From a theoretical perspective, there should be no star formation main sequence as is the case in the Universe, but bursts of star formation and periods of near-zero star formation rates, likely due to the dynamically disturbed gas within the galaxy halo (e.g., Muratov et al., 2015). Current observations suggest the star formation in some quasars is extremely vigorous with SFRs at levels of (e.g., Wang et al., 2008b) or relatively mild with SFRs 50 (e.g., Willott et al., 2013). Despite this large dispersion, an underlying relation between the average host star formation and AGN luminosity, which has been suggested for very luminous AGNs at (e.g., Netzer, 2009; Rosario et al., 2012), seems to already exist at .
By taking an average of the star formation rates of quasar host galaxies in the largest sample at , we can retrieve a rough time-averaged star formation rate during the lifetime of these quasar host galaxies. In other words, we assume that the relative number of host galaxies with very active star formation (SFR) to those without significant star formation (SFR) reflects the relative time duration of the star-bursting phase to the quiescent phase of the galaxies. Since stars lose mass quickly after leaving the main sequence, we can ignore their contribution to the stellar mass of the galaxy. The main sequence lifetime of a star with mass is
| (7) |
Then we have a simple model relating the stellar mass to the galaxy growth time and the initial mass function as:
| (8) |
where is the minimum stellar mass, which is assumed to be ; is the maximum stellar mass of stars that are still on the main sequence at time (unit: Gyr); is the epoch of galaxy mass assembly.
To start, we simply assume a standard Salpeter IMF (Salpeter, 1955), and estimate the increase in host galaxy stellar mass since the start of the cosmic reionization, i.e., (Planck Collaboration et al., 2015), corresponding to a Universe age Gyr. Then the time duration from reionization to the average age of the quasars in our sample (=5.5) is Gyr. Taking the average star formation rate for sample-A and solving the integration in Equation 8, we derive the stellar mass that could form in a quasar to be
| (9) |
This rough estimate is not highly sensitive to the starting redshift, nor to the form of the standard IMF (see Table 6). For example, if we assume a start at , the total stellar mass increases by less than a factor of two. We can also change the power-law Salpeter IMF to a more realistic Kroupa & Weidner (2003) IMF with a turnover below and use the updated IR star formation calibration in Kennicutt & Evans (2012). The derived is lower by up to 10%. As a result, we estimate that the SFRs we deduce for the host galaxies are likely to result in formation of a net mass during the major assembly phases for these quasar host galaxies. Although this result was derived for sample-A, the high average SFR also exhibited for sample-B indicates it is generally true for high-redshift quasars.
We compare this mass with typical masses for the central black holes in these galaxies, (e.g., Jiang et al. 2007; Kurk et al. 2007, 2009; Willott et al. 2010a; De Rosa et al. 2011; Jun et al. 2015). It appears that the formation of stellar mass is adequate to establish at 0.1 - 1%, which is in good agreement with estimates of this parameter locally (e.g., Kormendy & Ho 2013 and references therein), and with the evidence at that the ratio does not evolve substantially with redshift. If some of the host galaxies have a larger escape fraction than Haro 11 and hence their SFRs are under-represented by our approach, this conclusion is strengthened. Our conclusion agrees with the measurement of the dynamical masses of these systems (Willott et al., 2015) that also indicates very little evolution of this ratio with redshift up to z6.
| IMF | SFR ()a | ()b | ()b |
|---|---|---|---|
| Salpeter | 621 | ||
| Kroupa | 534c |
Note. — a Values derived from sample-A; b Stellar masses derived based on Equation 8, is the redshift when the first galaxies begin to assembly their masses; c Kennicutt & Evans (2012) updated their original IR star formation calibration (Kennicutt, 1998) with the Kroupa & Weidner (2003) IMF. The SFR should be reduced to 86%.
6. Summary
In this work, we describe an effective strategy to analyze the infrared output of high- quasars. A two-component SED model to quantify and distinguish star formation and nuclear activity is proposed: the host galaxy component can be represented by the SED of Haro 11, a low-metallicity dwarf galaxy with extreme compact star-forming regions; the AGN component can be represented by the Elvis et al. (1994) AGN template with the IR star formation contribution subtracted. Such a simple model can help us have a better idea of the AGN and star formation contribution for these high- objects when only limited observations are available. Using this method, we have analyzed the AGN contribution and host galaxy contribution to the infrared SEDs of 69 quasars with Herschel observations in Leipski et al. (2014) and another 33 quasars in the literature. Our major conclusions are as follows:
1. Haro 11 is a faithful representation for the host galaxies of quasars. Besides its moderately low-metallicity, Haro 11 has a very high star formation surface density, which is common for high-redshift galaxies as well as quasar hosts.
2. The AGN contribution to the UV-to-IR SEDs of quasars can be well-represented by the Elvis et al. (1994) AGN template with the star formation contribution to the IR subtracted. For the infrared, except for the HDD quasars, there is no detectable over-prediction of the observed flux from the modified AGN template. After subtracting the AGN contribution in the IR, the residual flux can be interpreted as the IR contribution from host galaxy star formation, which is well-fit by the Haro 11 template.
3. The warm excess found for some high- quasars (see, e.g., Xu et al. 2015b) can be produced by the introduction of the Haro 11 template, suggesting this feature may reflect the low-metallicity of the quasar host. The Haro 11 template also shares the high dust temperature found in the far-IR measurements of high- quasars. That is, these two features can be explained by the dust properties and distribution in the low-metallicity environment.
4. The average SFR of the quasars observed by Herschel is , considering both far-IR detected and non-detected observations.
5. For the overall population of quasars, the total AGN luminosity and average infrared luminosity from star formation fall along the relation defined by quasars. This is unexpected since the star formation at and that at should experience different phases (e.g., bursty vs. relatively steady).
6. Assuming the sample averaged SFR is a rough time-averaged SFR estimate during the lifetime of the quasar host galaxies, we found the quasar host galaxies could form of stars. With the black hole mass measurements of these quasars, such massive host galaxies make possible a local BH-galaxy mass relation at , suggesting there may not be strong redshift evolution of the BH-galaxy mass ratio.
References
- Adamo et al. (2010) Adamo, A., Östlin, G., Zackrisson, E., et al. 2010, MNRAS, 407, 870
- Bañados et al. (2014) Bañados, E., Venemans, B. P., Morganson, E., et al. 2014, AJ, 148, 14
- Barnett et al. (2015) Barnett, R., Warren, S. J., Banerji, M., et al. 2015, A&A, 575, A31
- Beelen et al. (2006) Beelen, A., Cox, P., Benford, D. J., et al. 2006, ApJ, 642, 694
- Bennert et al. (2006a) Bennert, N., Jungwiert, B., Komossa, S., Haas, M., & Chini, R. 2006a, A&A, 459, 55
- Bennert et al. (2006b) —. 2006b, A&A, 456, 953
- Bergvall & Östlin (2002) Bergvall, N., & Östlin, G. 2002, A&A, 390, 891
- Bergvall et al. (2006) Bergvall, N., Zackrisson, E., Andersson, B.-G., et al. 2006, A&A, 448, 513
- Bertoldi & Cox (2002) Bertoldi, F., & Cox, P. 2002, A&A, 384, L11
- Blain et al. (2003) Blain, A. W., Barnard, V. E., & Chapman, S. C. 2003, MNRAS, 338, 733
- Cai et al. (2014) Cai, Z., Fan, X., Noterdaeme, P., et al. 2014, ApJ, 793, 139
- Calura et al. (2014) Calura, F., Gilli, R., Vignali, C., et al. 2014, MNRAS, 438, 2765
- Calzetti (2001) Calzetti, D. 2001, PASP, 113, 1449
- Carilli & Walter (2013) Carilli, C. L., & Walter, F. 2013, ARA&A, 51, 105
- Casey (2012) Casey, C. M. 2012, MNRAS, 425, 3094
- Cox et al. (2011) Cox, P., Krips, M., Neri, R., et al. 2011, ApJ, 740, 63
- Cullen et al. (2014) Cullen, F., Cirasuolo, M., McLure, R. J., Dunlop, J. S., & Bowler, R. A. A. 2014, MNRAS, 440, 2300
- da Cunha et al. (2013) da Cunha, E., Groves, B., Walter, F., et al. 2013, ApJ, 766, 13
- Daddi et al. (2005) Daddi, E., Dickinson, M., Chary, R., et al. 2005, ApJ, 631, L13
- Daddi et al. (2007) Daddi, E., Dickinson, M., Morrison, G., et al. 2007, ApJ, 670, 156
- De Rosa et al. (2011) De Rosa, G., Decarli, R., Walter, F., et al. 2011, ApJ, 739, 56
- Dunne & Eales (2001) Dunne, L., & Eales, S. A. 2001, MNRAS, 327, 697
- Dwek et al. (2011) Dwek, E., Staguhn, J. G., Arendt, R. G., et al. 2011, ApJ, 738, 36
- Elvis et al. (1994) Elvis, M., Wilkes, B. J., McDowell, J. C., et al. 1994, ApJS, 95, 1
- Elvis et al. (2012) Elvis, M., Hao, H., Civano, F., et al. 2012, ApJ, 759, 6
- Engelbracht et al. (2005) Engelbracht, C. W., Gordon, K. D., Rieke, G. H., et al. 2005, ApJ, 628, L29
- Engelbracht et al. (2008) Engelbracht, C. W., Rieke, G. H., Gordon, K. D., et al. 2008, ApJ, 678, 804
- Fan et al. (2004) Fan, X., Hennawi, J. F., Richards, G. T., et al. 2004, AJ, 128, 515
- Fan et al. (2006) Fan, X., Strauss, M. A., Becker, R. H., et al. 2006, AJ, 132, 117
- Finley et al. (2013) Finley, H., Petitjean, P., Pâris, I., et al. 2013, A&A, 558, A111
- Fisher et al. (2014) Fisher, D. B., Bolatto, A. D., Herrera-Camus, R., et al. 2014, Nature, 505, 186
- Fritz et al. (2006) Fritz, J., Franceschini, A., & Hatziminaoglou, E. 2006, MNRAS, 366, 767
- Galametz et al. (2009) Galametz, M., Madden, S., Galliano, F., et al. 2009, A&A, 508, 645
- Galametz et al. (2012) Galametz, M., Kennicutt, R. C., Albrecht, M., et al. 2012, MNRAS, 425, 763
- Galliano et al. (2005) Galliano, F., Madden, S. C., Jones, A. P., Wilson, C. D., & Bernard, J.-P. 2005, A&A, 434, 867
- Galliano et al. (2003) Galliano, F., Madden, S. C., Jones, A. P., et al. 2003, A&A, 407, 159
- Greve et al. (2012) Greve, T. R., Vieira, J. D., Weiß, A., et al. 2012, ApJ, 756, 101
- Grimes et al. (2007) Grimes, J. P., Heckman, T., Strickland, D., et al. 2007, ApJ, 668, 891
- Groves et al. (2008) Groves, B., Dopita, M. A., Sutherland, R. S., et al. 2008, ApJS, 176, 438
- Haas et al. (2003) Haas, M., Klaas, U., Müller, S. A. H., et al. 2003, A&A, 402, 87
- Hanish et al. (2013) Hanish, D. J., Teplitz, H. I., Capak, P., et al. 2013, ApJ, 768, 13
- Hao et al. (2011) Hao, H., Elvis, M., Civano, F., & Lawrence, A. 2011, ApJ, 733, 108
- Hao et al. (2010) Hao, H., Elvis, M., Civano, F., et al. 2010, ApJ, 724, L59
- Hao et al. (2014) —. 2014, MNRAS, 438, 1288
- Hayes et al. (2007) Hayes, M., Östlin, G., Atek, H., et al. 2007, MNRAS, 382, 1465
- Heckman & Best (2014) Heckman, T. M., & Best, P. N. 2014, ARA&A, 52, 589
- Hennawi et al. (2009) Hennawi, J. F., Prochaska, J. X., Kollmeier, J., & Zheng, Z. 2009, ApJ, 693, L49
- Hodge et al. (2015) Hodge, J. A., Riechers, D., Decarli, R., et al. 2015, ApJ, 798, L18
- Hönig & Kishimoto (2010) Hönig, S. F., & Kishimoto, M. 2010, A&A, 523, A27
- Hopkins et al. (2002) Hopkins, A. M., Schulte-Ladbeck, R. E., & Drozdovsky, I. O. 2002, AJ, 124, 862
- Huang et al. (2014) Huang, J.-S., Rigopoulou, D., Magdis, G., et al. 2014, ApJ, 784, 52
- Isobe et al. (1986) Isobe, T., Feigelson, E. D., & Nelson, P. I. 1986, ApJ, 306, 490
- Jahnke et al. (2009) Jahnke, K., Bongiorno, A., Brusa, M., et al. 2009, ApJ, 706, L215
- James et al. (2013) James, B. L., Tsamis, Y. G., Walsh, J. R., Barlow, M. J., & Westmoquette, M. S. 2013, MNRAS, 430, 2097
- Jiang et al. (2007) Jiang, L., Fan, X., Vestergaard, M., et al. 2007, AJ, 134, 1150
- Jiang et al. (2006) Jiang, L., Fan, X., Hines, D. C., et al. 2006, AJ, 132, 2127
- Jiang et al. (2008) Jiang, L., Fan, X., Annis, J., et al. 2008, AJ, 135, 1057
- Jiang et al. (2010) Jiang, L., Fan, X., Brandt, W. N., et al. 2010, Nature, 464, 380
- Jiang et al. (2013) Jiang, L., Egami, E., Fan, X., et al. 2013, ApJ, 773, 153
- Juarez et al. (2009) Juarez, Y., Maiolino, R., Mujica, R., et al. 2009, A&A, 494, L25
- Jun et al. (2015) Jun, H. D., Im, M., Lee, H. M., et al. 2015, ApJ, 806, 109
- Kennicutt & Evans (2012) Kennicutt, R. C., & Evans, N. J. 2012, ARA&A, 50, 531
- Kennicutt (1998) Kennicutt, Jr., R. C. 1998, ARA&A, 36, 189
- Kennicutt et al. (1994) Kennicutt, Jr., R. C., Tamblyn, P., & Congdon, C. E. 1994, ApJ, 435, 22
- Kirkpatrick et al. (2012) Kirkpatrick, A., Pope, A., Alexander, D. M., et al. 2012, ApJ, 759, 139
- Kormendy & Ho (2013) Kormendy, J., & Ho, L. C. 2013, ARA&A, 51, 511
- Kroupa & Weidner (2003) Kroupa, P., & Weidner, C. 2003, ApJ, 598, 1076
- Kurk et al. (2009) Kurk, J. D., Walter, F., Fan, X., et al. 2009, ApJ, 702, 833
- Kurk et al. (2007) —. 2007, ApJ, 669, 32
- Lavalley et al. (1992) Lavalley, M., Isobe, T., & Feigelson, E. 1992, in Astronomical Society of the Pacific Conference Series, Vol. 25, Astronomical Data Analysis Software and Systems I, ed. D. M. Worrall, C. Biemesderfer, & J. Barnes, 245
- Le Floc’h et al. (2004) Le Floc’h, E., Pérez-González, P. G., Rieke, G. H., et al. 2004, ApJS, 154, 170
- Lebouteiller et al. (2011) Lebouteiller, V., Barry, D. J., Spoon, H. W. W., et al. 2011, ApJS, 196, 8
- Lee et al. (2009) Lee, J. C., Gil de Paz, A., Tremonti, C., et al. 2009, ApJ, 706, 599
- Leipski et al. (2013) Leipski, C., Meisenheimer, K., Walter, F., et al. 2013, ApJ, 772, 103
- Leipski et al. (2014) —. 2014, ApJ, 785, 154
- Leitet et al. (2011) Leitet, E., Bergvall, N., Piskunov, N., & Andersson, B.-G. 2011, A&A, 532, A107
- Li et al. (2008) Li, Y., Hopkins, P. F., Hernquist, L., et al. 2008, ApJ, 678, 41
- Lutz (2014) Lutz, D. 2014, ARA&A, 52, 373
- Madau & Dickinson (2014) Madau, P., & Dickinson, M. 2014, ARA&A, 52, 415
- Madden et al. (2006) Madden, S. C., Galliano, F., Jones, A. P., & Sauvage, M. 2006, A&A, 446, 877
- Madden et al. (2013) Madden, S. C., Rémy-Ruyer, A., Galametz, M., et al. 2013, PASP, 125, 600
- Magdis et al. (2013) Magdis, G. E., Rigopoulou, D., Helou, G., et al. 2013, A&A, 558, A136
- Magnelli et al. (2014) Magnelli, B., Lutz, D., Saintonge, A., et al. 2014, A&A, 561, A86
- Maier et al. (2014) Maier, C., Lilly, S. J., Ziegler, B. L., et al. 2014, ApJ, 792, 3
- Maiolino et al. (2005) Maiolino, R., Cox, P., Caselli, P., et al. 2005, A&A, 440, L51
- Maiolino et al. (2008) Maiolino, R., Nagao, T., Grazian, A., et al. 2008, A&A, 488, 463
- Maiolino et al. (2015) Maiolino, R., Carniani, S., Fontana, A., et al. 2015, ArXiv e-prints
- Mannucci et al. (2009) Mannucci, F., Cresci, G., Maiolino, R., et al. 2009, MNRAS, 398, 1915
- Marconi et al. (2004) Marconi, A., Risaliti, G., Gilli, R., et al. 2004, MNRAS, 351, 169
- Marshall et al. (2007) Marshall, J. A., Herter, T. L., Armus, L., et al. 2007, ApJ, 670, 129
- Matsuoka et al. (2009) Matsuoka, K., Nagao, T., Maiolino, R., Marconi, A., & Taniguchi, Y. 2009, A&A, 503, 721
- Matsuoka et al. (2011) —. 2011, A&A, 532, L10
- McGreer et al. (2013) McGreer, I. D., Jiang, L., Fan, X., et al. 2013, ApJ, 768, 105
- Mechtley et al. (2012) Mechtley, M., Windhorst, R. A., Ryan, R. E., et al. 2012, ApJ, 756, L38
- Mor & Netzer (2012) Mor, R., & Netzer, H. 2012, MNRAS, 420, 526
- Mor & Trakhtenbrot (2011) Mor, R., & Trakhtenbrot, B. 2011, ApJ, 737, L36
- Morganson et al. (2012) Morganson, E., De Rosa, G., Decarli, R., et al. 2012, AJ, 143, 142
- Mortlock et al. (2009) Mortlock, D. J., Patel, M., Warren, S. J., et al. 2009, A&A, 505, 97
- Mullaney et al. (2011) Mullaney, J. R., Alexander, D. M., Goulding, A. D., & Hickox, R. C. 2011, MNRAS, 414, 1082
- Muratov et al. (2015) Muratov, A. L., Keres, D., Faucher-Giguere, C.-A., et al. 2015, ArXiv e-prints
- Nagao et al. (2012) Nagao, T., Maiolino, R., De Breuck, C., et al. 2012, A&A, 542, L34
- Nagao et al. (2006) Nagao, T., Maiolino, R., & Marconi, A. 2006, A&A, 447, 863
- Netzer (2009) Netzer, H. 2009, MNRAS, 399, 1907
- Netzer et al. (2014) Netzer, H., Mor, R., Trakhtenbrot, B., Shemmer, O., & Lira, P. 2014, ApJ, 791, 34
- Netzer et al. (2007) Netzer, H., Lutz, D., Schweitzer, M., et al. 2007, ApJ, 666, 806
- Omont et al. (2013) Omont, A., Willott, C. J., Beelen, A., et al. 2013, A&A, 552, A43
- Östlin et al. (2001) Östlin, G., Amram, P., Bergvall, N., et al. 2001, A&A, 374, 800
- Östlin et al. (1999) Östlin, G., Amram, P., Masegosa, J., Bergvall, N., & Boulesteix, J. 1999, A&AS, 137, 419
- Östlin et al. (2009) Östlin, G., Hayes, M., Kunth, D., et al. 2009, AJ, 138, 923
- Ouchi et al. (2013) Ouchi, M., Ellis, R., Ono, Y., et al. 2013, ApJ, 778, 102
- Petric et al. (2003) Petric, A. O., Carilli, C. L., Bertoldi, F., et al. 2003, AJ, 126, 15
- Planck Collaboration et al. (2015) Planck Collaboration, Adam, R., Ade, P. A. R., et al. 2015, ArXiv e-prints
- Rawle et al. (2014) Rawle, T. D., Egami, E., Bussmann, R. S., et al. 2014, ApJ, 783, 59
- Rémy-Ruyer et al. (2013) Rémy-Ruyer, A., Madden, S. C., Galliano, F., et al. 2013, A&A, 557, A95
- Rémy-Ruyer et al. (2015a) —. 2015a, ArXiv e-prints
- Rémy-Ruyer et al. (2015b) —. 2015b, A&A, 573, C1
- Richards et al. (2006) Richards, G. T., Lacy, M., Storrie-Lombardi, L. J., et al. 2006, ApJS, 166, 470
- Riechers et al. (2006) Riechers, D. A., Walter, F., Carilli, C. L., et al. 2006, ApJ, 650, 604
- Riechers et al. (2013) Riechers, D. A., Bradford, C. M., Clements, D. L., et al. 2013, Nature, 496, 329
- Rieke et al. (2009) Rieke, G. H., Alonso-Herrero, A., Weiner, B. J., et al. 2009, ApJ, 692, 556
- Rodighiero et al. (2011) Rodighiero, G., Daddi, E., Baronchelli, I., et al. 2011, ApJ, 739, L40
- Rosario et al. (2012) Rosario, D. J., Santini, P., Lutz, D., et al. 2012, A&A, 545, A45
- Rujopakarn et al. (2011) Rujopakarn, W., Rieke, G. H., Eisenstein, D. J., & Juneau, S. 2011, ApJ, 726, 93
- Rujopakarn et al. (2013) Rujopakarn, W., Rieke, G. H., Weiner, B. J., et al. 2013, ApJ, 767, 73
- Runnoe et al. (2012) Runnoe, J. C., Brotherton, M. S., & Shang, Z. 2012, MNRAS, 422, 478
- Sajina et al. (2012) Sajina, A., Yan, L., Fadda, D., Dasyra, K., & Huynh, M. 2012, ApJ, 757, 13
- Salim et al. (2007) Salim, S., Rich, R. M., Charlot, S., et al. 2007, ApJS, 173, 267
- Salpeter (1955) Salpeter, E. E. 1955, ApJ, 121, 161
- Schneider et al. (2014) Schneider, R., Bianchi, S., Valiante, R., Risaliti, G., & Salvadori, S. 2014, ArXiv e-prints
- Schreiber et al. (2015) Schreiber, C., Pannella, M., Elbaz, D., et al. 2015, A&A, 575, A74
- Scott & Stewart (2014) Scott, A. E., & Stewart, G. C. 2014, MNRAS, 438, 2253
- Shang et al. (2011) Shang, Z., Brotherton, M. S., Wills, B. J., et al. 2011, ApJS, 196, 2
- Sugiura (1978) Sugiura, N. 1978, Communications in Statistics-Theory and Methods, 7, 13
- Symeonidis et al. (2009) Symeonidis, M., Page, M. J., Seymour, N., et al. 2009, MNRAS, 397, 1728
- Symeonidis et al. (2013) Symeonidis, M., Vaccari, M., Berta, S., et al. 2013, MNRAS, 431, 2317
- Targett et al. (2012) Targett, T. A., Dunlop, J. S., & McLure, R. J. 2012, MNRAS, 420, 3621
- Valiante et al. (2009) Valiante, R., Schneider, R., Bianchi, S., & Andersen, A. C. 2009, MNRAS, 397, 1661
- Walter et al. (2004) Walter, F., Carilli, C., Bertoldi, F., et al. 2004, ApJ, 615, L17
- Walter et al. (2009) Walter, F., Riechers, D., Cox, P., et al. 2009, Nature, 457, 699
- Wang et al. (2010a) Wang, J.-M., Yan, C.-S., Gao, H.-Q., et al. 2010a, ApJ, 719, L148
- Wang et al. (2011a) Wang, J.-M., Ge, J.-Q., Hu, C., et al. 2011a, ApJ, 739, 3
- Wang et al. (2008a) Wang, R., Wagg, J., Carilli, C. L., et al. 2008a, AJ, 135, 1201
- Wang et al. (2008b) Wang, R., Carilli, C. L., Wagg, J., et al. 2008b, ApJ, 687, 848
- Wang et al. (2010b) Wang, R., Carilli, C. L., Neri, R., et al. 2010b, ApJ, 714, 699
- Wang et al. (2011b) Wang, R., Wagg, J., Carilli, C. L., et al. 2011b, ApJ, 739, L34
- Wang et al. (2011c) —. 2011c, AJ, 142, 101
- Wang et al. (2013) —. 2013, ApJ, 773, 44
- Watson et al. (2015) Watson, D., Christensen, L., Knudsen, K. K., et al. 2015, Nature, 519, 327
- Willmer et al. (2009) Willmer, C. N. A., Rieke, G. H., Le Floc’h, E., et al. 2009, AJ, 138, 146
- Willott et al. (2015) Willott, C. J., Bergeron, J., & Omont, A. 2015, ApJ, 801, 123
- Willott et al. (2013) Willott, C. J., Omont, A., & Bergeron, J. 2013, ApJ, 770, 13
- Willott et al. (2010a) Willott, C. J., Albert, L., Arzoumanian, D., et al. 2010a, AJ, 140, 546
- Willott et al. (2010b) Willott, C. J., Delorme, P., Reylé, C., et al. 2010b, AJ, 139, 906
- Wright et al. (2010) Wright, E. L., Eisenhardt, P. R. M., Mainzer, A. K., et al. 2010, AJ, 140, 1868
- Wu et al. (2006) Wu, Y., Charmandaris, V., Hao, L., et al. 2006, ApJ, 639, 157
- Wu et al. (2007) Wu, Y., Charmandaris, V., Hunt, L. K., et al. 2007, ApJ, 662, 952
- Xu et al. (2015a) Xu, L., Rieke, G. H., Egami, E., et al. 2015a, ApJ, 808, 159
- Xu et al. (2015b) —. 2015b, ApJS, 219, 18
- Zafar et al. (2011) Zafar, T., Møller, P., Ledoux, C., et al. 2011, A&A, 532, A51
Appendix A Templates for Dwarf Galaxies
A.1. Sample and Infrared Data
The sample used to compute the SEDs of low-metallicity galaxies is from the Dwarf Galaxy Survey (DGS; Madden et al., 2013). This sample covers the full metallicity range observable in the local Universe with 12+log(O/H) ranging from 7.14 to 8.43, and spans four orders of magnitude in star formation rates.
The far-IR data adopted here is mainly from Rémy-Ruyer et al. (2013) 666Rémy-Ruyer et al. (2015b) corrected the PACS photometry for three galaxies, HS 0822+3542, HS 1442+4250 and Tol 0618. However, none of our arguments made in the appendix would be changed.. A total of 48 dwarf galaxies were observed with PACS and SPIRE on board of the Herschel Space Observatory at 70, 100, 160, 250, 350, and 500 . For I Zw 18, we update with the Herschel data from Fisher et al. (2014). We also collect the near-IR to mid-IR photometry data for the whole sample from the Wide-field Infrared Survey Explorer (WISE ,Wright et al. 2010) at 3.4, 4.6, 12 and 22 . 47 of these galaxies were found to have low-resolution mid-IR spectroscopic observations from the Spitzer archive. We collect the staring-mode Spitzer/IRS spectra from the Cornell Atlas of Spitzer/IRS Sources (CASSIS; Lebouteiller et al., 2011)777The Cornell Atlas of Spitzer/IRS Sources (CASSIS) is a product of the Infrared Science Center at Cornell University, supported by NASA and JPL. and adopt the post-BCD products from the Spitzer Heritage Archive (SHA) for mapping-mode observations, which were reduced in the SSC Pipeline Version S18.18. The latter spectral maps are combined into a single spectrum to represent the mid-IR emission continuum of the galaxy. However, since the surface brightnesses of dwarf galaxies are typically low, only a few Spitzer spectra have high enough signal-to-noise ratio (S/N) continuum to be useful for our derivation of the full IR SEDs. Finally, we focus on 19 DGS galaxies to study their IR SEDs.
A.2. SED Modeling and Template Construction888After the submission of this paper, a comprehensive study of the physical basis of the infrared SEDs of the DGS sample of galaxies was published by Rémy-Ruyer et al. (2015a). Their conclusions about the general shape of the SEDs are similar to ours.
In Rémy-Ruyer et al. (2013), a simple modified blackbody is fit to the far-IR photometry of the DGS sample to derive dust properties like temperature, mass, and emissivity index. After introducing the WISE mid-IR data at 12 and 22 , the far-IR SED peak shifts towards a shorter wavelength for the majority of sources, leading to a higher dust temperature. One single (modified) blackbody is not enough to represent the full IR SED, since galaxies always have a range of dust temperatures (e.g., Dunne & Eales, 2001; Willmer et al., 2009; Galametz et al., 2012; Kirkpatrick et al., 2012)
Here we utilize the Casey (2012) procedure (hereafter CMC fits) to address the mid-IR excess. Casey (2012) developed a fitting routine to fit the IR data points with a modified blackbody plus a power-law component. The mid-IR component is described as an analytical function
| (A1) |
where is the mid-IR power-law slope, and the power-law turnover wavelength. The normalizing factor and turnover wavelength are bounded with other parameters. We relax the bounding condition of to fit the diverse SEDs of the DGS sample, leaving other configurations unchanged (see Casey, 2012). Since the light from old stellar populations may contribute to the SED (mainly at short wavelengths), we assume the emission in the WISE W1 band is completely stellar and scale a Rayleigh-Jeans tail to estimate the stellar contribution to other bands. The final SED fit is done for data points after subtracting the possible old population stellar contribution from the observed fluxes.
In Table 7, we list the basic information and fit parameter values. In Figure 9, we show the SED continuum fits for the 19 DGS galaxies. We also present the results of single modified blackbody fits (only on Herschel data) for comparison.
Figure 10 shows the full infrared SEDs (after adding the Spitzer spectra) for the 19 DGS galaxies. The mid-IR continua derived from the photometry fitting and those directly obtained from the mid-IR spectra are consistent. The mid-infrared regions of these low-metallicity objects present substantial forbidden line emissions and weak or no PAH emission (e.g., Wu et al., 2006, 2007), which contribute little to the continuum. For the final model SEDs of the 19 DGS galaxies, we discard the mid-IR portion of the fit SED continua based on WISE and Herschel photometry, and replace it with scaled Spitzer spectra.
| Source | 12+log(O/H) | (K) | Mid-IR Spectrum? | ||
|---|---|---|---|---|---|
| (1) | (2) | (3) | (4) | (5) | (6) |
| Haro 11 | 8.360.01 | 46.51.0 | 1.89 | 3.63 | good |
| Haro 3 | 8.280.01 | 32.30.9 | 1.66 | 3.20 | limited |
| He 2-10 | 8.430.01 | 36.10.7 | 1.62 | 3.32 | good |
| HS 0017+1055 | 7.630.10 | 50.98.2 | 1.03 | 2.50 | good |
| HS 0052+2536 | 8.040.10 | 33.42.1 | 1.19 | 3.50 | good |
| HS 1304+3529 | 7.930.10 | 33.92.6 | 1.60 | 3.92 | good |
| IC 10 | 8.170.03 | 34.30.8 | 1.57 | 6.23 | poor |
| Mrk 1089 | 8.100.08 | 29.51.0 | 1.65 | 3.26 | good |
| Mrk 1450 | 7.840.01 | 40.61.5 | 1.39 | 3.91 | good |
| Mrk 153 | 7.860.04 | 33.32.3 | 1.90 | 3.82 | good |
| Mrk 209 | 7.740.01 | 38.41.2 | 1.63 | 4.14 | limited |
| Mrk 930 | 8.030.01 | 29.21.7 | 1.93 | 3.70 | good |
| NGC 1140 | 8.380.01 | 27.41.0 | 1.77 | 3.01 | good |
| NGC 4214 | 8.260.01 | 23.30.7 | 1.41 | 3.75 | limited |
| SBS 1415+437 | 7.550.01 | 38.93.2 | 1.23 | 4.14 | limited |
| UM 311 | 8.360.01 | 20.40.7 | 1.78 | 4.41 | limited |
| UM 448 | 8.320.01 | 31.31.0 | 2.03 | 3.30 | good |
| UM 461 | 7.730.01 | 40.02.0 | 0.90 | 3.40 | good |
| VII Zw 403 | 7.660.01 | 27.61.8 | 1.91 | 4.49 | good |
Note. — Col. (1): The galaxy name; Col. (2) The metallicity 12+log(O/H); Col. (3): The dust temperature derived from the CMC fit (see text); Col. (4): The far-IR emission index; Col. (5): The mid-IR power-law index; Col. (6): The existence of the mid-IR Spitzer spectrum: good – the galaxy has full range mid-IR spectrum; limited – the galaxy has mid-IR spectrum with limited coverage; poor – IC 10 is quite extended, as judged from its MIPS 24 image, making the Spitzer spectrum a poor reflection of the overall mid-IR continuum.
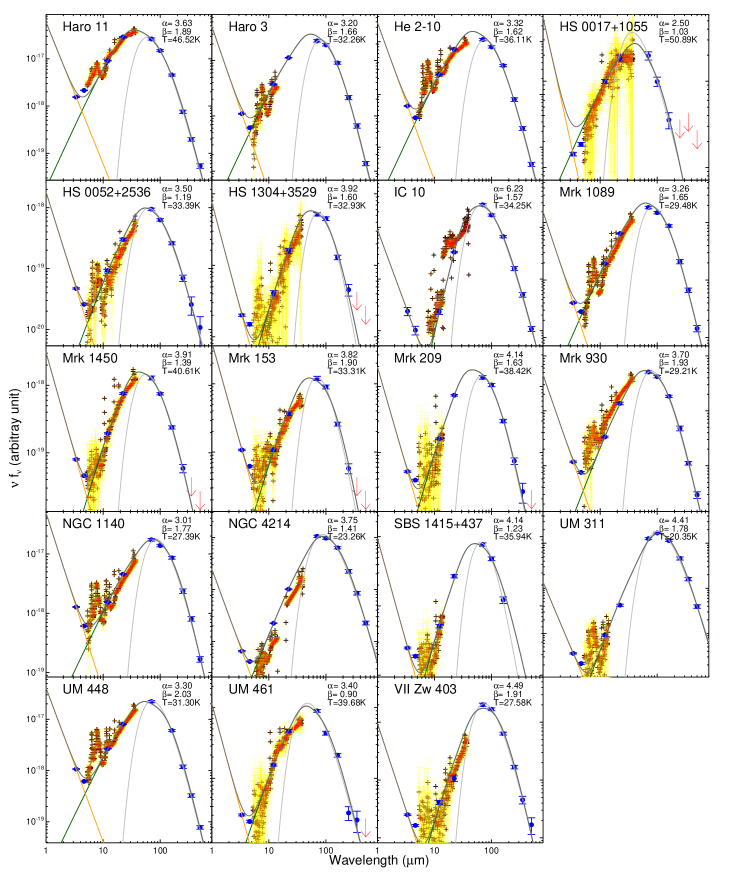
A.3. Features of low-metallicity galaxy templates
Figure 11 compares the 19 low-metallicity templates with the normal SF galaxy templates in Rieke et al. (2009). The SEDs of these dwarf galaxies show a lot of variation. Compared with the solar-metallicity galaxies, the low-metallicity infrared SEDs derived in this work tend to have the following features:
-
•
Higher far-IR dust temperature. For the low-metallicity galaxies, the typical dust temperature is . Our value is similar to the result by Rémy-Ruyer et al. (2013) (K). Compared with the Herschel KINGFISH sample (K, Rémy-Ruyer et al. 2013), which contains more metal-rich environments, the dust in these low-metallicity systems is generally warmer;
- •
-
•
Weaker aromatic features. The contribution of aromatic features to the infrared SED of low-metallicity galaxies is substantially lower than normal galaxies. The weaker aromatic features with decreasing metallicity have been reported by many authors (e.g., Engelbracht et al., 2005, 2008; Madden et al., 2006).
All of these features can be explained by a rich population of small (and/or hot) grains in the low-metallicity environments (e.g., Madden et al. 2006). In addition, some authors also report mm excess emission in these dwarf systems (e.g., Galliano et al. 2003, 2005; Galametz et al. 2009). Since the origin of this excess is not clear and its contribution to the infrared luminosity is tiny, we do not consider it in this work.
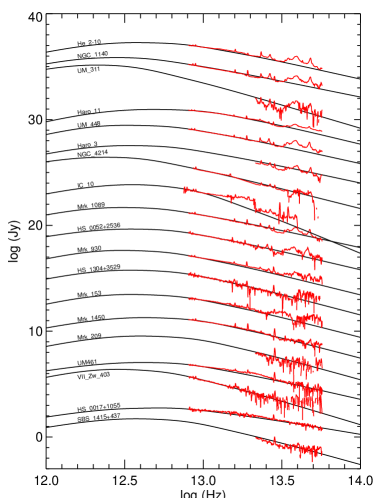
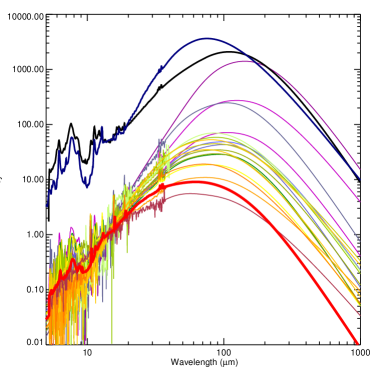
Appendix B Star formation in dwarf galaxies
B.1. Star Formation Determination
The star formation rate can be estimated by the 8-1000 infrared emission, following the Kennicutt (1998) star formation law,
| (B1) |
This relation is widely used for high- galaxies though it was originally established for star-bursting galaxies. However, it is not clear if and how it is valid for low-metallicity dwarf galaxies.
In general, the star formation in a galaxy can be both dust-obscured and dust-unobscured. For unobscured star formation, tracers that probe direct stellar light (e.g., the GALEX FUV at 0.153) or ionized gas tracers (e.g., H, Pa) are used. For dwarf galaxies, Lee et al. (2009) find FUV has a better performance than to trace the star formation, since the latter tends to underpredict the total SFR relative to the FUV for low luminosity systems. Therefore we use the FUV star formation law derived in Salim et al. (2007), a study that includes dwarf galaxies, to calculate the dust-unobscured star formation rate:
| (B2) |
The dust-obscured star formation can be determined from the dust-processed light at wavelengths where dust emission dominates (e.g., the 24 emission, the total infrared emission). We use MIPS 24 star formation law in Rieke et al. (2009):
| (B3) |
The final star formation rates of these dwarf galaxies are assumed to be a sum of these two components, which will be compared with that derived from the total infrared luminosity (Equation B1).
We collect GALEX FUV and MIPS 24 data to derive the star formation. All of the 19 dwarf galaxies above have MIPS 24 observations, and 14/19 have GALEX FUV observations. We retrieve their photometry from the catalog of Spitzer Enhanced Imaging Products101010 http://irsa.ipac.caltech.edu/data/SPITZER/Enhanced/SEIP/overview.html and the GALEX offical online catalog111111 http://galex.stsci.edu/GalexView/. IC10, NGC 4214, UM 311, VII Zw 403 are either too extended or have a close companion in their MIPS 24 images, thus they were removed from the comparison. GALEX FUV photometry can be found for all sources with MIPS observations.
In Figure 12, we compare the star formation rates derived from the 8-1000 infrared emission and those derived from the combined GALEX FUV and MIPS 24 emission. Within a three order-of-magnitude dynamical range, the star formation rates from these two approaches are generally consistent, without any obvious offset due to metallicity effect. Thus, we conclude the behavior of Kennicutt (1998) star formation law is similar to other star formation indicators for the population of dwarf galaxies, at least for those studied in this work, and not very sensitive to metallicity.
| Source | 12+(O/H) | SFRIR | SFRFUV | SFR24μm | SFRFUV+24μm | |
|---|---|---|---|---|---|---|
| () | () | () | () | () | ||
| (1) | (2) | (3) | (4) | (5) | (6) | (7) |
| Haro 11 | 8.360.01 | 1.77 | 30.60 | 3.37 | 56.06 | 59.43 |
| Haro 3 | 8.280.01 | 0.057 | 0.99 | 0.22 | 0.82 | 1.04 |
| He 2-10 | 8.430.01 | 0.061 | 1.05 | – | 1.13 | – |
| HS 0017+1055 | 7.630.10 | 0.0095 | 0.16 | – | 0.26 | – |
| HS 0052+2536 | 8.040.10 | 0.18 | 3.07 | 1.57 | 1.88 | 3.45 |
| HS 1304+3529 | 7.930.01 | 0.017 | 0.30 | – | 0.18 | – |
| IC 10 | 8.170.03 | 0.000055 | 0.00095 | – | – | – |
| Mrk 1089 | 8.100.08 | 0.35 | 6.10 | 2.40 | 3.49 | 5.89 |
| Mrk 1450 | 7.840.01 | 0.0030 | 0.053 | – | 0.064 | – |
| Mrk 153 | 7.860.04 | 0.0098 | 0.17 | 0.67 | 0.12 | 0.79 |
| Mrk 209 | 7.740.01 | 0.00029 | 0.0051 | 0.012 | 0.0046 | 0.017 |
| Mrk 930 | 8.030.01 | 0.16 | 2.78 | 1.13 | 2.70 | 3.83 |
| NGC 1140 | 8.380.01 | 0.036 | 0.62 | 0.49 | 0.32 | 0.81 |
| NGC 4214 | 8.260.01 | 0.0040 | 0.070 | 0.076 | – | – |
| SBS 1415+437 | 7.250.01 | 0.00070 | 0.012 | 0.033 | 0.0094 | 0.042 |
| UM 311 | 8.360.01 | 0.037 | 0.65 | 0.21 | – | – |
| UM 448 | 8.320.01 | 0.88 | 15.15 | 2.19 | 11.76 | 13.95 |
| UM 461 | 7.730.01 | 0.00091 | 0.016 | 0.0010 | 0.017 | 0.028 |
| VII Zw 403 | 7.660.01 | 0.00016 | 0.0028 | 0.0065 | – | – |
Note. — Objects with ‘–’ in Column (5), (6) do not have corresponding observations or are not point-sources to be included in the catalogs (see text).
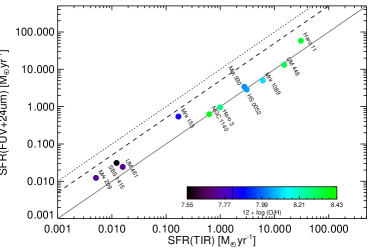
B.2. Star Formation Law of Haro 11
As discussed in Section 2, Haro 11 was selected as the candidate galaxy template for high- galaxies. With ample observations presented in the literature, its star formation rate can be estimated using various star-formation indicators, including the 8-1000 infrared luminosity, MIPS 24 emission, H emission-line luminosity, and FUSE/GALEX FUV luminosity. Following the calibrations listed above, we estimate its star formation rates and summarize these results in Table 9.
| Method | Luminosity ()a | SFR () | SFR Law | Reference |
|---|---|---|---|---|
| 30.6 | Kennicutt (1998) | this work | ||
| MIPS 24 | 56.1 | Rieke et al. (2009) | this work | |
| H (Fabry-Perot)b | 39.1 | Kennicutt et al. (1994) | Östlin et al. (1999) | |
| H (HST image)b | 25.7 | Kennicutt et al. (1994) | Östlin et al. (2009) | |
| GALEX FUV (0.153)c | 3.4 | Salim et al. (2007) | this work | |
| FUSE FUV (0.115)c | 4.5 | Kennicutt (1998) | Grimes et al. (2007) |
Note. — a All luminosities are scaled to the distance 92.1 Mpc (Bergvall et al., 2006). b We corrected the extinction based on the observed Balmer decrement (Bergvall & Östlin, 2002) with the assumption of an intrinsic ratio 2.85 and a Calzetti (2001) extinction law. The attenuation at V-band is estimated to be , suggesting the intrinsic H flux would be a factor of 1.34 larger than the observed. c For the UV band, since we do not make extinction corrections, the SFR(FUV) listed here are only for unobscured star formation.
The SFR determined from the 24 emission is times higher than that from either or . This discrepancy is a direct consequence of its hot SED (Engelbracht et al., 2008) and the resulting large fraction of its emitted at 24 (see Figure 13)121212Another galaxy with SFR(24)/SFR(FIR) in our low-metallicty galaxy sample is Mrk 153, which hosts an AGN that boosts the mid-IR emission.. Given the close agreement in the SFRs from H and , we conclude that Haro 11 falls above the trend line in Figure 12 because FUV+24 overestimates the SFR and gives a valid estimate. Moreover, since Haro 11 presents very young stellar populations (Adamo et al., 2010), the contamination of emission from old stars to the far infrared emission is negligible, which makes the , following the Kennicutt (1998) SF law, a robust tracer of the obscured star formation
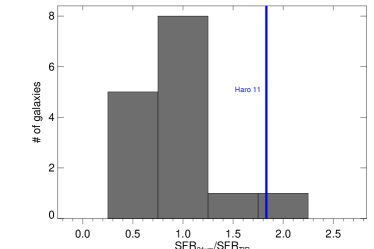
We use the FUV luminosity based on GALEX observation and assume the star formation law in Salim et al. (2007) to estimate the unobscured star formation. The final adopted star formation rate of Haro 11, which is 34.0 , is based on a combination of GALEX FUV emission and the 8-1000 infrared emission. We can finally relate the infrared luminosity and FUV luminosity of Haro 11 to its total star formation rate, which includes both the obscured and the unobscured, as
| (B4) | ||||
| (B5) |
This is the star formation law used for the Haro 11 template in the main part of this paper.